Estimated zip code population in 2022: 41,400 Zip code population in 2010: 40,893 Zip code population in 2000: 42,078
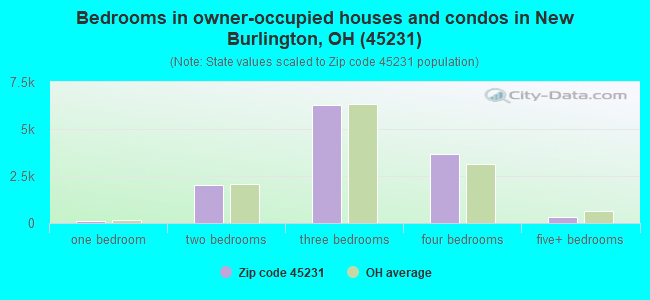
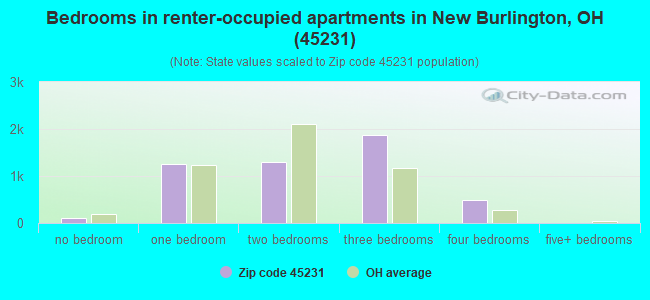
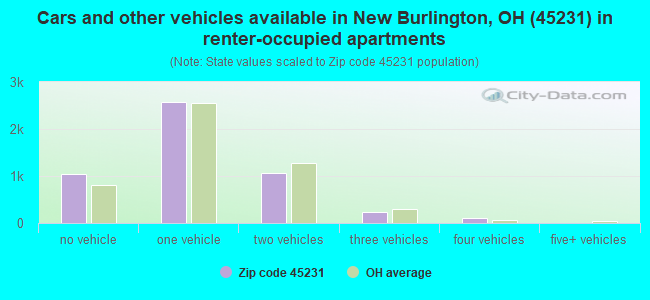
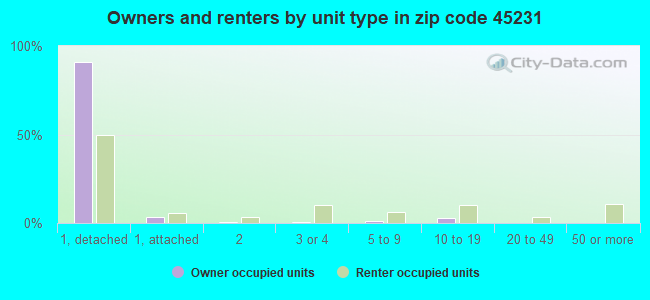
Houses and condos: 18,464 Renter-occupied apartments: 5,051
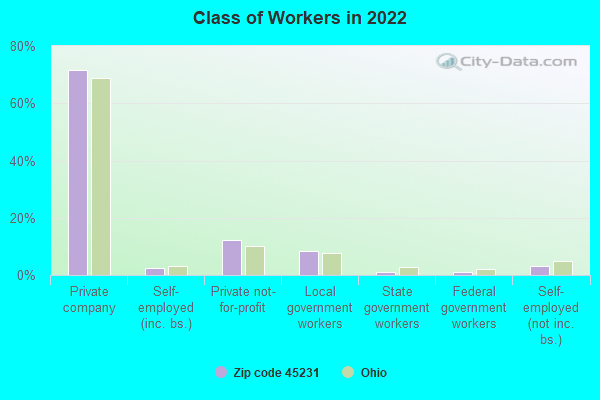
% of renters here:
29%
State:
33%
March 2022 cost of living index in zip code 45231: 88.1 (less than average, U.S. average is 100)
Land area: 14.4 sq. mi. Water area: 0.2 sq. mi.
Population density: 2,885 people per square mile
(average).
OSM Map
General Map
Google Map
MSN Map
OSM Map
General Map
Google Map
MSN Map
OSM Map
General Map
Google Map
MSN Map
OSM Map
General Map
Google Map
MSN Map
Please wait while loading the map...
Real estate property taxes paid for housing units in 2022:
This zip code:
1.6% ($2,678)
Ohio:
1.3% ($2,639)
Median real estate property taxes paid for housing units with mortgages in 2022: $2,639 (1.5%) Median real estate property taxes paid for housing units with no mortgage in 2022: $2,800 (1.9%)
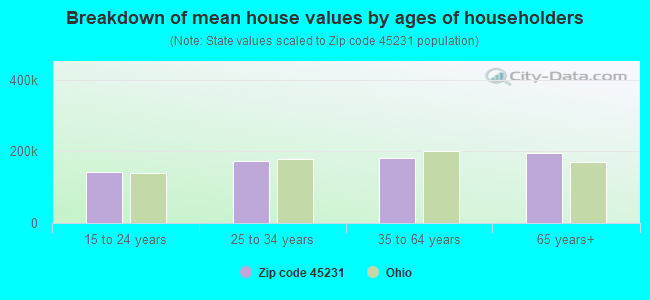
Estimated median house/condo value in 2022: $167,467
45231:
$167,467
Ohio:
$204,100
According to our research of Ohio and other state lists, there were 54 registered sex offenders living in 45231 zip code as of April 27, 2024. The ratio of all residents to sex offenders in zip code 45231 is 747 to 1. The ratio of registered sex offenders to all residents in this zip code is lower than the state average.
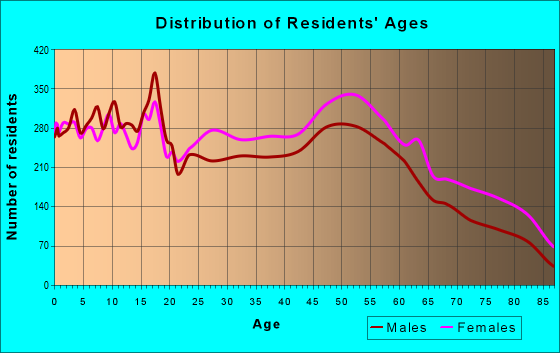
Median resident age:
This zip code:
41.9 years
Ohio median age:
39.9 years
Average household size:
This zip code:
2.3 people
Ohio:
2.4 people
Averages for the 2020 tax year for zip code 45231, filed in 2021:
Average Adjusted Gross Income (AGI) in 2020: $49,813 (Individual Income Tax Returns)
Here:
$49,813
State:
$67,288
Salary/wage: $43,170 (reported on 83.9% of returns)
Here:
$43,170
State:
$55,628
(% of AGI for various income ranges: 1144.4% for AGIs below $25k, 3667.7% for AGIs $25k-50k, 6489.7% for AGIs $50k-75k, 9777.2% for AGIs $75k-100k, 17070.6% for AGIs $100k-200k, 73331.2% for AGIs over 200k)
Taxable interest for individuals: $817 (reported on 18.9% of returns)
This zip code:
$817
Ohio:
$1,518
(% of AGI for various income ranges: 6.0% for AGIs below $25k, 11.7% for AGIs $25k-50k, 21.6% for AGIs $50k-75k, 37.9% for AGIs $75k-100k, 75.0% for AGIs $100k-200k, 735.0% for AGIs over 200k)
Ordinary dividends: $6,021 (reported on 14.8% of returns)
Here:
$6,021
State:
$7,167
(% of AGI for various income ranges: 16.6% for AGIs below $25k, 31.8% for AGIs $25k-50k, 101.4% for AGIs $50k-75k, 206.4% for AGIs $75k-100k, 615.5% for AGIs $100k-200k, 6358.8% for AGIs over 200k)
Net capital gain/loss in AGI: +$10,582 (reported on 11.1% of returns)
Here:
+$10,582
State:
+$18,919
(% of AGI for various income ranges: 5.3% for AGIs below $25k, 20.3% for AGIs $25k-50k, 64.4% for AGIs $50k-75k, 176.8% for AGIs $75k-100k, 699.3% for AGIs $100k-200k, 16320.0% for AGIs over 200k)
Profit/loss from business: +$7,807 (reported on 12.8% of returns)
Here:
+$7,807
State:
+$13,744
(% of AGI for various income ranges: 73.5% for AGIs below $25k, 63.8% for AGIs $25k-50k, 132.6% for AGIs $50k-75k, 162.3% for AGIs $75k-100k, 565.1% for AGIs $100k-200k, 3541.2% for AGIs over 200k)
Taxable individual retirement arrangement distribution: $19,525 (reported on 7.9% of returns)
45231:
$19,525
Ohio:
$18,876
(% of AGI for various income ranges: 43.6% for AGIs below $25k, 71.7% for AGIs $25k-50k, 230.5% for AGIs $50k-75k, 410.8% for AGIs $75k-100k, 1034.4% for AGIs $100k-200k, 6958.8% for AGIs over 200k)
Self-employed (Keogh) retirement plans: $17,325 (reported on 0.2% of returns)
45231:
$17,325
Ohio:
$24,898
(% of AGI for various income ranges: 64.8% for AGIs $100k-200k)
Total itemized deductions: $27,536 (reported on 4.4% of returns)
Here:
$27,536
State:
$33,869
(% of AGI for various income ranges: 18.2% for AGIs below $25k, 55.3% for AGIs $25k-50k, 192.5% for AGIs $50k-75k, 368.2% for AGIs $75k-100k, 753.7% for AGIs $100k-200k, 6248.8% for AGIs over 200k)
Charity contributions: $10,075 (reported on 3.4% of returns)
Here:
$10,075
State:
$14,577
(% of AGI for various income ranges: 2.3% for AGIs below $25k, 9.7% for AGIs $25k-50k, 37.0% for AGIs $50k-75k, 82.6% for AGIs $75k-100k, 266.4% for AGIs $100k-200k, 2692.5% for AGIs over 200k)
Taxes paid: $6,687 (reported on 4.4% of returns)
45231:
$6,687
State:
$7,681
(% of AGI for various income ranges: 3.4% for AGIs below $25k, 11.6% for AGIs $25k-50k, 48.4% for AGIs $50k-75k, 105.4% for AGIs $75k-100k, 212.7% for AGIs $100k-200k, 1018.8% for AGIs over 200k)
Earned income credit: $2,500 (reported on 20.7% of returns)
Here:
$2,500
State:
$2,304
(% of AGI for various income ranges: 123.1% for AGIs below $25k, 77.7% for AGIs $25k-50k, 0.9% for AGIs $50k-75k)
Percentage of individuals using paid preparers for their 2020 taxes: 93.1%
Here:
93%
State:
94%
(% for various income ranges: 92.4% for AGIs below $25k, 94.5% for AGIs $25k-50k, 92.5% for AGIs $50k-75k, 93.7% for AGIs $75k-100k, 91.3% for AGIs $100k-200k, 90.3% for AGIs over 200k)
Averages for the 2012 tax year for zip code 45231, filed in 2013:
Average Adjusted Gross Income (AGI) in 2012: $43,646 (Individual Income Tax Returns)
Here:
$43,646
State:
$54,926
Salary/wage: $38,332 (reported on 85.2% of returns)
Here:
$38,332
State:
$45,869
(% of AGI for various income ranges: 76.3% for AGIs below $25k, 80.8% for AGIs $25k-50k, 77.4% for AGIs $50k-75k, 74.3% for AGIs $75k-100k, 72.0% for AGIs $100k-200k, 58.6% for AGIs over 200k)
Taxable interest for individuals: $832 (reported on 23.9% of returns)
This zip code:
$832
Ohio:
$1,297
(% of AGI for various income ranges: 0.6% for AGIs below $25k, 0.3% for AGIs $25k-50k, 0.4% for AGIs $50k-75k, 0.4% for AGIs $75k-100k, 0.6% for AGIs $100k-200k, 0.8% for AGIs over 200k)
Ordinary dividends: $4,948 (reported on 19.2% of returns)
Here:
$4,948
State:
$5,821
(% of AGI for various income ranges: 1.3% for AGIs below $25k, 1.0% for AGIs $25k-50k, 1.4% for AGIs $50k-75k, 2.0% for AGIs $75k-100k, 3.0% for AGIs $100k-200k, 6.6% for AGIs over 200k)
Net capital gain/loss in AGI: +$4,758 (reported on 11.6% of returns)
Here:
+$4,758
State:
+$11,232
(% of AGI for various income ranges: 0.5% for AGIs $50k-75k, 0.9% for AGIs $75k-100k, 1.7% for AGIs $100k-200k, 7.6% for AGIs over 200k)
Profit/loss from business: +$8,953 (reported on 11.5% of returns)
Here:
+$8,953
State:
+$12,773
(% of AGI for various income ranges: 6.6% for AGIs below $25k, 1.7% for AGIs $25k-50k, 1.7% for AGIs $50k-75k, 1.7% for AGIs $75k-100k, 2.3% for AGIs $100k-200k, 1.3% for AGIs over 200k)
Taxable individual retirement arrangement distribution: $17,271 (reported on 10.3% of returns)
45231:
$17,271
Ohio:
$14,511
(% of AGI for various income ranges: 2.8% for AGIs below $25k, 2.5% for AGIs $25k-50k, 2.8% for AGIs $50k-75k, 4.4% for AGIs $75k-100k, 6.5% for AGIs $100k-200k, 6.9% for AGIs over 200k)
Self-employment retirement plans: $15,475 (reported on 0.2% of returns)
45231:
$15,475
Ohio:
$20,257
(% of AGI for various income ranges: 0.3% for AGIs $100k-200k)
Total itemized deductions: $16,976 (21% of AGI, reported on 28.8% of returns)
Here:
$16,976
State:
$21,278
Here:
21.2% of AGI
State:
18.8% of AGI
(% of AGI for various income ranges: 6.3% for AGIs below $25k, 8.9% for AGIs $25k-50k, 12.2% for AGIs $50k-75k, 12.5% for AGIs $75k-100k, 14.1% for AGIs $100k-200k, 12.4% for AGIs over 200k)
Charity contributions: $3,385 (reported on 22.4% of returns)
Here:
$3,385
State:
$3,943
(% of AGI for various income ranges: 0.5% for AGIs below $25k, 1.1% for AGIs $25k-50k, 1.8% for AGIs $50k-75k, 2.1% for AGIs $75k-100k, 2.5% for AGIs $100k-200k, 2.5% for AGIs over 200k)
Taxes paid: $6,714 (reported on 28.6% of returns)
45231:
$6,714
State:
$9,568
(% of AGI for various income ranges: 1.5% for AGIs below $25k, 2.7% for AGIs $25k-50k, 4.3% for AGIs $50k-75k, 5.0% for AGIs $75k-100k, 6.6% for AGIs $100k-200k, 7.1% for AGIs over 200k)
Earned income credit: $2,433 (reported on 22.4% of returns)
Here:
$2,433
State:
$2,285
(% of AGI for various income ranges: 8.5% for AGIs below $25k, 1.1% for AGIs $25k-50k)
Percentage of individuals using paid preparers for their 2012 taxes: 43.4%
Here:
43%
State:
51%
(% for various income ranges: 38.7% for AGIs below $25k, 43.7% for AGIs $25k-50k, 48.2% for AGIs $50k-75k, 50.3% for AGIs $75k-100k, 47.9% for AGIs $100k-200k, 66.7% for AGIs over 200k)
Averages for the 2004 tax year for zip code 45231, filed in 2005:
Average Adjusted Gross Income (AGI) in 2004: $38,577 (Individual Income Tax Returns)
Here:
$38,577
State:
$44,480
Salary/wage: $34,865 (reported on 86.7% of returns)
Here:
$34,865
State:
$39,198
(% of AGI for various income ranges: 94.0% for AGIs below $10k, 77.5% for AGIs $10k-25k, 83.1% for AGIs $25k-50k, 82.4% for AGIs $50k-75k, 80.4% for AGIs $75k-100k, 64.4% for AGIs over 100k)
Taxable interest for individuals: $1,062 (reported on 37.4% of returns)
This zip code:
$1,062
Ohio:
$1,532
(% of AGI for various income ranges: 3.1% for AGIs below $10k, 1.7% for AGIs $10k-25k, 0.8% for AGIs $25k-50k, 0.7% for AGIs $50k-75k, 0.9% for AGIs $75k-100k, 1.3% for AGIs over 100k)
Taxable dividends: $3,471 (reported on 24.9% of returns)
Here:
$3,471
State:
$3,496
(% of AGI for various income ranges: 3.1% for AGIs below $10k, 1.7% for AGIs $10k-25k, 1.2% for AGIs $25k-50k, 1.7% for AGIs $50k-75k, 2.2% for AGIs $75k-100k, 4.5% for AGIs over 100k)
Net capital gain/loss: +$4,326 (reported on 16.0% of returns)
Here:
+$4,326
State:
+$8,582
(% of AGI for various income ranges: -1.7% for AGIs below $10k, 0.2% for AGIs $10k-25k, 0.4% for AGIs $25k-50k, 0.7% for AGIs $50k-75k, 1.7% for AGIs $75k-100k, 6.4% for AGIs over 100k)
Profit/loss from business: +$8,306 (reported on 10.5% of returns)
Here:
+$8,306
State:
+$10,813
(% of AGI for various income ranges: 4.3% for AGIs below $10k, 2.9% for AGIs $10k-25k, 2.2% for AGIs $25k-50k, 1.7% for AGIs $50k-75k, 1.5% for AGIs $75k-100k, 3.0% for AGIs over 100k)
IRA payment deduction: $2,470 (reported on 2.1% of returns)
45231:
$2,470
Ohio:
$2,794
(% of AGI for various income ranges: 0.2% for AGIs below $10k, 0.1% for AGIs $10k-25k, 0.2% for AGIs $25k-50k, 0.1% for AGIs $50k-75k, 0.1% for AGIs $75k-100k, 0.1% for AGIs over 100k)
Self-employed pension: $9,598 (reported on 0.4% of returns)
Here:
$9,598
Ohio:
$13,981
(% of AGI for various income ranges: 0.1% for AGIs $25k-50k, 0.1% for AGIs $50k-75k, 0.1% for AGIs $75k-100k, 0.3% for AGIs over 100k)
Total itemized deductions: $15,095 (24% of AGI, reported on 37.1% of returns)
Here:
$15,095
State:
$17,503
Here:
23.6% of AGI
State:
20.8% of AGI
(% of AGI for various income ranges: 9.5% for AGIs below $10k, 8.6% for AGIs $10k-25k, 12.9% for AGIs $25k-50k, 15.8% for AGIs $50k-75k, 16.5% for AGIs $75k-100k, 17.4% for AGIs over 100k)
Charity contributions deductions: $2,710 (4% of AGI, reported on 31.2% of returns)
Here:
$2,710
State:
$3,087
Here:
4.0% of AGI
State:
3.4% of AGI
(% of AGI for various income ranges: 0.6% for AGIs below $10k, 1.0% for AGIs $10k-25k, 1.6% for AGIs $25k-50k, 2.3% for AGIs $50k-75k, 2.8% for AGIs $75k-100k, 3.2% for AGIs over 100k)
Total tax: $4,775 (reported on 75.0% of returns)
45231:
$4,775
State:
$6,781
(% of AGI for various income ranges: 2.3% for AGIs below $10k, 3.8% for AGIs $10k-25k, 7.0% for AGIs $25k-50k, 9.1% for AGIs $50k-75k, 10.0% for AGIs $75k-100k, 15.8% for AGIs over 100k)
Earned income credit: $1,828 (reported on 16.2% of returns)
Here:
$1,828
State:
$1,696
Percentage of individuals using paid preparers for their 2004 taxes: 50.1%
Here:
50%
State:
55%
(% for various income ranges: 40.6% for AGIs below $10k, 53.6% for AGIs $10k-25k, 52.4% for AGIs $25k-50k, 52.0% for AGIs $50k-75k, 47.2% for AGIs $75k-100k, 53.5% for AGIs over 100k)
Likely homosexual households (counted as self-reported same-sex unmarried-partner households)
Lesbian couples: 0.2% of all households
Gay men: 0.2% of all households
Household received Food Stamps/SNAP in the past 12 months: 2,711 Household did not receive Food Stamps/SNAP in the past 12 months: 14,782
Women who had a birth in the past 12 months: 321 (171 now married, 147 unmarried) Women who did not have a birth in the past 12 months: 8,597 (2,644 now married, 5,956 unmarried)
Housing units in zip code 45231 with a mortgage: 8,497 (918 second mortgage, 106 home equity loan, 629 both second mortgage and home equity loan) Houses without a mortgage: 211
Median monthly owner costs for units with a mortgage: $1,265 Median monthly owner costs for units without a mortgage: $572
Residents with income below the poverty level in 2022:
This zip code:
13.6%
Whole state:
13.4%
Residents with income below 50% of the poverty level in 2022:
This zip code:
7.4%
Whole state:
7.0%
Median number of rooms in houses and condos:
Here:
6.6
State:
6.7
Median number of rooms in apartments:
Here:
4.9
State:
4.4
Notable locations in this zip code not listed on our city pages
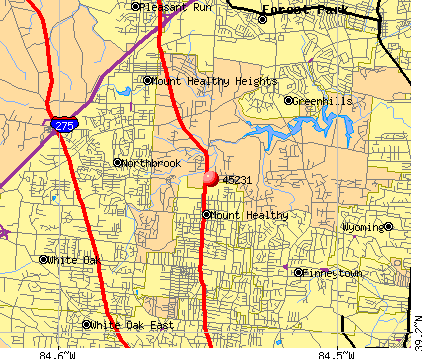
Notable locations in zip code 45231: Old Mill Valley Picnic Area (A), Parkey's Farm Riding Center (B), Southshore Grove Picnic Area (C), Hawk Knoll Picnic Area (D), Mount Healthy Hatchery (E), Springfield Township Hall (F), Mount Healthy Fire Department (G), Springfield Township Fire Department Station 79 (H), Clovernook Home (I), Mount Healthy Municipal Building (J), Springfield Township Fire Department Station 75 (K), Springfield Township Fire Department Station 80 (L), Mount Healthy Police Department (M). Display/hide their locations on the map
Shopping Centers: Brentwood Plaza Shopping Center (1), Northbrook Shopping Center (2), Hilltop Plaza Shopping Center (3). Display/hide their locations on the map
Churches in zip code 45231 include: Brentwood Church (A), Central Church (B), Corpus Christi Church (C), Augsburg Lutheran Church (D), Northern Hill Church (E), Highview Church (F), Faith Church (G), Southland Missionary Baptist Church (H), Seven Hills Church of God (I). Display/hide their locations on the map
Cemeteries: Beech Grove Cemetery (1), Springdale Road Baptist Cemetery (2), Arlington Memorial Gardens Cemetery (3), New Burlington Cemetery (4), Mount Pleasant Cemetery (5), Schluniger Cemetery (6). Display/hide their locations on the map
Parks in zip code 45231 include: Springfield Township Athletic Field (1), Forest Avenue Wetland Park (2), Heritage Park (3), Northbrook Civic Association Playfield (4), Brentwood Park (5). Display/hide their locations on the map
In group quarters: 733 (-1 institutionalized population)
Size of family households: 5,834 2-persons, 2,211 3-persons, 1,756 4-persons, 850 5-persons, 221 6-persons, 125 7-or-more-persons
Size of nonfamily households: 5,554 1-person, 770 2-persons, 153 3-persons
3,473 married couples with children.
4,639 single-parent households (496 men, 4,143 women).
95.3% of residents of 45231 zip code speak English at home.
1.3% of residents speak Spanish at home (69% very well, 9% well, 7% not well, 16% not at all).
2.4% of residents speak other Indo-European language at home (73% very well, 9% well, 18% not well).
0.5% of residents speak Asian or Pacific Island language at home (55% very well, 16% well, 29% not well).
0.5% of residents speak other language at home (73% very well, 21% well, 6% not well).
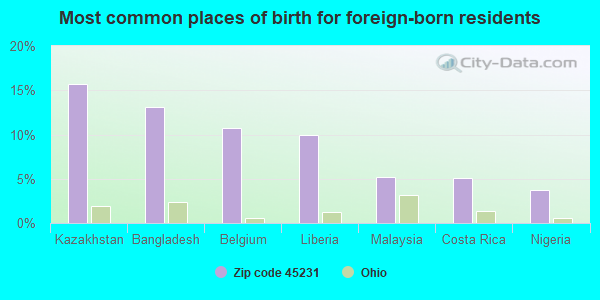
Foreign born population: 1,520 (3.7%) (75.9% of them are naturalized citizens)
This zip code:
3.7%
Whole state:
5.0%
16%Kazakhstan
13%Bangladesh
11%Belgium
10%Liberia
5%Malaysia
5%Costa Rica
4%Nigeria
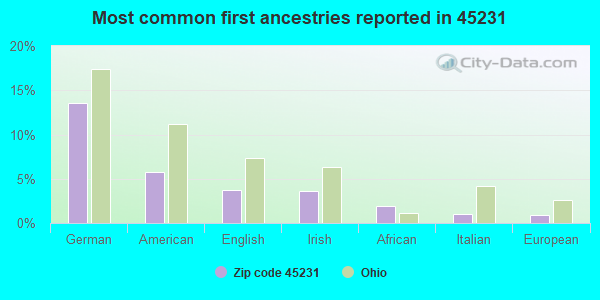
14%German
6%American
4%English
4%Irish
2%African
1%Italian
1%European
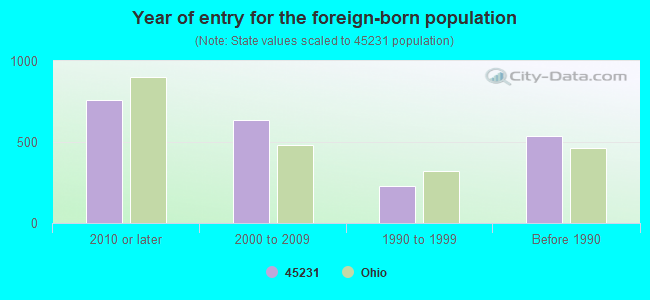
Year of entry for the foreign-born population
7612010 or later
6332000 to 2009
2301990 to 1999
536Before 1990
Facilities with environmental interests located in this zip code:
BARRETT PAVING MATERIALS INC PLT 58 * (12075 HAMILTON PIKE in CINCINNATI, OH)
AIR MINOR (AIRS/AFS) STATE MASTER (Ohio general info) - AIR MAJOR, RCRA-OHD101492056, HAZARDOUS WASTE PROGRAM USED OIL PROGRAM (Resource Conservation and Recovery Act (tracking hazardous waste)) Business SIC classification: ASPHALT PAVING MIXTURES AND BLOCKS Alternative names: BARRETT PAVING MATERIALS INCORPORATED, BARRETT PAVING MATERIALS INC PLEASANT *
APPAREL CARE CLEANERS (8610 WINTON ROAD in CINCINNATI, OH)
AIR MINOR (AIRS/AFS) STATE MASTER (Ohio general info) - AIR MAJOR Small Quantity Generators, between 100 kg and 1000 kg of hazardous waste/month (Resource Conservation and Recovery Act (tracking hazardous waste)) - notification Business SIC classification: DRYCLEANING PLANTS, EXCEPT RUG CLEANING Organizations: WRIGHT JAMES (CONTACT/OWNER)
BIG SYCAMORE PICNIC AREA (WEST RD in CINCINNATI, OH)
STATE MASTER (Ohio general info) - PCS-OH0133728, National Pollutant Discharge Elimination System Permit National Pollutant Discharge Elimination System NON-MAJOR (Tracking pollutant discharge elimination systems) - permit Business SIC classification: AMUSEMENT AND RECREATION SERVICES Organizations: HAMILTON CO PARK DIST (CONTACT/OWNER)
Alternative names: HAMILTON CTY PRK BIG SYCAMORE
CHAR MAC PET CREMATION AND BURIAL SERVICE (11798 HAMILTON AVE in CINCINNATI, OH)
AIR MINOR (AIRS/AFS) STATE MASTER (Ohio general info) - AIR MAJOR Business SIC classification: REFUSE SYSTEMS; CEMETERY SUBDIVIDERS AND DEVELOPERS Organizations: CHAR-MAC PET CREMATION & BURIA (CONTACT/OWNER)
BEECH HILL CUSTOM CLEANERS (1195 W GALBRAITH RD in CINCINNATI, OH)
STATE MASTER (Ohio general info) - AIR MAJOR, RCRA-OHD981797863, HAZARDOUS WASTE PROGRAM Conditionally Exempt Small Quantity Generators, less than 100 kg/month of hazardous waste (Resource Conservation and Recovery Act (tracking hazardous waste)) Organizations: EGER WILLIAM (CONTACT/OWNER)
Alternative names: BEECH HILL CLEANERS
BP OIL NO 08977 (8201 WINTON RD in CINCINNATI, OH)
STATE MASTER (Ohio general info) - AIR MAJOR, -31-5541-1038-W, EPCRA, RCRA-OHD987029360, HAZARDOUS WASTE PROGRAM Conditionally Exempt Small Quantity Generators, less than 100 kg/month of hazardous waste (Resource Conservation and Recovery Act (tracking hazardous waste)) - notification Organizations: BP OIL CO (CONTACT/OWNER)
, BP OIL COMPANY (CONTACT/OWNER)
Alternative names: BP OIL CO SITE 08977
BP OIL NO 09270 * (11901 HAMILTON AVE in CINCINNATI, OH)
STATE MASTER (Ohio general info) - AIR MAJOR, RCRA-OHD987029352, HAZARDOUS WASTE PROGRAM Conditionally Exempt Small Quantity Generators, less than 100 kg/month of hazardous waste (Resource Conservation and Recovery Act (tracking hazardous waste)) - notification Organizations: BP OIL CO (CONTACT/OWNER)
, BP OIL COMPANY (CONTACT/OWNER)
Alternative names: BP OIL CO SITE 09270
BP OIL NO 09283 (10980 HAMILTON AVE in CINCINNATI, OH)
STATE MASTER (Ohio general info) - AIR MAJOR, -315541-1038-NN, EPCRA, RCRA-OHD987028156, HAZARDOUS WASTE PROGRAM Conditionally Exempt Small Quantity Generators, less than 100 kg/month of hazardous waste (Resource Conservation and Recovery Act (tracking hazardous waste)) - notification Organizations: BP OIL CO (CONTACT/OWNER)
, BP OIL COMPANY (CONTACT/OWNER)
Alternative names: BP OIL CO SITE 09283
BP OIL CO SITE 08781 (7938 HAMILTON AVE in CINCINNATI, OH)
(Resource Conservation and Recovery Act (tracking hazardous waste)) Organizations: BP OIL COMPANY (CONTACT/OWNER)
Housing units lacking complete plumbing facilities: 0.6% Housing units lacking complete kitchen facilities: 1.1%
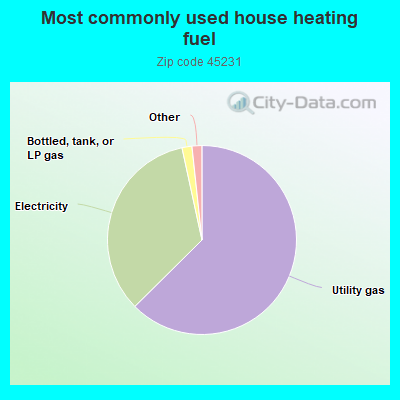
62.6%Utility gas
34.0%Electricity
1.7%Bottled, tank, or LP gas
0.7%No fuel used
0.6%Fuel oil, kerosene, etc.
Population in 1990: 44,838.
Place of birth for U.S.-born residents:
This state: 32,069
Northeast: 1,139
Midwest: 1,974
South: 3,533
West: 459
61% of the 45231 zip code residents lived in the same house 5 years ago. Out of people who lived in different houses, 78% lived in this county. Out of people who lived in different counties, 50% lived in Ohio.
91% of the 45231 zip code residents lived in the same house 1 year ago. Out of people who lived in different houses, 70% moved from this county. Out of people who lived in different houses, 12% moved from different county within same state. Out of people who lived in different houses, 16% moved from different state.
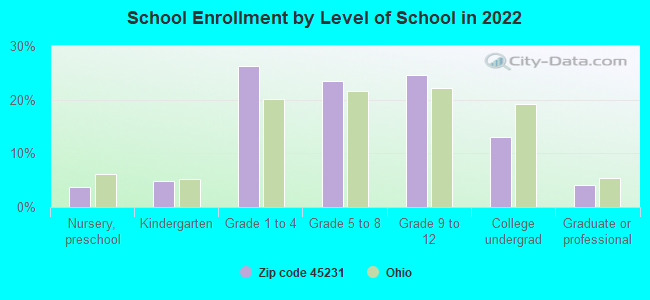
Private vs. public school enrollment:
Students in private schools in grades 1 to 8 (elementary and middle school): 1,195
Here:
27.6%
Ohio:
16.0%
Students in private schools in grades 9 to 12 (high school): 371
Here:
17.7%
Ohio:
13.1%
Students in private undergraduate colleges: 311
Here:
27.9%
Ohio:
22.3%
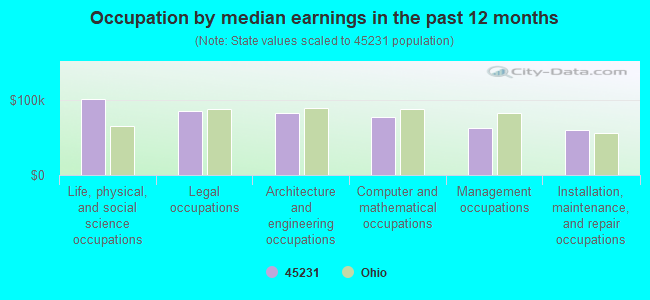
Occupation by median earnings in the past 12 months ($)
101,108Life, physical, and social science occupations
85,681Legal occupations
82,117Architecture and engineering occupations
76,623Computer and mathematical occupations
62,073Management occupations
60,477Installation, maintenance, and repair occupations
Top industries in this zip code by the number of employees in 2005:
2002 - 2018 National Fire Incident Reporting System (NFIRS) incidents
Based on the data from the years 2002 - 2018 the average number of fires per year is 218. The highest number of fire incidents - 277 took place in 2009, and the least - 136 in 2002. The data has a rising trend.
When looking into fire subcategories, the most reports belonged to: Structure Fires (66.3%), and Outside Fires (20.2%).
Fire incident types reported to NFIRS in Zip Code 45231
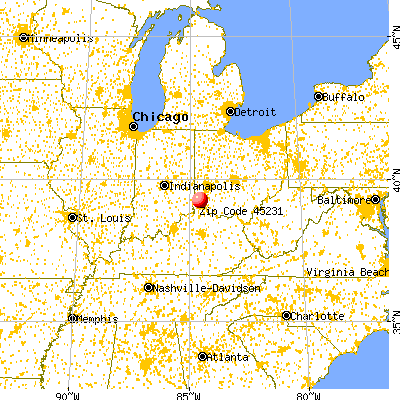


 Nearest zip codes: 45218, 45240, 45224, 45239, 45232, 45251.
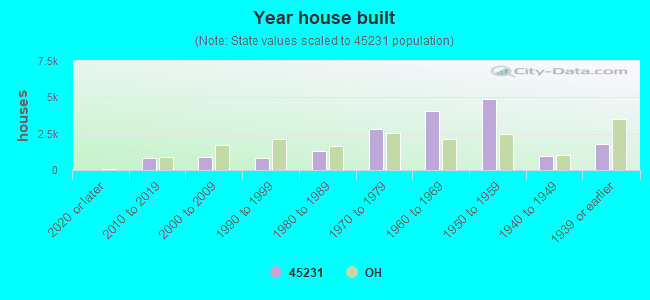


 Based on the data from the years 2002 - 2018 the average number of fires per year is 218. The highest number of fire incidents - 277 took place in 2009, and the least - 136 in 2002. The data has a rising trend.
 When looking into fire subcategories, the most reports belonged to: Structure Fires (66.3%), and Outside Fires (20.2%).