Estimated zip code population in 2022: 29,172 Zip code population in 2010: 27,286 Zip code population in 2000: 28,556
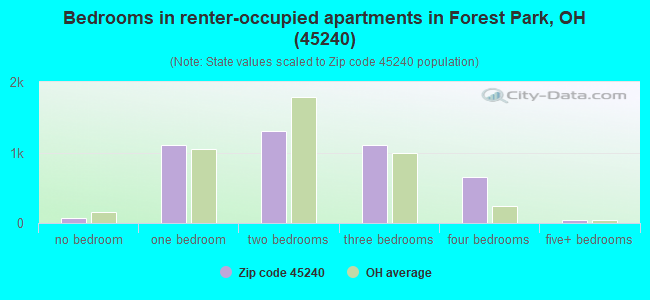
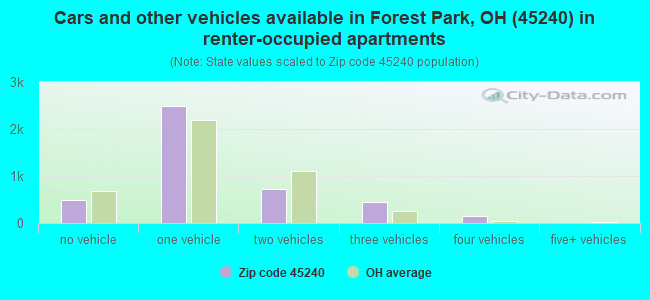
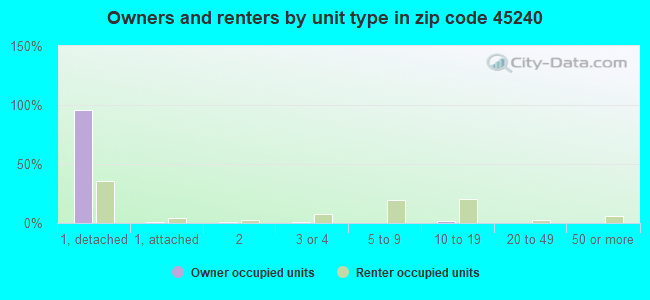
Houses and condos: 11,421 Renter-occupied apartments: 4,296
% of renters here:
39%
State:
33%
March 2022 cost of living index in zip code 45240: 88.5 (less than average, U.S. average is 100)
Land area: 9.2 sq. mi. Water area: 0.1 sq. mi.
Population density: 3,159 people per square mile
(average).
OSM Map
General Map
Google Map
MSN Map
OSM Map
General Map
Google Map
MSN Map
OSM Map
General Map
Google Map
MSN Map
OSM Map
General Map
Google Map
MSN Map
Please wait while loading the map...
Real estate property taxes paid for housing units in 2022:
This zip code:
1.5% ($2,820)
Ohio:
1.3% ($2,639)
Median real estate property taxes paid for housing units with mortgages in 2022: $2,828 (1.5%) Median real estate property taxes paid for housing units with no mortgage in 2022: $2,819 (1.8%)
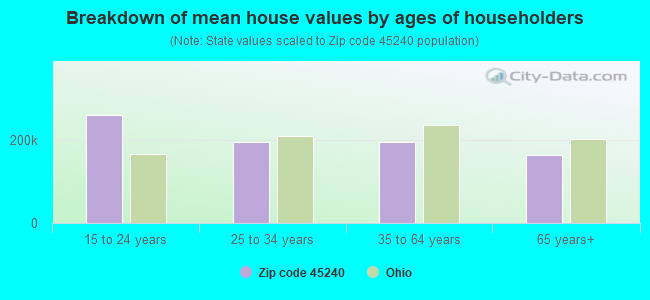
Estimated median house/condo value in 2022: $183,278
45240:
$183,278
Ohio:
$204,100
According to our research of Ohio and other state lists, there were 28 registered sex offenders living in 45240 zip code as of April 26, 2024. The ratio of all residents to sex offenders in zip code 45240 is 995 to 1. The ratio of registered sex offenders to all residents in this zip code is lower than the state average.
Median resident age:
This zip code:
37.3 years
Ohio median age:
39.9 years
Average household size:
This zip code:
2.6 people
Ohio:
2.4 people
Averages for the 2020 tax year for zip code 45240, filed in 2021:
Average Adjusted Gross Income (AGI) in 2020: $45,950 (Individual Income Tax Returns)
Here:
$45,950
State:
$67,288
Salary/wage: $41,310 (reported on 85.1% of returns)
Here:
$41,310
State:
$55,628
(% of AGI for various income ranges: 1217.8% for AGIs below $25k, 3700.7% for AGIs $25k-50k, 6805.9% for AGIs $50k-75k, 10461.9% for AGIs $75k-100k, 17797.8% for AGIs $100k-200k, 65953.3% for AGIs over 200k)
Taxable interest for individuals: $557 (reported on 14.1% of returns)
This zip code:
$557
Ohio:
$1,518
(% of AGI for various income ranges: 3.6% for AGIs below $25k, 5.5% for AGIs $25k-50k, 10.6% for AGIs $50k-75k, 35.8% for AGIs $75k-100k, 46.0% for AGIs $100k-200k, 213.3% for AGIs over 200k)
Ordinary dividends: $3,208 (reported on 9.7% of returns)
Here:
$3,208
State:
$7,167
(% of AGI for various income ranges: 7.8% for AGIs below $25k, 13.1% for AGIs $25k-50k, 36.8% for AGIs $50k-75k, 114.7% for AGIs $75k-100k, 234.9% for AGIs $100k-200k, 2656.7% for AGIs over 200k)
Net capital gain/loss in AGI: +$4,370 (reported on 6.7% of returns)
Here:
+$4,370
State:
+$18,919
(% of AGI for various income ranges: 0.5% for AGIs below $25k, 7.5% for AGIs $25k-50k, 29.0% for AGIs $50k-75k, 106.0% for AGIs $75k-100k, 353.2% for AGIs $100k-200k, 1540.0% for AGIs over 200k)
Profit/loss from business: +$6,208 (reported on 14.5% of returns)
Here:
+$6,208
State:
+$13,744
(% of AGI for various income ranges: 75.6% for AGIs below $25k, 64.6% for AGIs $25k-50k, 111.7% for AGIs $50k-75k, 271.5% for AGIs $75k-100k, 443.4% for AGIs $100k-200k, 3423.3% for AGIs over 200k)
Taxable individual retirement arrangement distribution: $17,783 (reported on 5.9% of returns)
45240:
$17,783
Ohio:
$18,876
(% of AGI for various income ranges: 31.7% for AGIs below $25k, 57.9% for AGIs $25k-50k, 128.9% for AGIs $50k-75k, 360.0% for AGIs $75k-100k, 1082.2% for AGIs $100k-200k)
Total itemized deductions: $24,473 (reported on 4.5% of returns)
Here:
$24,473
State:
$33,869
(% of AGI for various income ranges: 17.3% for AGIs below $25k, 54.6% for AGIs $25k-50k, 203.5% for AGIs $50k-75k, 457.5% for AGIs $75k-100k, 830.0% for AGIs $100k-200k, 4113.3% for AGIs over 200k)
Charity contributions: $9,113 (reported on 3.7% of returns)
Here:
$9,113
State:
$14,577
(% of AGI for various income ranges: 1.9% for AGIs below $25k, 9.7% for AGIs $25k-50k, 54.9% for AGIs $50k-75k, 132.1% for AGIs $75k-100k, 308.5% for AGIs $100k-200k, 1953.3% for AGIs over 200k)
Taxes paid: $6,742 (reported on 4.4% of returns)
45240:
$6,742
State:
$7,681
(% of AGI for various income ranges: 3.6% for AGIs below $25k, 11.1% for AGIs $25k-50k, 57.2% for AGIs $50k-75k, 137.1% for AGIs $75k-100k, 241.5% for AGIs $100k-200k, 956.7% for AGIs over 200k)
Earned income credit: $2,533 (reported on 21.4% of returns)
Here:
$2,533
State:
$2,304
(% of AGI for various income ranges: 117.5% for AGIs below $25k, 86.4% for AGIs $25k-50k)
Percentage of individuals using paid preparers for their 2020 taxes: 92.0%
Here:
92%
State:
94%
(% for various income ranges: 91.0% for AGIs below $25k, 94.3% for AGIs $25k-50k, 92.0% for AGIs $50k-75k, 90.1% for AGIs $75k-100k, 90.2% for AGIs $100k-200k, 81.8% for AGIs over 200k)
Averages for the 2012 tax year for zip code 45240, filed in 2013:
Average Adjusted Gross Income (AGI) in 2012: $41,338 (Individual Income Tax Returns)
Here:
$41,338
State:
$54,926
Salary/wage: $36,880 (reported on 87.4% of returns)
Here:
$36,880
State:
$45,869
(% of AGI for various income ranges: 78.7% for AGIs below $25k, 81.8% for AGIs $25k-50k, 77.8% for AGIs $50k-75k, 78.0% for AGIs $75k-100k, 76.5% for AGIs $100k-200k, 62.2% for AGIs over 200k)
Taxable interest for individuals: $489 (reported on 18.7% of returns)
This zip code:
$489
Ohio:
$1,297
(% of AGI for various income ranges: 0.2% for AGIs below $25k, 0.2% for AGIs $25k-50k, 0.2% for AGIs $50k-75k, 0.2% for AGIs $75k-100k, 0.3% for AGIs $100k-200k, 0.2% for AGIs over 200k)
Ordinary dividends: $2,933 (reported on 13.4% of returns)
Here:
$2,933
State:
$5,821
(% of AGI for various income ranges: 0.6% for AGIs below $25k, 0.4% for AGIs $25k-50k, 0.7% for AGIs $50k-75k, 0.7% for AGIs $75k-100k, 1.5% for AGIs $100k-200k, 4.9% for AGIs over 200k)
Net capital gain/loss in AGI: +$3,397 (reported on 7.1% of returns)
Here:
+$3,397
State:
+$11,232
(% of AGI for various income ranges: 0.4% for AGIs $75k-100k, 0.7% for AGIs $100k-200k, 7.6% for AGIs over 200k)
Profit/loss from business: +$6,605 (reported on 11.8% of returns)
Here:
+$6,605
State:
+$12,773
(% of AGI for various income ranges: 6.3% for AGIs below $25k, 1.2% for AGIs $25k-50k, 1.0% for AGIs $50k-75k, 1.1% for AGIs $75k-100k, 1.8% for AGIs $100k-200k)
Taxable individual retirement arrangement distribution: $15,349 (reported on 7.9% of returns)
45240:
$15,349
Ohio:
$14,511
(% of AGI for various income ranges: 1.9% for AGIs below $25k, 2.1% for AGIs $25k-50k, 2.6% for AGIs $50k-75k, 3.3% for AGIs $75k-100k, 3.7% for AGIs $100k-200k, 8.0% for AGIs over 200k)
Total itemized deductions: $16,812 (23% of AGI, reported on 29.2% of returns)
Here:
$16,812
State:
$21,278
Here:
22.7% of AGI
State:
18.8% of AGI
(% of AGI for various income ranges: 5.4% for AGIs below $25k, 9.8% for AGIs $25k-50k, 13.5% for AGIs $50k-75k, 14.1% for AGIs $75k-100k, 14.9% for AGIs $100k-200k, 12.8% for AGIs over 200k)
Charity contributions: $3,608 (reported on 23.2% of returns)
Here:
$3,608
State:
$3,943
(% of AGI for various income ranges: 0.5% for AGIs below $25k, 1.4% for AGIs $25k-50k, 2.3% for AGIs $50k-75k, 2.4% for AGIs $75k-100k, 3.1% for AGIs $100k-200k, 2.6% for AGIs over 200k)
Taxes paid: $5,948 (reported on 29.2% of returns)
45240:
$5,948
State:
$9,568
(% of AGI for various income ranges: 1.2% for AGIs below $25k, 2.7% for AGIs $25k-50k, 4.5% for AGIs $50k-75k, 5.3% for AGIs $75k-100k, 6.3% for AGIs $100k-200k, 6.3% for AGIs over 200k)
Earned income credit: $2,563 (reported on 24.0% of returns)
Here:
$2,563
State:
$2,285
(% of AGI for various income ranges: 9.2% for AGIs below $25k, 1.2% for AGIs $25k-50k)
Percentage of individuals using paid preparers for their 2012 taxes: 42.8%
Here:
43%
State:
51%
(% for various income ranges: 38.2% for AGIs below $25k, 44.3% for AGIs $25k-50k, 48.4% for AGIs $50k-75k, 49.1% for AGIs $75k-100k, 45.6% for AGIs $100k-200k, 55.6% for AGIs over 200k)
Averages for the 2004 tax year for zip code 45240, filed in 2005:
Average Adjusted Gross Income (AGI) in 2004: $39,170 (Individual Income Tax Returns)
Here:
$39,170
State:
$44,480
Salary/wage: $36,343 (reported on 90.0% of returns)
Here:
$36,343
State:
$39,198
(% of AGI for various income ranges: 116.2% for AGIs below $10k, 82.1% for AGIs $10k-25k, 84.4% for AGIs $25k-50k, 85.1% for AGIs $50k-75k, 84.9% for AGIs $75k-100k, 76.8% for AGIs over 100k)
Taxable interest for individuals: $668 (reported on 29.6% of returns)
This zip code:
$668
Ohio:
$1,532
(% of AGI for various income ranges: 1.8% for AGIs below $10k, 0.8% for AGIs $10k-25k, 0.4% for AGIs $25k-50k, 0.3% for AGIs $50k-75k, 0.5% for AGIs $75k-100k, 0.6% for AGIs over 100k)
Taxable dividends: $2,228 (reported on 18.3% of returns)
Here:
$2,228
State:
$3,496
(% of AGI for various income ranges: 1.7% for AGIs below $10k, 0.9% for AGIs $10k-25k, 0.6% for AGIs $25k-50k, 0.7% for AGIs $50k-75k, 1.1% for AGIs $75k-100k, 2.1% for AGIs over 100k)
Net capital gain/loss: +$3,463 (reported on 11.5% of returns)
Here:
+$3,463
State:
+$8,582
(% of AGI for various income ranges: -0.6% for AGIs below $10k, 0.1% for AGIs $10k-25k, 0.2% for AGIs $25k-50k, 0.5% for AGIs $50k-75k, 0.6% for AGIs $75k-100k, 3.8% for AGIs over 100k)
Profit/loss from business: +$5,096 (reported on 11.2% of returns)
Here:
+$5,096
State:
+$10,813
(% of AGI for various income ranges: 3.1% for AGIs below $10k, 3.1% for AGIs $10k-25k, 1.3% for AGIs $25k-50k, 0.9% for AGIs $50k-75k, 1.1% for AGIs $75k-100k, 1.5% for AGIs over 100k)
IRA payment deduction: $2,228 (reported on 1.8% of returns)
45240:
$2,228
Ohio:
$2,794
(% of AGI for various income ranges: 0.2% for AGIs $10k-25k, 0.1% for AGIs $25k-50k, 0.1% for AGIs $50k-75k, 0.1% for AGIs $75k-100k, 0.1% for AGIs over 100k)
Self-employed pension: $6,032 (reported on 0.2% of returns)
Here:
$6,032
Ohio:
$13,981
Total itemized deductions: $15,651 (24% of AGI, reported on 39.2% of returns)
Here:
$15,651
State:
$17,503
Here:
24.4% of AGI
State:
20.8% of AGI
(% of AGI for various income ranges: 8.4% for AGIs below $10k, 9.5% for AGIs $10k-25k, 14.3% for AGIs $25k-50k, 18.2% for AGIs $50k-75k, 17.5% for AGIs $75k-100k, 16.8% for AGIs over 100k)
Charity contributions deductions: $3,066 (5% of AGI, reported on 34.1% of returns)
Here:
$3,066
State:
$3,087
Here:
4.6% of AGI
State:
3.4% of AGI
(% of AGI for various income ranges: 0.7% for AGIs below $10k, 1.2% for AGIs $10k-25k, 2.1% for AGIs $25k-50k, 3.1% for AGIs $50k-75k, 3.2% for AGIs $75k-100k, 3.4% for AGIs over 100k)
Total tax: $4,800 (reported on 73.7% of returns)
45240:
$4,800
State:
$6,781
(% of AGI for various income ranges: 2.3% for AGIs below $10k, 3.7% for AGIs $10k-25k, 6.7% for AGIs $25k-50k, 8.9% for AGIs $50k-75k, 10.1% for AGIs $75k-100k, 14.9% for AGIs over 100k)
Earned income credit: $1,863 (reported on 17.5% of returns)
Here:
$1,863
State:
$1,696
Percentage of individuals using paid preparers for their 2004 taxes: 49.8%
Here:
50%
State:
55%
(% for various income ranges: 39.5% for AGIs below $10k, 53.6% for AGIs $10k-25k, 53.6% for AGIs $25k-50k, 52.5% for AGIs $50k-75k, 45.3% for AGIs $75k-100k, 48.1% for AGIs over 100k)
Household received Food Stamps/SNAP in the past 12 months: 1,047 Household did not receive Food Stamps/SNAP in the past 12 months: 10,099
Women who had a birth in the past 12 months: 373 (245 now married, 127 unmarried) Women who did not have a birth in the past 12 months: 6,487 (1,647 now married, 4,844 unmarried)
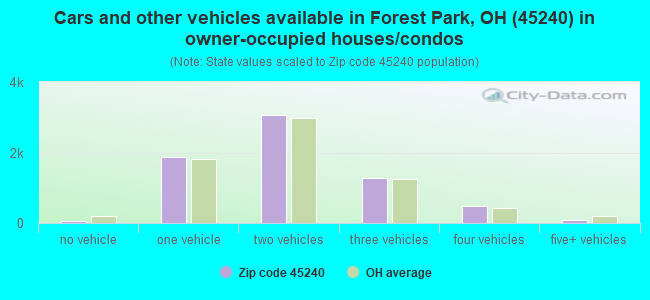
Housing units in zip code 45240 with a mortgage: 4,857 (456 second mortgage, 99 home equity loan, 280 both second mortgage and home equity loan) Houses without a mortgage: 136
Median monthly owner costs for units with a mortgage: $1,408 Median monthly owner costs for units without a mortgage: $565
Residents with income below the poverty level in 2022:
This zip code:
14.7%
Whole state:
13.4%
Residents with income below 50% of the poverty level in 2022:
This zip code:
9.2%
Whole state:
7.0%
Median number of rooms in houses and condos:
Here:
7.0
State:
6.7
Median number of rooms in apartments:
Here:
4.5
State:
4.4
Notable locations in this zip code not listed on our city pages
Notable locations in zip code 45240: Interstate Industrial Park (A), Cincinnati Mills (B), Possum Run Youth Camp (C), Mushroom Glade Picnic Area (D), Northland Industrial Park (E), Camp Claybanks (F), Winton Woods Golf Course (G), Kanter Office Park (H), Sharon Road Industrial Area (I), Kemper Meadow Business Center (J), Circle Office Park (K), Crossway Industrial Park (L), Forest Park Fire Department Station 42 (M), Forest Park Fire Department Station 43 (N), Forest Park City Hall (O). Display/hide their locations on the map
Shopping Centers: Promenade Shopping Center (1), Cobblewood Plaza Shopping Center (2), Central Park Plaza Shopping Center (3), Forest Park Plaza Shopping Center (4), Forest Park Square Shopping Center (5), Springdale Mini-Mall Shopping Center (6), Civic Center Plaza Shopping Center (7). Display/hide their locations on the map
Churches in zip code 45240 include: Saint Matthias Church (A), Forest Park Christian Church (B), Forest Chapel United Methodist Church (C), Episcopal Church of the Holy Spirit (D), Temple Baptist Church (E). Display/hide their locations on the map
2,098 married couples with children.
3,956 single-parent households (588 men, 3,368 women).
86.1% of residents of 45240 zip code speak English at home.
7.6% of residents speak Spanish at home (53% very well, 14% well, 26% not well, 6% not at all).
2.8% of residents speak other Indo-European language at home (26% very well, 49% well, 18% not well, 7% not at all).
1.3% of residents speak Asian or Pacific Island language at home (74% very well, 14% well, 13% not well).
2.6% of residents speak other language at home (53% very well, 19% well, 9% not well, 20% not at all).
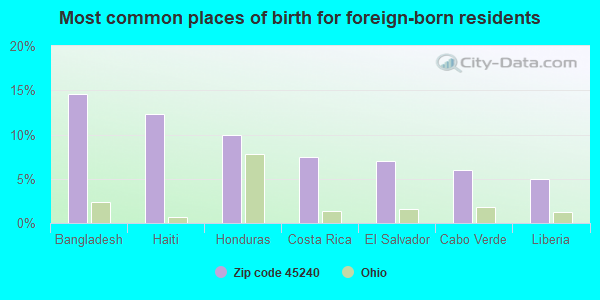
Foreign born population: 3,435 (11.8%) (42.6% of them are naturalized citizens)
This zip code:
11.8%
Whole state:
5.0%
15%Bangladesh
12%Haiti
10%Honduras
7%Costa Rica
7%El Salvador
6%Cabo Verde
5%Liberia
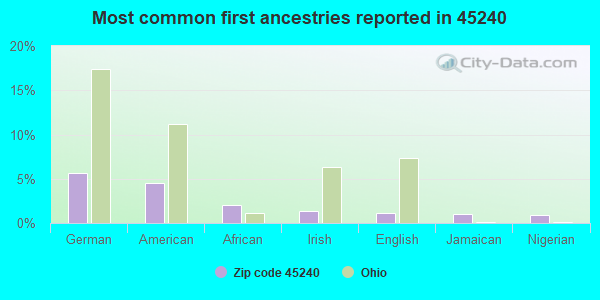
6%German
4%American
2%African
1%Irish
1%English
1%Jamaican
1%Nigerian
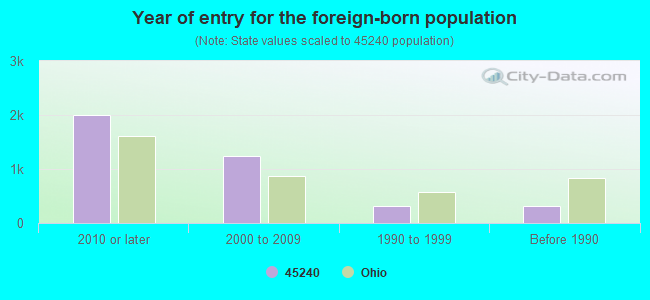
Year of entry for the foreign-born population
1,9942010 or later
1,2492000 to 2009
3141990 to 1999
316Before 1990
Facilities with environmental interests located in this zip code:
AMERICAN METAL CLEANING OF CINCINNATI (475 NORTHLAND BLVD in FOREST PARK, OH)
AIR MINOR (AIRS/AFS) (Integrated Compliance Information System) - ICIS-05-1986-0346, FORMAL ENFORCEMENT ACTION STATE MASTER (Ohio general info) - AIR MAJOR Small Quantity Generators, between 100 kg and 1000 kg of hazardous waste/month (Resource Conservation and Recovery Act (tracking hazardous waste)) - notification Business SIC classification: ELECTROPLATING, PLATING, POLISHING, ANODIZING, AND COLORING Organizations: JAMES TAYLOR (CONTACT/OWNER)
CHEMLAWN CORP (2070 SCHAPPELLE LANE in CINCINNATI, OH)
BP FACILITY #22756 (1201 OMNIPLEX DR in CINCINNATI, OH)
Small Quantity Generators, between 100 kg and 1000 kg of hazardous waste/month (Resource Conservation and Recovery Act (tracking hazardous waste)) Organizations: BP PRODUCTS NORTH AMERICA INC (CONTACT/OPERATOR)
Housing units lacking complete plumbing facilities: 0.2% Housing units lacking complete kitchen facilities: 0.2%
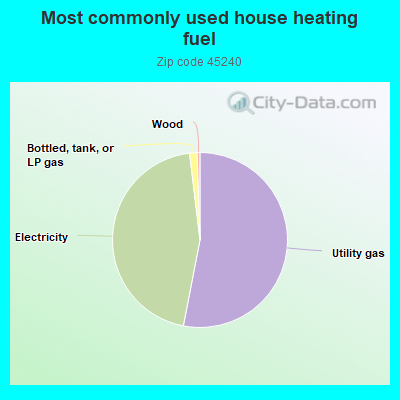
52.9%Utility gas
44.9%Electricity
1.4%Bottled, tank, or LP gas
0.5%Wood
Population in 1990: 27,517. Population change in the 1990s: +1,039 (+3.8%).
Place of birth for U.S.-born residents:
This state: 18,844
Northeast: 1,092
Midwest: 1,304
South: 3,519
West: 675
59% of the 45240 zip code residents lived in the same house 5 years ago. Out of people who lived in different houses, 65% lived in this county. Out of people who lived in different counties, 50% lived in Ohio.
91% of the 45240 zip code residents lived in the same house 1 year ago. Out of people who lived in different houses, 57% moved from this county. Out of people who lived in different houses, 35% moved from different county within same state. Out of people who lived in different houses, 6% moved from different state. Out of people who lived in different houses, 4% moved from abroad.
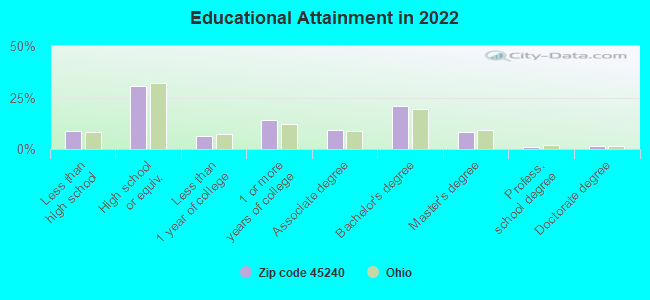
Private vs. public school enrollment:
Students in private schools in grades 1 to 8 (elementary and middle school): 1,019
Here:
30.9%
Ohio:
16.0%
Students in private schools in grades 9 to 12 (high school): 242
Here:
14.1%
Ohio:
13.1%
Students in private undergraduate colleges: 195
Here:
17.5%
Ohio:
22.3%
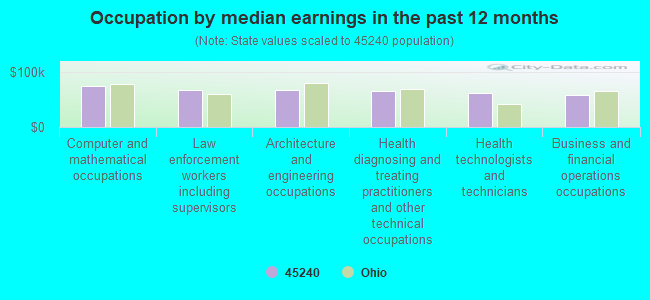
Occupation by median earnings in the past 12 months ($)
74,961Computer and mathematical occupations
68,362Law enforcement workers including supervisors
68,294Architecture and engineering occupations
66,034Health diagnosing and treating practitioners and other technical occupations
62,368Health technologists and technicians
57,906Business and financial operations occupations
Companies with federal contracts located in this zip code (CINCINNATI, OH):
ENVIRONMENTAL QUALITY MANAGEME (1800 CARILLON BOULEVARD; small business) : $492,314,291 in 2159 contractsfrom 1999 to 2006
Contracts for Facilities Operations Support Services, Hazardous Substance Removal, Cleanup, and Disposal Services and Operational Support, Maintenance, Repair or Alteration of Real Property -- Miscellaneous Buildings, Electric Power Generation (EPG), and moreby EPA, Air Force, U.S. Army Corps of Engineers - civil program financing only, Army, and others Signed by year:2000: $26,937,653; 2001: $27,728,958; 2002: $48,476,759; 2003: $79,768,912; 2004: $46,856,485; 2005: $133,492,089; 2006: $122,994,435.
Biggest contracts:
$21,600,000 with EPA for Facilities Operations Support Services. Signed on 2005-12-15. Completion date: 2006-04-30.
$12,500,000, same as above.Signed on 2006-01-30. Completion date: 2006-04-30.
$10,400,000, same as above.Signed on 2006-02-24. Completion date: 2006-04-30.
$10,000,000, same as above.Signed on 2005-10-28. Effective on 2005-10-31. Completion date: 2006-04-30.
SPECTRUM CONTROL SYSTEMS INC (11840A KEMPERSPRINGS DRIVE; small business) : $145,181 in 6 contractsfrom 2001 to 2005
Contracts for Installation of Equipment -- Furnace, Steam Plant, and Drying Equipment; and Nuclear Reactors, Other ADP and Telecommunications Services (includes data storage on tapes, compact disks, etc.) by Air Force Signed by year:2000: $0; 2001: $27,564; 2002: $27,942; 2003: $30,750; 2004: $32,250; 2005: $26,675; 2006: $0.
Biggest contracts:
$34,175 with Air Force for Installation of Equipment -- Furnace, Steam Plant, and Drying Equipment; and Nuclear Reactors. Signed on 2005-11-07. Completion date: 2006-09-30.
$32,250 with Air Force for Other ADP and Telecommunications Services (includes data storage on tapes, compact disks, etc.). Signed on 2004-10-26. Completion date: 2008-09-30.
$30,750, same as above.Signed on 2003-12-18. Completion date: 2008-09-30.
$27,942, same as above.Signed on 2002-11-14. Completion date: 2003-09-30.
REULAND ELECTRIC CO (2060 WAYCROSS RD; small business) : $126,721 in 11 contractsfrom 2002 to 2006
Contracts for Motors, Electrical, Torque Converters and Speed Changers, Miscellaneous Engines and Components, Miscellaneous Vehicular Components, and moreby Navy, Air Force, U.S. Army Corps of Engineers - civil program financing only, Army, and others Signed by year:2000: $0; 2001: $0; 2002: $28,704; 2003: $10,600; 2004: $47,784; 2005: $34,642; 2006: $4,991.
Biggest contracts:
$33,400 with Navy for Motors, Electrical. Taking place in CA. Signed on 2004-07-23. Completion date: 2004-10-29.
$28,704 with Air Force for Motors, Electrical. Signed on 2002-07-25. Completion date: 2002-09-06.
$14,679 with U.S. Army Corps of Engineers - civil program financing only for Motors, Electrical. Taking place in CA. Signed on 2005-07-29. Completion date: 2005-09-09.
$14,679 with Army for Motors, Electrical. Taking place in CA. Signed on 2005-07-29. Completion date: 2005-09-09.
$79,873 with Air Force for Office Furniture. Signed on 2001-01-08. Completion date: 2001-03-08.
MAGNA MACHINE CO INC (11180 SOUTHLAND RD; small business)
$62,590 with Army for Launchers, Rocket and Pyrotechnic. Signed on 2004-07-15. Completion date: 2004-11-27.
D & D OUTFITTERS (536 W SHARON RD; small business) : $62,461 in 3 contractsfrom 2001 to 2006
$47,739 with Army for Small Craft. Taking place in AK. Signed on 2001-09-22. Completion date: 2001-10-01.
$12,028 with Air Force for Recreational and Gymnastic Equipment. Signed on 2005-09-30. Completion date: 2005-11-14.
$2,694 with Air Force for Tents and Tarpaulins. Signed on 2006-05-15. Completion date: 2006-06-15.
SIGMATEK CORPORATION (11820 KEMPER SPRINGS DRIVE; small business) : $40,176 in 8 contractsfrom 2003 to 2006
Contracts for Tuition, Registration, and Membership Fees, ADP Support Equipment, Maintenance, Repair and Rebuilding of Equipment -- Automatic Data Processing Equipment (Including Firmware), Software, Supplies and Support Equipment, ADP Facility Operation and Maintenance Services, and moreby NASA, Army Signed by year:2000: $0; 2001: $0; 2002: $0; 2003: $5,396; 2004: $13,190; 2005: $18,740; 2006: $2,850.
Biggest contracts:
$10,350 with NASA for Tuition, Registration, and Membership Fees. Taking place in CA. Signed on 2004-09-09. Effective on 2004-07-19. Completion date: 2004-07-23.
$8,800 with Army for ADP Support Equipment. Signed on 2005-02-25. Completion date: 2005-11-30.
$5,396 with Army for Maintenance, Repair and Rebuilding of Equipment -- Automatic Data Processing Equipment (Including Firmware), Software, Supplies and Support Equipment. Taking place in WA. Signed on 2003-02-06. Completion date: 2004-11-30.
$3,707 with Army for ADP Facility Operation and Maintenance Services. Taking place in IL. Signed on 2005-12-28. Completion date: 2006-11-30.
CTI PRODUCTS INC (1211 W SHARON RD; small business)
$39,318 with Navy for Miscellaneous Communication Equipment. Taking place in MD. Signed on 2004-02-05. Completion date: 2004-04-05.
OK INTERIORS CORP. (537 ASHBURN ROAD; small business)
$29,650 with Air Force for Carpet Laying and Cleaning. Taking place in VA. Signed on 2000-09-30. Completion date: 2001-01-14.
FAXON MACHINING, INC (11101 ADWOOD DRIVE; small business)
$11,600 with Navy for Maintenance, Repair and Rebuilding of Equipment -- Miscellaneous. Signed on 2006-04-03. Completion date: 2006-05-08.
Top industries in this zip code by the number of employees in 2005:
Finance and Insurance: Direct Life Insurance Carriers (500-999 employees: 2 establishments, 5-9 employees: 1 establishment, 1-4 employees: 4 establishments)
2002 - 2018 National Fire Incident Reporting System (NFIRS) incidents
According to the data from the years 2002 - 2018 the average number of fire incidents per year is 147. The highest number of fires - 242 took place in 2007, and the least - 114 in 2017. The data has a dropping trend.
When looking into fire subcategories, the most incidents belonged to: Structure Fires (70.0%), and Outside Fires (18.3%).
Fire incident types reported to NFIRS in Zip Code 45240

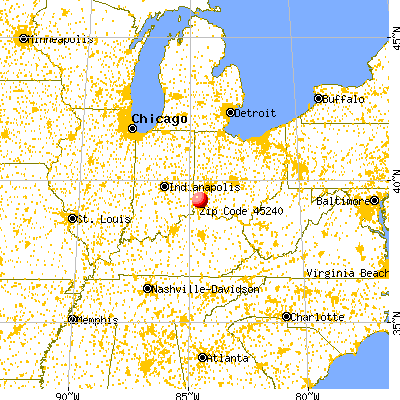


 Nearest zip codes: 45218, 45231, 45014, 45246, 45251, 45215.


 According to the data from the years 2002 - 2018 the average number of fire incidents per year is 147. The highest number of fires - 242 took place in 2007, and the least - 114 in 2017. The data has a dropping trend.
 When looking into fire subcategories, the most incidents belonged to: Structure Fires (70.0%), and Outside Fires (18.3%).