Estimated zip code population in 2022: 20,801 Zip code population in 2010: 22,391 Zip code population in 2000: 24,019
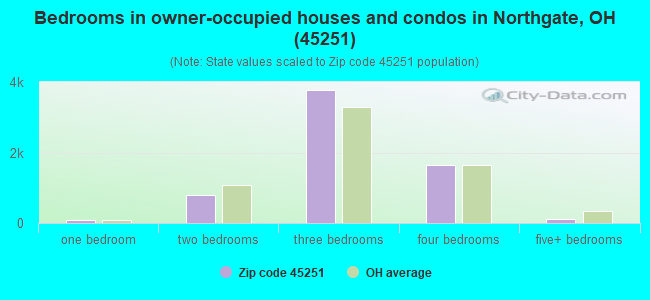
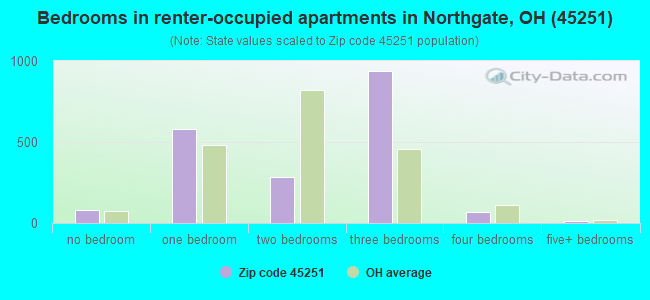
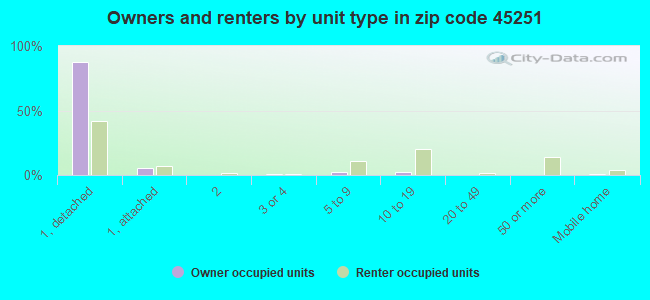
Houses and condos: 8,853 Renter-occupied apartments: 1,975
% of renters here:
23%
State:
33%
March 2022 cost of living index in zip code 45251: 88.3 (less than average, U.S. average is 100)
Land area: 11.9 sq. mi. Water area: 0.0 sq. mi.
Population density: 1,743 people per square mile
(low).
OSM Map
General Map
Google Map
MSN Map
OSM Map
General Map
Google Map
MSN Map
OSM Map
General Map
Google Map
MSN Map
OSM Map
General Map
Google Map
MSN Map
Please wait while loading the map...
Real estate property taxes paid for housing units in 2022:
This zip code:
1.2% ($2,200)
Ohio:
1.3% ($2,639)
Median real estate property taxes paid for housing units with mortgages in 2022: $2,275 (1.2%) Median real estate property taxes paid for housing units with no mortgage in 2022: $2,027 (1.2%)
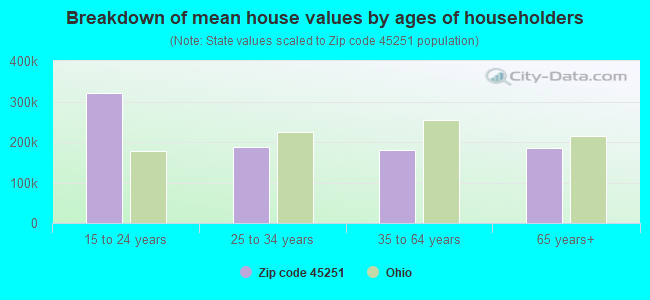
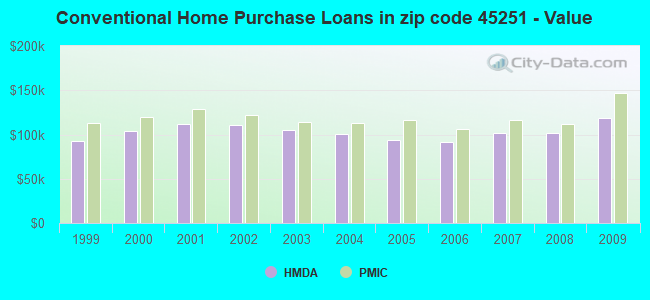
Estimated median house/condo value in 2022: $176,597
45251:
$176,597
Ohio:
$204,100
According to our research of Ohio and other state lists, there were 29 registered sex offenders living in 45251 zip code as of April 27, 2024. The ratio of all residents to sex offenders in zip code 45251 is 796 to 1. The ratio of registered sex offenders to all residents in this zip code is lower than the state average.
Median resident age:
This zip code:
39.7 years
Ohio median age:
39.9 years
Average household size:
This zip code:
2.5 people
Ohio:
2.4 people
Averages for the 2020 tax year for zip code 45251, filed in 2021:
Average Adjusted Gross Income (AGI) in 2020: $50,886 (Individual Income Tax Returns)
Here:
$50,886
State:
$67,288
Salary/wage: $44,835 (reported on 85.0% of returns)
Here:
$44,835
State:
$55,628
(% of AGI for various income ranges: 1175.9% for AGIs below $25k, 3639.5% for AGIs $25k-50k, 6587.9% for AGIs $50k-75k, 9339.2% for AGIs $75k-100k, 16721.2% for AGIs $100k-200k, 56272.0% for AGIs over 200k)
Taxable interest for individuals: $894 (reported on 19.5% of returns)
This zip code:
$894
Ohio:
$1,518
(% of AGI for various income ranges: 7.3% for AGIs below $25k, 10.1% for AGIs $25k-50k, 21.1% for AGIs $50k-75k, 35.6% for AGIs $75k-100k, 104.8% for AGIs $100k-200k, 542.0% for AGIs over 200k)
Ordinary dividends: $4,444 (reported on 15.5% of returns)
Here:
$4,444
State:
$7,167
(% of AGI for various income ranges: 18.7% for AGIs below $25k, 20.2% for AGIs $25k-50k, 71.6% for AGIs $50k-75k, 166.8% for AGIs $75k-100k, 460.6% for AGIs $100k-200k, 3214.0% for AGIs over 200k)
Net capital gain/loss in AGI: +$7,358 (reported on 11.0% of returns)
Here:
+$7,358
State:
+$18,919
(% of AGI for various income ranges: 9.2% for AGIs below $25k, 14.8% for AGIs $25k-50k, 47.5% for AGIs $50k-75k, 165.1% for AGIs $75k-100k, 514.5% for AGIs $100k-200k, 6882.0% for AGIs over 200k)
Profit/loss from business: +$9,768 (reported on 11.7% of returns)
Here:
+$9,768
State:
+$13,744
(% of AGI for various income ranges: 74.7% for AGIs below $25k, 82.8% for AGIs $25k-50k, 125.7% for AGIs $50k-75k, 208.2% for AGIs $75k-100k, 507.2% for AGIs $100k-200k, 3950.0% for AGIs over 200k)
Taxable individual retirement arrangement distribution: $18,985 (reported on 8.8% of returns)
45251:
$18,985
Ohio:
$18,876
(% of AGI for various income ranges: 66.9% for AGIs below $25k, 88.1% for AGIs $25k-50k, 190.1% for AGIs $50k-75k, 303.9% for AGIs $75k-100k, 909.4% for AGIs $100k-200k, 7728.0% for AGIs over 200k)
Total itemized deductions: $25,826 (reported on 3.8% of returns)
Here:
$25,826
State:
$33,869
(% of AGI for various income ranges: 17.2% for AGIs below $25k, 44.6% for AGIs $25k-50k, 123.4% for AGIs $50k-75k, 267.2% for AGIs $75k-100k, 651.2% for AGIs $100k-200k, 3002.0% for AGIs over 200k)
Charity contributions: $9,443 (reported on 3.1% of returns)
Here:
$9,443
State:
$14,577
(% of AGI for various income ranges: 11.5% for AGIs $25k-50k, 22.1% for AGIs $50k-75k, 71.3% for AGIs $75k-100k, 220.6% for AGIs $100k-200k, 1468.0% for AGIs over 200k)
Taxes paid: $6,463 (reported on 3.8% of returns)
45251:
$6,463
State:
$7,681
(% of AGI for various income ranges: 2.0% for AGIs below $25k, 8.5% for AGIs $25k-50k, 31.6% for AGIs $50k-75k, 86.8% for AGIs $75k-100k, 161.9% for AGIs $100k-200k, 744.0% for AGIs over 200k)
Earned income credit: $2,394 (reported on 17.9% of returns)
Here:
$2,394
State:
$2,304
(% of AGI for various income ranges: 102.1% for AGIs below $25k, 69.1% for AGIs $25k-50k, 0.8% for AGIs $50k-75k)
Percentage of individuals using paid preparers for their 2020 taxes: 93.7%
Here:
94%
State:
94%
(% for various income ranges: 93.6% for AGIs below $25k, 95.1% for AGIs $25k-50k, 93.7% for AGIs $50k-75k, 92.0% for AGIs $75k-100k, 92.0% for AGIs $100k-200k, 88.2% for AGIs over 200k)
Averages for the 2012 tax year for zip code 45251, filed in 2013:
Average Adjusted Gross Income (AGI) in 2012: $44,422 (Individual Income Tax Returns)
Here:
$44,422
State:
$54,926
Salary/wage: $40,031 (reported on 87.1% of returns)
Here:
$40,031
State:
$45,869
(% of AGI for various income ranges: 77.8% for AGIs below $25k, 82.4% for AGIs $25k-50k, 81.1% for AGIs $50k-75k, 79.3% for AGIs $75k-100k, 76.9% for AGIs $100k-200k, 55.7% for AGIs over 200k)
Taxable interest for individuals: $667 (reported on 25.1% of returns)
This zip code:
$667
Ohio:
$1,297
(% of AGI for various income ranges: 0.5% for AGIs below $25k, 0.3% for AGIs $25k-50k, 0.4% for AGIs $50k-75k, 0.3% for AGIs $75k-100k, 0.4% for AGIs $100k-200k, 0.3% for AGIs over 200k)
Ordinary dividends: $4,054 (reported on 19.4% of returns)
Here:
$4,054
State:
$5,821
(% of AGI for various income ranges: 1.3% for AGIs below $25k, 1.0% for AGIs $25k-50k, 1.1% for AGIs $50k-75k, 1.6% for AGIs $75k-100k, 2.6% for AGIs $100k-200k, 6.0% for AGIs over 200k)
Net capital gain/loss in AGI: +$4,761 (reported on 10.7% of returns)
Here:
+$4,761
State:
+$11,232
(% of AGI for various income ranges: 0.2% for AGIs $25k-50k, 0.5% for AGIs $50k-75k, 0.4% for AGIs $75k-100k, 1.3% for AGIs $100k-200k, 13.2% for AGIs over 200k)
Profit/loss from business: +$10,085 (reported on 10.8% of returns)
Here:
+$10,085
State:
+$12,773
(% of AGI for various income ranges: 5.8% for AGIs below $25k, 2.0% for AGIs $25k-50k, 1.8% for AGIs $50k-75k, 1.4% for AGIs $75k-100k, 3.2% for AGIs $100k-200k)
Taxable individual retirement arrangement distribution: $14,073 (reported on 10.1% of returns)
45251:
$14,073
Ohio:
$14,511
(% of AGI for various income ranges: 3.4% for AGIs below $25k, 2.3% for AGIs $25k-50k, 2.5% for AGIs $50k-75k, 3.6% for AGIs $75k-100k, 5.1% for AGIs $100k-200k)
Self-employment retirement plans: $11,200 (reported on 0.3% of returns)
45251:
$11,200
Ohio:
$20,257
(% of AGI for various income ranges: 0.4% for AGIs $75k-100k)
Total itemized deductions: $16,169 (20% of AGI, reported on 28.0% of returns)
Here:
$16,169
State:
$21,278
Here:
20.4% of AGI
State:
18.8% of AGI
(% of AGI for various income ranges: 4.6% for AGIs below $25k, 7.7% for AGIs $25k-50k, 10.8% for AGIs $50k-75k, 11.4% for AGIs $75k-100k, 13.4% for AGIs $100k-200k, 12.4% for AGIs over 200k)
Charity contributions: $2,933 (reported on 21.5% of returns)
Here:
$2,933
State:
$3,943
(% of AGI for various income ranges: 0.5% for AGIs below $25k, 0.8% for AGIs $25k-50k, 1.3% for AGIs $50k-75k, 1.6% for AGIs $75k-100k, 2.1% for AGIs $100k-200k, 3.1% for AGIs over 200k)
Taxes paid: $6,111 (reported on 28.0% of returns)
45251:
$6,111
State:
$9,568
(% of AGI for various income ranges: 1.0% for AGIs below $25k, 2.2% for AGIs $25k-50k, 3.7% for AGIs $50k-75k, 4.3% for AGIs $75k-100k, 6.1% for AGIs $100k-200k, 6.5% for AGIs over 200k)
Earned income credit: $2,296 (reported on 18.4% of returns)
Here:
$2,296
State:
$2,285
(% of AGI for various income ranges: 6.5% for AGIs below $25k, 1.1% for AGIs $25k-50k)
Percentage of individuals using paid preparers for their 2012 taxes: 44.1%
Here:
44%
State:
51%
(% for various income ranges: 39.7% for AGIs below $25k, 45.0% for AGIs $25k-50k, 47.1% for AGIs $50k-75k, 48.5% for AGIs $75k-100k, 51.2% for AGIs $100k-200k, 50.0% for AGIs over 200k)
Averages for the 2004 tax year for zip code 45251, filed in 2005:
Average Adjusted Gross Income (AGI) in 2004: $39,015 (Individual Income Tax Returns)
Here:
$39,015
State:
$44,480
Salary/wage: $36,096 (reported on 88.6% of returns)
Here:
$36,096
State:
$39,198
(% of AGI for various income ranges: 94.0% for AGIs below $10k, 78.7% for AGIs $10k-25k, 84.5% for AGIs $25k-50k, 85.4% for AGIs $50k-75k, 83.8% for AGIs $75k-100k, 71.7% for AGIs over 100k)
Taxable interest for individuals: $1,028 (reported on 37.8% of returns)
This zip code:
$1,028
Ohio:
$1,532
(% of AGI for various income ranges: 3.1% for AGIs below $10k, 1.7% for AGIs $10k-25k, 0.9% for AGIs $25k-50k, 0.8% for AGIs $50k-75k, 0.8% for AGIs $75k-100k, 1.1% for AGIs over 100k)
Taxable dividends: $2,536 (reported on 23.1% of returns)
Here:
$2,536
State:
$3,496
(% of AGI for various income ranges: 2.4% for AGIs below $10k, 1.5% for AGIs $10k-25k, 1.1% for AGIs $25k-50k, 1.1% for AGIs $50k-75k, 1.3% for AGIs $75k-100k, 2.9% for AGIs over 100k)
Net capital gain/loss: +$3,591 (reported on 14.3% of returns)
Here:
+$3,591
State:
+$8,582
(% of AGI for various income ranges: -0.5% for AGIs below $10k, 0.3% for AGIs $10k-25k, 0.4% for AGIs $25k-50k, 0.6% for AGIs $50k-75k, 1.0% for AGIs $75k-100k, 4.9% for AGIs over 100k)
Profit/loss from business: +$8,981 (reported on 10.5% of returns)
Here:
+$8,981
State:
+$10,813
(% of AGI for various income ranges: 2.0% for AGIs below $10k, 3.5% for AGIs $10k-25k, 2.0% for AGIs $25k-50k, 2.0% for AGIs $50k-75k, 1.8% for AGIs $75k-100k, 3.9% for AGIs over 100k)
IRA payment deduction: $2,523 (reported on 1.9% of returns)
45251:
$2,523
Ohio:
$2,794
(% of AGI for various income ranges: 0.2% for AGIs $10k-25k, 0.2% for AGIs $25k-50k, 0.1% for AGIs $50k-75k, 0.1% for AGIs $75k-100k, 0.1% for AGIs over 100k)
Self-employed pension: $8,021 (reported on 0.4% of returns)
Here:
$8,021
Ohio:
$13,981
(% of AGI for various income ranges: 0.1% for AGIs $50k-75k, 0.1% for AGIs $75k-100k, 0.3% for AGIs over 100k)
Total itemized deductions: $14,231 (22% of AGI, reported on 37.0% of returns)
Here:
$14,231
State:
$17,503
Here:
22.5% of AGI
State:
20.8% of AGI
(% of AGI for various income ranges: 9.3% for AGIs below $10k, 8.2% for AGIs $10k-25k, 11.8% for AGIs $25k-50k, 14.7% for AGIs $50k-75k, 15.7% for AGIs $75k-100k, 15.9% for AGIs over 100k)
Charity contributions deductions: $2,308 (3% of AGI, reported on 31.0% of returns)
Here:
$2,308
State:
$3,087
Here:
3.5% of AGI
State:
3.4% of AGI
(% of AGI for various income ranges: 0.4% for AGIs below $10k, 0.8% for AGIs $10k-25k, 1.2% for AGIs $25k-50k, 1.7% for AGIs $50k-75k, 2.3% for AGIs $75k-100k, 3.3% for AGIs over 100k)
Total tax: $4,558 (reported on 77.6% of returns)
45251:
$4,558
State:
$6,781
(% of AGI for various income ranges: 2.4% for AGIs below $10k, 4.2% for AGIs $10k-25k, 7.0% for AGIs $25k-50k, 8.8% for AGIs $50k-75k, 10.0% for AGIs $75k-100k, 15.4% for AGIs over 100k)
Earned income credit: $1,757 (reported on 13.1% of returns)
Here:
$1,757
State:
$1,696
Percentage of individuals using paid preparers for their 2004 taxes: 48.5%
Here:
49%
State:
55%
(% for various income ranges: 36.9% for AGIs below $10k, 51.8% for AGIs $10k-25k, 52.4% for AGIs $25k-50k, 50.2% for AGIs $50k-75k, 46.4% for AGIs $75k-100k, 52.1% for AGIs over 100k)
Likely homosexual households (counted as self-reported same-sex unmarried-partner households)
Lesbian couples: 0.1% of all households
Gay men: 0.0% of all households
Household received Food Stamps/SNAP in the past 12 months: 910 Household did not receive Food Stamps/SNAP in the past 12 months: 7,489
Women who had a birth in the past 12 months: 364 (188 now married, 172 unmarried) Women who did not have a birth in the past 12 months: 4,338 (1,764 now married, 2,574 unmarried)
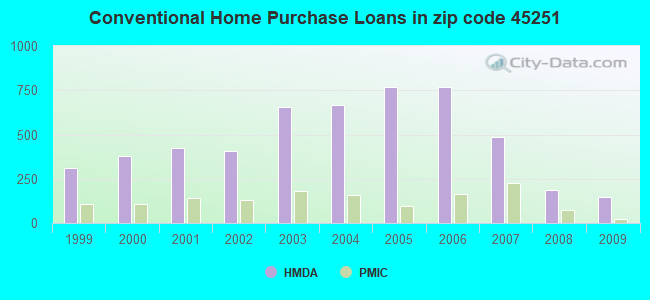
Housing units in zip code 45251 with a mortgage: 4,109 (409 second mortgage, 359 both second mortgage and home equity loan) Houses without a mortgage: 64
Median monthly owner costs for units with a mortgage: $1,263 Median monthly owner costs for units without a mortgage: $548
Residents with income below the poverty level in 2022:
This zip code:
8.6%
Whole state:
13.4%
Residents with income below 50% of the poverty level in 2022:
This zip code:
4.6%
Whole state:
7.0%
Median number of rooms in houses and condos:
Here:
6.5
State:
6.7
Median number of rooms in apartments:
Here:
4.8
State:
4.4
Notable locations in this zip code not listed on our city pages
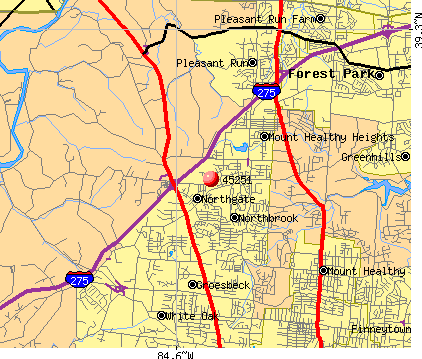
Notable locations in zip code 45251: Hamilton County Experimental Farm (A), Lake Gloria Golf Course (B), Hughes Road Landfill (C), Colerain Township Department of Fire and Emergency Medical Services Station 25 (D), Colerain Township Department of Fire and Emergency Medical Services Station 109 (E). Display/hide their locations on the map
Shopping Centers: Northgate Mall Shopping Center (1), Crossings of Colerain Shopping Center (2), Northgate Square Shopping Center (3), Delco Plaza Shopping Center (4), Spring Hill Shopping Center (5), Central Plaza Shopping Center (6). Display/hide their locations on the map
Churches in zip code 45251 include: Bevis Church (A), Pleasant Run Presbyterian Church (B), Groesbeck United Methodist Church (C), Groesbeck Baptist Church (D), Christ Lutheran Church (E), Charity United Baptist Church (F), Northbrook United Brethren in Christ Church (G), Pleasant Run Baptist Church (H). Display/hide their locations on the map
2,193 married couples with children.
1,505 single-parent households (358 men, 1,147 women).
95.2% of residents of 45251 zip code speak English at home.
1.7% of residents speak Spanish at home (62% very well, 28% not well, 10% not at all).
0.9% of residents speak other Indo-European language at home (47% very well, 35% well, 8% not well, 10% not at all).
1.3% of residents speak Asian or Pacific Island language at home (65% very well, 15% well, 20% not well).
0.6% of residents speak other language at home (43% very well, 12% well, 44% not well).
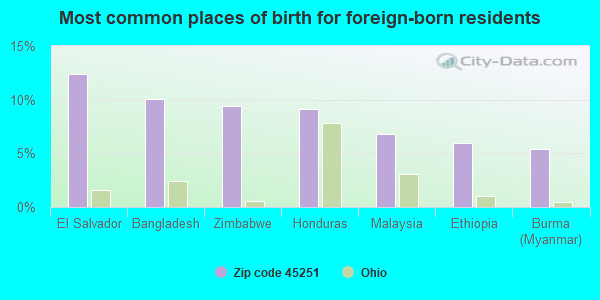
Foreign born population: 724 (3.5%) (49.3% of them are naturalized citizens)
This zip code:
3.5%
Whole state:
5.0%
12%El Salvador
10%Bangladesh
9%Zimbabwe
9%Honduras
7%Malaysia
6%Ethiopia
5%Burma (Myanmar)
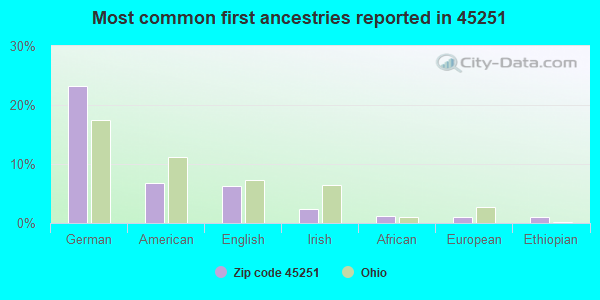
23%German
7%American
6%English
2%Irish
1%African
1%European
1%Ethiopian
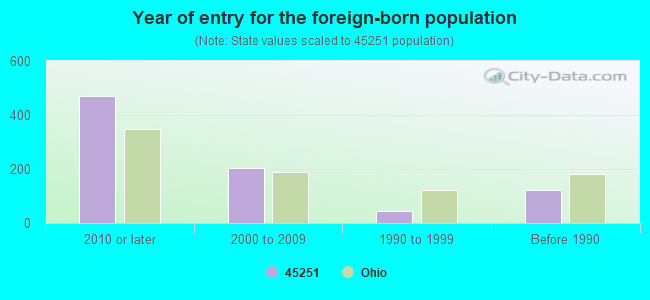
Year of entry for the foreign-born population
4722010 or later
2032000 to 2009
431990 to 1999
123Before 1990
Facilities with environmental interests located in this zip code:
BP OIL CO NO 08786 (9735 COLERAIN AVE in CINCINNATI, OH)
STATE MASTER (Ohio general info) - AIR MAJOR, -31-5541-1038-4, EPCRA, RCRA-OHD987029378, HAZARDOUS WASTE PROGRAM Conditionally Exempt Small Quantity Generators, less than 100 kg/month of hazardous waste (Resource Conservation and Recovery Act (tracking hazardous waste)) - notification Organizations: BP OIL COMPANY (CONTACT/OWNER)
Alternative names: BP OIL CO SITE 08786
BEVIS ELEMENTARY SCHOOL (10133 POTTINGER RD in CINCINNATI, OH)
(Geographic Names Information System) (National Center for Education Statistics) - STATE ID-061754 Organizations: NORTHWEST LOCAL SD (SCHOOL DISTRICT)
Housing units lacking complete plumbing facilities: 1.4% Housing units lacking complete kitchen facilities: 4.4%
56.9%Utility gas
39.2%Electricity
1.2%Bottled, tank, or LP gas
1.2%No fuel used
1.2%Fuel oil, kerosene, etc.
Population in 1990: 22,487. Population change in the 1990s: +1,532 (+6.8%).
Place of birth for U.S.-born residents:
This state: 16,103
Northeast: 441
Midwest: 909
South: 2,206
West: 287
64% of the 45251 zip code residents lived in the same house 5 years ago. Out of people who lived in different houses, 79% lived in this county. Out of people who lived in different counties, 50% lived in Ohio.
93% of the 45251 zip code residents lived in the same house 1 year ago. Out of people who lived in different houses, 60% moved from this county. Out of people who lived in different houses, 22% moved from different county within same state. Out of people who lived in different houses, 18% moved from different state. Out of people who lived in different houses, 3% moved from abroad.
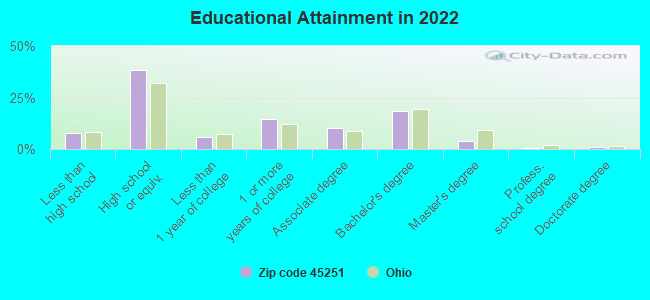
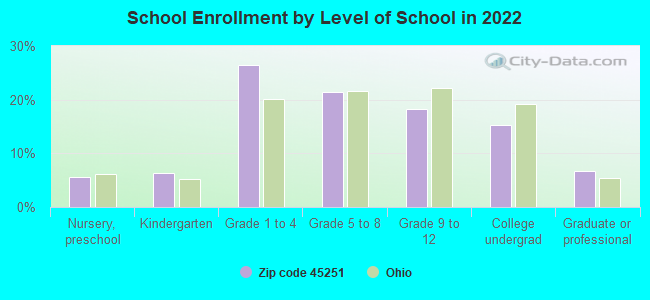
Private vs. public school enrollment:
Students in private schools in grades 1 to 8 (elementary and middle school): 332
Here:
15.0%
Ohio:
16.0%
Students in private schools in grades 9 to 12 (high school): 78
Here:
9.3%
Ohio:
13.1%
Students in private undergraduate colleges: 122
Here:
17.4%
Ohio:
22.3%
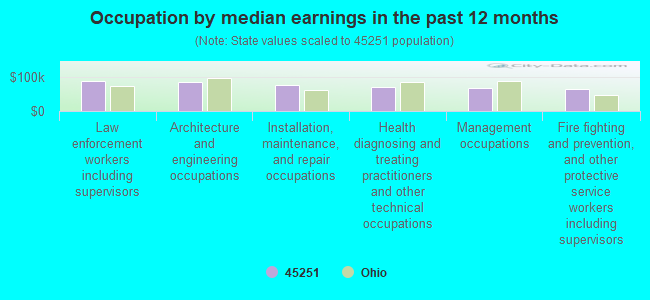
Occupation by median earnings in the past 12 months ($)
87,806Law enforcement workers including supervisors
85,716Architecture and engineering occupations
74,925Installation, maintenance, and repair occupations
68,883Health diagnosing and treating practitioners and other technical occupations
67,689Management occupations
65,288Fire fighting and prevention, and other protective service workers including supervisors
Companies with federal contracts located in this zip code:
RUMPKE OF KENTUCKY INC (10795 HUGHES RD in CINCINNATI, OH) : $431,529 in 13 contractsfrom 1999 to 2006
Contracts for Waste Treatment and Storage, Trash/Garbage Collection Services - Including Portable Sanitation Services by Army Signed by year:2000: $93,240; 2001: $0; 2002: $0; 2003: $214,981; 2004: $27,455; 2005: $4,877; 2006: $325.
Biggest contracts:
$109,082 with Army for Waste Treatment and Storage. Taking place in KY. Signed on 2003-12-29. Completion date: 2005-01-31.
$105,899, same as above.Signed on 2003-01-30. Completion date: 2003-01-31.
$93,240 with Army for Trash/Garbage Collection Services - Including Portable Sanitation Services. Taking place in KY. Signed on 2000-12-18. Completion date: 2004-01-31.
$90,651, same as above.Signed on 1999-12-29. Completion date: 2005-05-31.
RUMPKE OF OHIO, INC (10795 HUGHES ROAD in CINCINNATI, OH) : $164,745 in 44 contractsfrom 2000 to 2006
Contracts for Trash/Garbage Collection Services - Including Portable Sanitation Services by Air Force, Department of Veterans Affairs, Army, U.S. Army Corps of Engineers - civil program financing only, and others Signed by year:2000: $1,668; 2001: $0; 2002: $38,789; 2003: $56,194; 2004: $5,235; 2005: $46,478; 2006: $16,381.
Biggest contracts:
$40,200 with Air Force for Trash/Garbage Collection Services - Including Portable Sanitation Services. Signed on 2005-10-27. Completion date: 2006-09-30.
$38,040, same as above.Signed on 2003-10-27. Completion date: 2007-09-30.
$36,960, same as above.Signed on 2002-10-01. Completion date: 2007-09-30.
$7,189 with Department of Veterans Affairs for Trash/Garbage Collection Services - Including Portable Sanitation Services. Signed on 2006-01-01. Completion date: 2006-03-31.
RUMPKE OF INDIANA, LLC (10795 HUGHES ROAD in CINCINNATI, OH) : $3,070 in 6 contractsin 2003
Contracts for Trash/Garbage Collection Services - Including Portable Sanitation Services by Army Signed by year:2000: $0; 2001: $0; 2002: $0; 2003: $3,070; 2004: $0; 2005: $0; 2006: $0.
Biggest contracts:
$2,152 with Army for Trash/Garbage Collection Services - Including Portable Sanitation Services. Signed on 2003-02-19. Completion date: 2004-03-31.
$780 with Army for Trash/Garbage Collection Services - Including Portable Sanitation Services. Taking place in IN. Signed on 2003-02-25. Completion date: 2004-03-31.
$138, same as above.Signed on 2003-03-04. Completion date: 2003-03-31.
$0, same as above.Signed on 2003-03-04. Completion date: 2003-03-31.
Top industries in this zip code by the number of employees in 2005:
2003 - 2018 National Fire Incident Reporting System (NFIRS) incidents
Based on the data from the years 2003 - 2018 the average number of fires per year is 165. The highest number of reported fires - 297 took place in 2007, and the least - 54 in 2018. The data has a decreasing trend.
When looking into fire subcategories, the most incidents belonged to: Structure Fires (43.8%), and Outside Fires (38.3%).
Fire incident types reported to NFIRS in Zip Code 45251

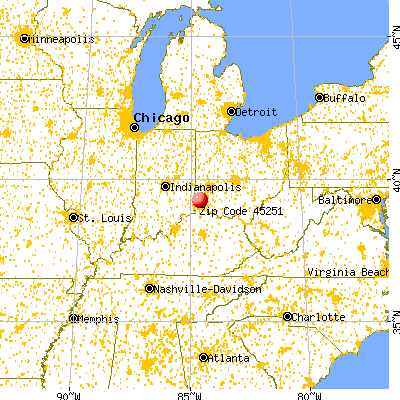


 Nearest zip codes: 45252, 45014, 45231, 45240, 45239, 45218.


 Based on the data from the years 2003 - 2018 the average number of fires per year is 165. The highest number of reported fires - 297 took place in 2007, and the least - 54 in 2018. The data has a decreasing trend.
 When looking into fire subcategories, the most incidents belonged to: Structure Fires (43.8%), and Outside Fires (38.3%).