Estimated zip code population in 2022: 20,881
Zip code population in 2010: 19,837
Zip code population in 2000: 22,962
Houses and condos: 9,741
Renter-occupied apartments: 3,628
% of renters here:
39%State:
33%
March 2022 cost of living index in zip code 45224: 87.6
(less than average, U.S. average is 100)
Land area: 6.4
sq. mi.
Water area: 0.0
sq. mi.
Population density: 3,248 people per square mile (average).
OSM Map
General Map
Google Map
MSN Map
OSM Map
General Map
Google Map
MSN Map
OSM Map
General Map
Google Map
MSN Map
OSM Map
General Map
Google Map
MSN Map
Please wait while loading the map...
Real estate property taxes paid for housing units in 2022:
This zip code:
1.7% ($2,775)Ohio:
1.3% ($2,639)
Median real estate property taxes paid for housing units with mortgages in 2022: $2,903 (1.7%)
Median real estate property taxes paid for housing units with no mortgage in 2022: $2,542 (1.8%)
Profiles of local businesses
Business Search - 14 Million verified businesses
Males: 9,832 Females: 11,048
For population 25 years and over in 45224:
High school or higher: 93.0%Bachelor's degree or higher: 33.7%Graduate or professional degree: 14.0%Unemployed: 5.3%Mean travel time to work (commute): 25.0 minutes
For population 15 years and over in 45224:
Never married: 39.0%Now married: 40.2%Separated: 1.8%Widowed: 7.7%Divorced: 11.3%
Zip code 45224 compared to state average:
Black race population percentage significantly above state average. Hispanic race population percentage significantly below state average. Median age above state average. Foreign-born population percentage below state average. Length of stay since moving in significantly above state average. 10,963 52.5% Black 8,598 41.2% White 894 4.3% Two or more races 271 1.3% Hispanic or Latino 133 0.6% Asian 15 0.07% Native Hawaiian and Other 3 0.01% American Indian
Data:
Median household income ($)
Median household income (% change since 2000)
Household income diversity
Ratio of average income to average house value (%)
Ratio of average income to average rent
Median household income ($) - White
Median household income ($) - Black or African American
Median household income ($) - Asian
Median household income ($) - Hispanic or Latino
Median household income ($) - American Indian and Alaska Native
Median household income ($) - Multirace
Median household income ($) - Other Race
Median household income for houses/condos with a mortgage ($)
Median household income for apartments without a mortgage ($)
Races - White alone (%)
Races - White alone (% change since 2000)
Races - Black alone (%)
Races - Black alone (% change since 2000)
Races - American Indian alone (%)
Races - American Indian alone (% change since 2000)
Races - Asian alone (%)
Races - Asian alone (% change since 2000)
Races - Hispanic (%)
Races - Hispanic (% change since 2000)
Races - Native Hawaiian and Other Pacific Islander alone (%)
Races - Native Hawaiian and Other Pacific Islander alone (% change since 2000)
Races - Two or more races (%)
Races - Two or more races (% change since 2000)
Races - Other race alone (%)
Races - Other race alone (% change since 2000)
Racial diversity
Unemployment (%)
Unemployment (% change since 2000)
Unemployment (%) - White
Unemployment (%) - Black or African American
Unemployment (%) - Asian
Unemployment (%) - Hispanic or Latino
Unemployment (%) - American Indian and Alaska Native
Unemployment (%) - Multirace
Unemployment (%) - Other Race
Population density (people per square mile)
Population - Males (%)
Population - Females (%)
Population - Males (%) - White
Population - Males (%) - Black or African American
Population - Males (%) - Asian
Population - Males (%) - Hispanic or Latino
Population - Males (%) - American Indian and Alaska Native
Population - Males (%) - Multirace
Population - Males (%) - Other Race
Population - Females (%) - White
Population - Females (%) - Black or African American
Population - Females (%) - Asian
Population - Females (%) - Hispanic or Latino
Population - Females (%) - American Indian and Alaska Native
Population - Females (%) - Multirace
Population - Females (%) - Other Race
Coronavirus confirmed cases (Apr 27, 2024)
Deaths caused by coronavirus (Apr 27, 2024)
Coronavirus confirmed cases (per 100k population) (Apr 27, 2024)
Deaths caused by coronavirus (per 100k population) (Apr 27, 2024)
Daily increase in number of cases (Apr 27, 2024)
Weekly increase in number of cases (Apr 27, 2024)
Cases doubled (in days) (Apr 27, 2024)
Hospitalized patients (Apr 18, 2022)
Negative test results (Apr 18, 2022)
Total test results (Apr 18, 2022)
COVID Vaccine doses distributed (per 100k population) (Sep 19, 2023)
COVID Vaccine doses administered (per 100k population) (Sep 19, 2023)
COVID Vaccine doses distributed (Sep 19, 2023)
COVID Vaccine doses administered (Sep 19, 2023)
Likely homosexual households (%)
Likely homosexual households (% change since 2000)
Likely homosexual households - Lesbian couples (%)
Likely homosexual households - Lesbian couples (% change since 2000)
Likely homosexual households - Gay men (%)
Likely homosexual households - Gay men (% change since 2000)
Cost of living index
Median gross rent ($)
Median contract rent ($)
Median monthly housing costs ($)
Median house or condo value ($)
Median house or condo value ($ change since 2000)
Mean house or condo value by units in structure - 1, detached ($)
Mean house or condo value by units in structure - 1, attached ($)
Mean house or condo value by units in structure - 2 ($)
Mean house or condo value by units in structure by units in structure - 3 or 4 ($)
Mean house or condo value by units in structure - 5 or more ($)
Mean house or condo value by units in structure - Boat, RV, van, etc. ($)
Mean house or condo value by units in structure - Mobile home ($)
Median house or condo value ($) - White
Median house or condo value ($) - Black or African American
Median house or condo value ($) - Asian
Median house or condo value ($) - Hispanic or Latino
Median house or condo value ($) - American Indian and Alaska Native
Median house or condo value ($) - Multirace
Median house or condo value ($) - Other Race
Median resident age
Resident age diversity
Median resident age - Males
Median resident age - Females
Median resident age - White
Median resident age - Black or African American
Median resident age - Asian
Median resident age - Hispanic or Latino
Median resident age - American Indian and Alaska Native
Median resident age - Multirace
Median resident age - Other Race
Median resident age - Males - White
Median resident age - Males - Black or African American
Median resident age - Males - Asian
Median resident age - Males - Hispanic or Latino
Median resident age - Males - American Indian and Alaska Native
Median resident age - Males - Multirace
Median resident age - Males - Other Race
Median resident age - Females - White
Median resident age - Females - Black or African American
Median resident age - Females - Asian
Median resident age - Females - Hispanic or Latino
Median resident age - Females - American Indian and Alaska Native
Median resident age - Females - Multirace
Median resident age - Females - Other Race
Commute - mean travel time to work (minutes)
Travel time to work - Less than 5 minutes (%)
Travel time to work - Less than 5 minutes (% change since 2000)
Travel time to work - 5 to 9 minutes (%)
Travel time to work - 5 to 9 minutes (% change since 2000)
Travel time to work - 10 to 19 minutes (%)
Travel time to work - 10 to 19 minutes (% change since 2000)
Travel time to work - 20 to 29 minutes (%)
Travel time to work - 20 to 29 minutes (% change since 2000)
Travel time to work - 30 to 39 minutes (%)
Travel time to work - 30 to 39 minutes (% change since 2000)
Travel time to work - 40 to 59 minutes (%)
Travel time to work - 40 to 59 minutes (% change since 2000)
Travel time to work - 60 to 89 minutes (%)
Travel time to work - 60 to 89 minutes (% change since 2000)
Travel time to work - 90 or more minutes (%)
Travel time to work - 90 or more minutes (% change since 2000)
Marital status - Never married (%)
Marital status - Now married (%)
Marital status - Separated (%)
Marital status - Widowed (%)
Marital status - Divorced (%)
Median family income ($)
Median family income (% change since 2000)
Median non-family income ($)
Median non-family income (% change since 2000)
Median per capita income ($)
Median per capita income (% change since 2000)
Median family income ($) - White
Median family income ($) - Black or African American
Median family income ($) - Asian
Median family income ($) - Hispanic or Latino
Median family income ($) - American Indian and Alaska Native
Median family income ($) - Multirace
Median family income ($) - Other Race
Median year house/condo built
Median year apartment built
Year house built - Built 2005 or later (%)
Year house built - Built 2000 to 2004 (%)
Year house built - Built 1990 to 1999 (%)
Year house built - Built 1980 to 1989 (%)
Year house built - Built 1970 to 1979 (%)
Year house built - Built 1960 to 1969 (%)
Year house built - Built 1950 to 1959 (%)
Year house built - Built 1940 to 1949 (%)
Year house built - Built 1939 or earlier (%)
Average household size
Household density (households per square mile)
Average household size - White
Average household size - Black or African American
Average household size - Asian
Average household size - Hispanic or Latino
Average household size - American Indian and Alaska Native
Average household size - Multirace
Average household size - Other Race
Occupied housing units (%)
Vacant housing units (%)
Owner occupied housing units (%)
Renter occupied housing units (%)
Vacancy status - For rent (%)
Vacancy status - For sale only (%)
Vacancy status - Rented or sold, not occupied (%)
Vacancy status - For seasonal, recreational, or occasional use (%)
Vacancy status - For migrant workers (%)
Vacancy status - Other vacant (%)
Residents with income below the poverty level (%)
Residents with income below 50% of the poverty level (%)
Children below poverty level (%)
Poor families by family type - Married-couple family (%)
Poor families by family type - Male, no wife present (%)
Poor families by family type - Female, no husband present (%)
Poverty status for native-born residents (%)
Poverty status for foreign-born residents (%)
Poverty among high school graduates not in families (%)
Poverty among people who did not graduate high school not in families (%)
Residents with income below the poverty level (%) - White
Residents with income below the poverty level (%) - Black or African American
Residents with income below the poverty level (%) - Asian
Residents with income below the poverty level (%) - Hispanic or Latino
Residents with income below the poverty level (%) - American Indian and Alaska Native
Residents with income below the poverty level (%) - Multirace
Residents with income below the poverty level (%) - Other Race
Air pollution - Air Quality Index (AQI)
Air pollution - CO
Air pollution - NO2
Air pollution - SO2
Air pollution - Ozone
Air pollution - PM10
Air pollution - PM25
Air pollution - Pb
Crime - Murders per 100,000 population
Crime - Rapes per 100,000 population
Crime - Robberies per 100,000 population
Crime - Assaults per 100,000 population
Crime - Burglaries per 100,000 population
Crime - Thefts per 100,000 population
Crime - Auto thefts per 100,000 population
Crime - Arson per 100,000 population
Crime - City-data.com crime index
Crime - Violent crime index
Crime - Property crime index
Crime - Murders per 100,000 population (5 year average)
Crime - Rapes per 100,000 population (5 year average)
Crime - Robberies per 100,000 population (5 year average)
Crime - Assaults per 100,000 population (5 year average)
Crime - Burglaries per 100,000 population (5 year average)
Crime - Thefts per 100,000 population (5 year average)
Crime - Auto thefts per 100,000 population (5 year average)
Crime - Arson per 100,000 population (5 year average)
Crime - City-data.com crime index (5 year average)
Crime - Violent crime index (5 year average)
Crime - Property crime index (5 year average)
1996 Presidential Elections Results (%) - Democratic Party (Clinton)
1996 Presidential Elections Results (%) - Republican Party (Dole)
1996 Presidential Elections Results (%) - Other
2000 Presidential Elections Results (%) - Democratic Party (Gore)
2000 Presidential Elections Results (%) - Republican Party (Bush)
2000 Presidential Elections Results (%) - Other
2004 Presidential Elections Results (%) - Democratic Party (Kerry)
2004 Presidential Elections Results (%) - Republican Party (Bush)
2004 Presidential Elections Results (%) - Other
2008 Presidential Elections Results (%) - Democratic Party (Obama)
2008 Presidential Elections Results (%) - Republican Party (McCain)
2008 Presidential Elections Results (%) - Other
2012 Presidential Elections Results (%) - Democratic Party (Obama)
2012 Presidential Elections Results (%) - Republican Party (Romney)
2012 Presidential Elections Results (%) - Other
2016 Presidential Elections Results (%) - Democratic Party (Clinton)
2016 Presidential Elections Results (%) - Republican Party (Trump)
2016 Presidential Elections Results (%) - Other
2020 Presidential Elections Results (%) - Democratic Party (Biden)
2020 Presidential Elections Results (%) - Republican Party (Trump)
2020 Presidential Elections Results (%) - Other
Ancestries Reported - Arab (%)
Ancestries Reported - Czech (%)
Ancestries Reported - Danish (%)
Ancestries Reported - Dutch (%)
Ancestries Reported - English (%)
Ancestries Reported - French (%)
Ancestries Reported - French Canadian (%)
Ancestries Reported - German (%)
Ancestries Reported - Greek (%)
Ancestries Reported - Hungarian (%)
Ancestries Reported - Irish (%)
Ancestries Reported - Italian (%)
Ancestries Reported - Lithuanian (%)
Ancestries Reported - Norwegian (%)
Ancestries Reported - Polish (%)
Ancestries Reported - Portuguese (%)
Ancestries Reported - Russian (%)
Ancestries Reported - Scotch-Irish (%)
Ancestries Reported - Scottish (%)
Ancestries Reported - Slovak (%)
Ancestries Reported - Subsaharan African (%)
Ancestries Reported - Swedish (%)
Ancestries Reported - Swiss (%)
Ancestries Reported - Ukrainian (%)
Ancestries Reported - United States (%)
Ancestries Reported - Welsh (%)
Ancestries Reported - West Indian (%)
Ancestries Reported - Other (%)
Educational Attainment - No schooling completed (%)
Educational Attainment - Less than high school (%)
Educational Attainment - High school or equivalent (%)
Educational Attainment - Less than 1 year of college (%)
Educational Attainment - 1 or more years of college (%)
Educational Attainment - Associate degree (%)
Educational Attainment - Bachelor's degree (%)
Educational Attainment - Master's degree (%)
Educational Attainment - Professional school degree (%)
Educational Attainment - Doctorate degree (%)
School Enrollment - Nursery, preschool (%)
School Enrollment - Kindergarten (%)
School Enrollment - Grade 1 to 4 (%)
School Enrollment - Grade 5 to 8 (%)
School Enrollment - Grade 9 to 12 (%)
School Enrollment - College undergrad (%)
School Enrollment - Graduate or professional (%)
School Enrollment - Not enrolled in school (%)
School enrollment - Public schools (%)
School enrollment - Private schools (%)
School enrollment - Not enrolled (%)
Median number of rooms in houses and condos
Median number of rooms in apartments
Housing units lacking complete plumbing facilities (%)
Housing units lacking complete kitchen facilities (%)
Density of houses
Urban houses (%)
Rural houses (%)
Households with people 60 years and over (%)
Households with people 65 years and over (%)
Households with people 75 years and over (%)
Households with one or more nonrelatives (%)
Households with no nonrelatives (%)
Population in households (%)
Family households (%)
Nonfamily households (%)
Population in families (%)
Family households with own children (%)
Median number of bedrooms in owner occupied houses
Mean number of bedrooms in owner occupied houses
Median number of bedrooms in renter occupied houses
Mean number of bedrooms in renter occupied houses
Median number of vehichles in owner occupied houses
Mean number of vehichles in owner occupied houses
Median number of vehichles in renter occupied houses
Mean number of vehichles in renter occupied houses
Mortgage status - with mortgage (%)
Mortgage status - with second mortgage (%)
Mortgage status - with home equity loan (%)
Mortgage status - with both second mortgage and home equity loan (%)
Mortgage status - without a mortgage (%)
Average family size
Average family size - White
Average family size - Black or African American
Average family size - Asian
Average family size - Hispanic or Latino
Average family size - American Indian and Alaska Native
Average family size - Multirace
Average family size - Other Race
Geographical mobility - Same house 1 year ago (%)
Geographical mobility - Moved within same county (%)
Geographical mobility - Moved from different county within same state (%)
Geographical mobility - Moved from different state (%)
Geographical mobility - Moved from abroad (%)
Place of birth - Born in state of residence (%)
Place of birth - Born in other state (%)
Place of birth - Native, outside of US (%)
Place of birth - Foreign born (%)
Housing units in structures - 1, detached (%)
Housing units in structures - 1, attached (%)
Housing units in structures - 2 (%)
Housing units in structures - 3 or 4 (%)
Housing units in structures - 5 to 9 (%)
Housing units in structures - 10 to 19 (%)
Housing units in structures - 20 to 49 (%)
Housing units in structures - 50 or more (%)
Housing units in structures - Mobile home (%)
Housing units in structures - Boat, RV, van, etc. (%)
House/condo owner moved in on average (years ago)
Renter moved in on average (years ago)
Year householder moved into unit - Moved in 1999 to March 2000 (%)
Year householder moved into unit - Moved in 1995 to 1998 (%)
Year householder moved into unit - Moved in 1990 to 1994 (%)
Year householder moved into unit - Moved in 1980 to 1989 (%)
Year householder moved into unit - Moved in 1970 to 1979 (%)
Year householder moved into unit - Moved in 1969 or earlier (%)
Means of transportation to work - Drove car alone (%)
Means of transportation to work - Carpooled (%)
Means of transportation to work - Public transportation (%)
Means of transportation to work - Bus or trolley bus (%)
Means of transportation to work - Streetcar or trolley car (%)
Means of transportation to work - Subway or elevated (%)
Means of transportation to work - Railroad (%)
Means of transportation to work - Ferryboat (%)
Means of transportation to work - Taxicab (%)
Means of transportation to work - Motorcycle (%)
Means of transportation to work - Bicycle (%)
Means of transportation to work - Walked (%)
Means of transportation to work - Other means (%)
Working at home (%)
Industry diversity
Most Common Industries - Agriculture, forestry, fishing and hunting, and mining (%)
Most Common Industries - Agriculture, forestry, fishing and hunting (%)
Most Common Industries - Mining, quarrying, and oil and gas extraction (%)
Most Common Industries - Construction (%)
Most Common Industries - Manufacturing (%)
Most Common Industries - Wholesale trade (%)
Most Common Industries - Retail trade (%)
Most Common Industries - Transportation and warehousing, and utilities (%)
Most Common Industries - Transportation and warehousing (%)
Most Common Industries - Utilities (%)
Most Common Industries - Information (%)
Most Common Industries - Finance and insurance, and real estate and rental and leasing (%)
Most Common Industries - Finance and insurance (%)
Most Common Industries - Real estate and rental and leasing (%)
Most Common Industries - Professional, scientific, and management, and administrative and waste management services (%)
Most Common Industries - Professional, scientific, and technical services (%)
Most Common Industries - Management of companies and enterprises (%)
Most Common Industries - Administrative and support and waste management services (%)
Most Common Industries - Educational services, and health care and social assistance (%)
Most Common Industries - Educational services (%)
Most Common Industries - Health care and social assistance (%)
Most Common Industries - Arts, entertainment, and recreation, and accommodation and food services (%)
Most Common Industries - Arts, entertainment, and recreation (%)
Most Common Industries - Accommodation and food services (%)
Most Common Industries - Other services, except public administration (%)
Most Common Industries - Public administration (%)
Occupation diversity
Most Common Occupations - Management, business, science, and arts occupations (%)
Most Common Occupations - Management, business, and financial occupations (%)
Most Common Occupations - Management occupations (%)
Most Common Occupations - Business and financial operations occupations (%)
Most Common Occupations - Computer, engineering, and science occupations (%)
Most Common Occupations - Computer and mathematical occupations (%)
Most Common Occupations - Architecture and engineering occupations (%)
Most Common Occupations - Life, physical, and social science occupations (%)
Most Common Occupations - Education, legal, community service, arts, and media occupations (%)
Most Common Occupations - Community and social service occupations (%)
Most Common Occupations - Legal occupations (%)
Most Common Occupations - Education, training, and library occupations (%)
Most Common Occupations - Arts, design, entertainment, sports, and media occupations (%)
Most Common Occupations - Healthcare practitioners and technical occupations (%)
Most Common Occupations - Health diagnosing and treating practitioners and other technical occupations (%)
Most Common Occupations - Health technologists and technicians (%)
Most Common Occupations - Service occupations (%)
Most Common Occupations - Healthcare support occupations (%)
Most Common Occupations - Protective service occupations (%)
Most Common Occupations - Fire fighting and prevention, and other protective service workers including supervisors (%)
Most Common Occupations - Law enforcement workers including supervisors (%)
Most Common Occupations - Food preparation and serving related occupations (%)
Most Common Occupations - Building and grounds cleaning and maintenance occupations (%)
Most Common Occupations - Personal care and service occupations (%)
Most Common Occupations - Sales and office occupations (%)
Most Common Occupations - Sales and related occupations (%)
Most Common Occupations - Office and administrative support occupations (%)
Most Common Occupations - Natural resources, construction, and maintenance occupations (%)
Most Common Occupations - Farming, fishing, and forestry occupations (%)
Most Common Occupations - Construction and extraction occupations (%)
Most Common Occupations - Installation, maintenance, and repair occupations (%)
Most Common Occupations - Production, transportation, and material moving occupations (%)
Most Common Occupations - Production occupations (%)
Most Common Occupations - Transportation occupations (%)
Most Common Occupations - Material moving occupations (%)
People in Group quarters - Institutionalized population (%)
People in Group quarters - Correctional institutions (%)
People in Group quarters - Federal prisons and detention centers (%)
People in Group quarters - Halfway houses (%)
People in Group quarters - Local jails and other confinement facilities (including police lockups) (%)
People in Group quarters - Military disciplinary barracks (%)
People in Group quarters - State prisons (%)
People in Group quarters - Other types of correctional institutions (%)
People in Group quarters - Nursing homes (%)
People in Group quarters - Hospitals/wards, hospices, and schools for the handicapped (%)
People in Group quarters - Hospitals/wards and hospices for chronically ill (%)
People in Group quarters - Hospices or homes for chronically ill (%)
People in Group quarters - Military hospitals or wards for chronically ill (%)
People in Group quarters - Other hospitals or wards for chronically ill (%)
People in Group quarters - Hospitals or wards for drug/alcohol abuse (%)
People in Group quarters - Mental (Psychiatric) hospitals or wards (%)
People in Group quarters - Schools, hospitals, or wards for the mentally retarded (%)
People in Group quarters - Schools, hospitals, or wards for the physically handicapped (%)
People in Group quarters - Institutions for the deaf (%)
People in Group quarters - Institutions for the blind (%)
People in Group quarters - Orthopedic wards and institutions for the physically handicapped (%)
People in Group quarters - Wards in general hospitals for patients who have no usual home elsewhere (%)
People in Group quarters - Wards in military hospitals for patients who have no usual home elsewhere (%)
People in Group quarters - Juvenile institutions (%)
People in Group quarters - Long-term care (%)
People in Group quarters - Homes for abused, dependent, and neglected children (%)
People in Group quarters - Residential treatment centers for emotionally disturbed children (%)
People in Group quarters - Training schools for juvenile delinquents (%)
People in Group quarters - Short-term care, detention or diagnostic centers for delinquent children (%)
People in Group quarters - Type of juvenile institution unknown (%)
People in Group quarters - Noninstitutionalized population (%)
People in Group quarters - College dormitories (includes college quarters off campus) (%)
People in Group quarters - Military quarters (%)
People in Group quarters - On base (%)
People in Group quarters - Barracks, unaccompanied personnel housing (UPH), (Enlisted/Officer), ;and similar group living quarters for military personnel (%)
People in Group quarters - Transient quarters for temporary residents (%)
People in Group quarters - Military ships (%)
People in Group quarters - Group homes (%)
People in Group quarters - Homes or halfway houses for drug/alcohol abuse (%)
People in Group quarters - Homes for the mentally ill (%)
People in Group quarters - Homes for the mentally retarded (%)
People in Group quarters - Homes for the physically handicapped (%)
People in Group quarters - Other group homes (%)
People in Group quarters - Religious group quarters (%)
People in Group quarters - Dormitories (%)
People in Group quarters - Agriculture workers' dormitories on farms (%)
People in Group quarters - Job Corps and vocational training facilities (%)
People in Group quarters - Other workers' dormitories (%)
People in Group quarters - Crews of maritime vessels (%)
People in Group quarters - Other nonhousehold living situations (%)
People in Group quarters - Other noninstitutional group quarters (%)
Residents speaking English at home (%)
Residents speaking English at home - Born in the United States (%)
Residents speaking English at home - Native, born elsewhere (%)
Residents speaking English at home - Foreign born (%)
Residents speaking Spanish at home (%)
Residents speaking Spanish at home - Born in the United States (%)
Residents speaking Spanish at home - Native, born elsewhere (%)
Residents speaking Spanish at home - Foreign born (%)
Residents speaking other language at home (%)
Residents speaking other language at home - Born in the United States (%)
Residents speaking other language at home - Native, born elsewhere (%)
Residents speaking other language at home - Foreign born (%)
Class of Workers - Employee of private company (%)
Class of Workers - Self-employed in own incorporated business (%)
Class of Workers - Private not-for-profit wage and salary workers (%)
Class of Workers - Local government workers (%)
Class of Workers - State government workers (%)
Class of Workers - Federal government workers (%)
Class of Workers - Self-employed workers in own not incorporated business and Unpaid family workers (%)
House heating fuel used in houses and condos - Utility gas (%)
House heating fuel used in houses and condos - Bottled, tank, or LP gas (%)
House heating fuel used in houses and condos - Electricity (%)
House heating fuel used in houses and condos - Fuel oil, kerosene, etc. (%)
House heating fuel used in houses and condos - Coal or coke (%)
House heating fuel used in houses and condos - Wood (%)
House heating fuel used in houses and condos - Solar energy (%)
House heating fuel used in houses and condos - Other fuel (%)
House heating fuel used in houses and condos - No fuel used (%)
House heating fuel used in apartments - Utility gas (%)
House heating fuel used in apartments - Bottled, tank, or LP gas (%)
House heating fuel used in apartments - Electricity (%)
House heating fuel used in apartments - Fuel oil, kerosene, etc. (%)
House heating fuel used in apartments - Coal or coke (%)
House heating fuel used in apartments - Wood (%)
House heating fuel used in apartments - Solar energy (%)
House heating fuel used in apartments - Other fuel (%)
House heating fuel used in apartments - No fuel used (%)
Armed forces status - In Armed Forces (%)
Armed forces status - Civilian (%)
Armed forces status - Civilian - Veteran (%)
Armed forces status - Civilian - Nonveteran (%)
Fatal accidents locations in years 2005-2021
Fatal accidents locations in 2005
Fatal accidents locations in 2006
Fatal accidents locations in 2007
Fatal accidents locations in 2008
Fatal accidents locations in 2009
Fatal accidents locations in 2010
Fatal accidents locations in 2011
Fatal accidents locations in 2012
Fatal accidents locations in 2013
Fatal accidents locations in 2014
Fatal accidents locations in 2015
Fatal accidents locations in 2016
Fatal accidents locations in 2017
Fatal accidents locations in 2018
Fatal accidents locations in 2019
Fatal accidents locations in 2020
Fatal accidents locations in 2021
Alcohol use - People drinking some alcohol every month (%)
Alcohol use - People not drinking at all (%)
Alcohol use - Average days/month drinking alcohol
Alcohol use - Average drinks/week
Alcohol use - Average days/year people drink much
Audiometry - Average condition of hearing (%)
Audiometry - People that can hear a whisper from across a quiet room (%)
Audiometry - People that can hear normal voice from across a quiet room (%)
Audiometry - Ears ringing, roaring, buzzing (%)
Audiometry - Had a job exposure to loud noise (%)
Audiometry - Had off-work exposure to loud noise (%)
Blood Pressure & Cholesterol - Has high blood pressure (%)
Blood Pressure & Cholesterol - Checking blood pressure at home (%)
Blood Pressure & Cholesterol - Frequently checking blood cholesterol (%)
Blood Pressure & Cholesterol - Has high cholesterol level (%)
Consumer Behavior - Money monthly spent on food at supermarket/grocery store
Consumer Behavior - Money monthly spent on food at other stores
Consumer Behavior - Money monthly spent on eating out
Consumer Behavior - Money monthly spent on carryout/delivered foods
Consumer Behavior - Income spent on food at supermarket/grocery store (%)
Consumer Behavior - Income spent on food at other stores (%)
Consumer Behavior - Income spent on eating out (%)
Consumer Behavior - Income spent on carryout/delivered foods (%)
Current Health Status - General health condition (%)
Current Health Status - Blood donors (%)
Current Health Status - Has blood ever tested for HIV virus (%)
Current Health Status - Left-handed people (%)
Dermatology - People using sunscreen (%)
Diabetes - Diabetics (%)
Diabetes - Had a blood test for high blood sugar (%)
Diabetes - People taking insulin (%)
Diet Behavior & Nutrition - Diet health (%)
Diet Behavior & Nutrition - Milk product consumption (# of products/month)
Diet Behavior & Nutrition - Meals not home prepared (#/week)
Diet Behavior & Nutrition - Meals from fast food or pizza place (#/week)
Diet Behavior & Nutrition - Ready-to-eat foods (#/month)
Diet Behavior & Nutrition - Frozen meals/pizza (#/month)
Drug Use - People that ever used marijuana or hashish (%)
Drug Use - Ever used hard drugs (%)
Drug Use - Ever used any form of cocaine (%)
Drug Use - Ever used heroin (%)
Drug Use - Ever used methamphetamine (%)
Health Insurance - People covered by health insurance (%)
Kidney Conditions-Urology - Avg. # of times urinating at night
Medical Conditions - People with asthma (%)
Medical Conditions - People with anemia (%)
Medical Conditions - People with psoriasis (%)
Medical Conditions - People with overweight (%)
Medical Conditions - Elderly people having difficulties in thinking or remembering (%)
Medical Conditions - People who ever received blood transfusion (%)
Medical Conditions - People having trouble seeing even with glass/contacts (%)
Medical Conditions - People with arthritis (%)
Medical Conditions - People with gout (%)
Medical Conditions - People with congestive heart failure (%)
Medical Conditions - People with coronary heart disease (%)
Medical Conditions - People with angina pectoris (%)
Medical Conditions - People who ever had heart attack (%)
Medical Conditions - People who ever had stroke (%)
Medical Conditions - People with emphysema (%)
Medical Conditions - People with thyroid problem (%)
Medical Conditions - People with chronic bronchitis (%)
Medical Conditions - People with any liver condition (%)
Medical Conditions - People who ever had cancer or malignancy (%)
Mental Health - People who have little interest in doing things (%)
Mental Health - People feeling down, depressed, or hopeless (%)
Mental Health - People who have trouble sleeping or sleeping too much (%)
Mental Health - People feeling tired or having little energy (%)
Mental Health - People with poor appetite or overeating (%)
Mental Health - People feeling bad about themself (%)
Mental Health - People who have trouble concentrating on things (%)
Mental Health - People moving or speaking slowly or too fast (%)
Mental Health - People having thoughts they would be better off dead (%)
Oral Health - Average years since last visit a dentist
Oral Health - People embarrassed because of mouth (%)
Oral Health - People with gum disease (%)
Oral Health - General health of teeth and gums (%)
Oral Health - Average days a week using dental floss/device
Oral Health - Average days a week using mouthwash for dental problem
Oral Health - Average number of teeth
Pesticide Use - Households using pesticides to control insects (%)
Pesticide Use - Households using pesticides to kill weeds (%)
Physical Activity - People doing vigorous-intensity work activities (%)
Physical Activity - People doing moderate-intensity work activities (%)
Physical Activity - People walking or bicycling (%)
Physical Activity - People doing vigorous-intensity recreational activities (%)
Physical Activity - People doing moderate-intensity recreational activities (%)
Physical Activity - Average hours a day doing sedentary activities
Physical Activity - Average hours a day watching TV or videos
Physical Activity - Average hours a day using computer
Physical Functioning - People having limitations keeping them from working (%)
Physical Functioning - People limited in amount of work they can do (%)
Physical Functioning - People that need special equipment to walk (%)
Physical Functioning - People experiencing confusion/memory problems (%)
Physical Functioning - People requiring special healthcare equipment (%)
Prescription Medications - Average number of prescription medicines taking
Preventive Aspirin Use - Adults 40+ taking low-dose aspirin (%)
Reproductive Health - Vaginal deliveries (%)
Reproductive Health - Cesarean deliveries (%)
Reproductive Health - Deliveries resulted in a live birth (%)
Reproductive Health - Pregnancies resulted in a delivery (%)
Reproductive Health - Women breastfeeding newborns (%)
Reproductive Health - Women that had a hysterectomy (%)
Reproductive Health - Women that had both ovaries removed (%)
Reproductive Health - Women that have ever taken birth control pills (%)
Reproductive Health - Women taking birth control pills (%)
Reproductive Health - Women that have ever used Depo-Provera or injectables (%)
Reproductive Health - Women that have ever used female hormones (%)
Sexual Behavior - People 18+ that ever had sex (vaginal, anal, or oral) (%)
Sexual Behavior - Males 18+ that ever had vaginal sex with a woman (%)
Sexual Behavior - Males 18+ that ever performed oral sex on a woman (%)
Sexual Behavior - Males 18+ that ever had anal sex with a woman (%)
Sexual Behavior - Males 18+ that ever had any sex with a man (%)
Sexual Behavior - Females 18+ that ever had vaginal sex with a man (%)
Sexual Behavior - Females 18+ that ever performed oral sex on a man (%)
Sexual Behavior - Females 18+ that ever had anal sex with a man (%)
Sexual Behavior - Females 18+ that ever had any kind of sex with a woman (%)
Sexual Behavior - Average age people first had sex
Sexual Behavior - Average number of female sex partners in lifetime (males 18+)
Sexual Behavior - Average number of female vaginal sex partners in lifetime (males 18+)
Sexual Behavior - Average age people first performed oral sex on a woman (18+)
Sexual Behavior - Average number of woman performed oral sex on in lifetime (18+)
Sexual Behavior - Average number of male sex partners in lifetime (males 18+)
Sexual Behavior - Average number of male anal sex partners in lifetime (males 18+)
Sexual Behavior - Average age people first performed oral sex on a man (18+)
Sexual Behavior - Average number of male oral sex partners in lifetime (18+)
Sexual Behavior - People using protection when performing oral sex (%)
Sexual Behavior - Average number of times people have vaginal or anal sex a year
Sexual Behavior - People having sex without condom (%)
Sexual Behavior - Average number of male sex partners in lifetime (females 18+)
Sexual Behavior - Average number of male vaginal sex partners in lifetime (females 18+)
Sexual Behavior - Average number of female sex partners in lifetime (females 18+)
Sexual Behavior - Circumcised males 18+ (%)
Sleep Disorders - Average hours sleeping at night
Sleep Disorders - People that has trouble sleeping (%)
Smoking-Cigarette Use - People smoking cigarettes (%)
Taste & Smell - People 40+ having problems with smell (%)
Taste & Smell - People 40+ having problems with taste (%)
Taste & Smell - People 40+ that ever had wisdom teeth removed (%)
Taste & Smell - People 40+ that ever had tonsils teeth removed (%)
Taste & Smell - People 40+ that ever had a loss of consciousness because of a head injury (%)
Taste & Smell - People 40+ that ever had a broken nose or other serious injury to face or skull (%)
Taste & Smell - People 40+ that ever had two or more sinus infections (%)
Weight - Average height (inches)
Weight - Average weight (pounds)
Weight - Average BMI
Weight - People that are obese (%)
Weight - People that ever were obese (%)
Weight - People trying to lose weight (%)
100%
urban population.
Estimated median house/condo value in 2022: $162,790
45224:
$162,790Ohio:
$204,100
According to our research of Ohio and other state lists, there were 24 registered sex offenders living in 45224 zip code as of April 27, 2024 . The ratio of all residents to sex offenders in zip code 45224 is 840 to 1.The ratio of registered sex offenders to all residents in this zip code is lower than the state average.
Median resident age: This zip code:
47.0 yearsOhio median age:
39.9 years
Average household size: This zip code:
2.2 peopleOhio:
2.4 people
Averages for the 2020 tax year for zip code 45224, filed in 2021:
Average Adjusted Gross Income (AGI) in 2020: $52,265 (Individual Income Tax Returns) Here:
$52,265State:
$67,288
Salary/wage: $43,597 (reported on 80.4% of returns )Here:
$43,597State:
$55,628
(% of AGI for various income ranges: 1134.8% for AGIs below $25k , 3662.0% for AGIs $25k-50k , 6335.8% for AGIs $50k-75k , 9419.3% for AGIs $75k-100k , 17348.8% for AGIs $100k-200k , 52798.6% for AGIs over 200k ) Taxable interest for individuals: $1,054 (reported on 21.9% of returns )This zip code:
$1,054Ohio:
$1,518
(% of AGI for various income ranges: 9.0% for AGIs below $25k , 8.2% for AGIs $25k-50k , 30.1% for AGIs $50k-75k , 64.3% for AGIs $75k-100k , 130.0% for AGIs $100k-200k , 894.3% for AGIs over 200k ) Ordinary dividends: $9,637 (reported on 18.2% of returns )(% of AGI for various income ranges: 21.7% for AGIs below $25k , 46.9% for AGIs $25k-50k , 147.1% for AGIs $50k-75k , 388.1% for AGIs $75k-100k , 1063.5% for AGIs $100k-200k , 10661.4% for AGIs over 200k ) Net capital gain/loss in AGI: +$10,217 (reported on 13.6% of returns )Here:
+$10,217State:
+$18,919
(% of AGI for various income ranges: 10.8% for AGIs below $25k , 29.7% for AGIs $25k-50k , 99.4% for AGIs $50k-75k , 248.3% for AGIs $75k-100k , 900.2% for AGIs $100k-200k , 9138.6% for AGIs over 200k ) Profit/loss from business: +$9,263 (reported on 14.3% of returns )Here:
+$9,263State:
+$13,744
(% of AGI for various income ranges: 82.9% for AGIs below $25k , 72.1% for AGIs $25k-50k , 126.7% for AGIs $50k-75k , 426.3% for AGIs $75k-100k , 718.1% for AGIs $100k-200k , 3585.7% for AGIs over 200k ) Taxable individual retirement arrangement distribution: $21,811 (reported on 9.7% of returns )45224:
$21,811Ohio:
$18,876
(% of AGI for various income ranges: 46.5% for AGIs below $25k , 87.4% for AGIs $25k-50k , 265.6% for AGIs $50k-75k , 589.6% for AGIs $75k-100k , 1457.3% for AGIs $100k-200k , 7477.1% for AGIs over 200k ) Self-employed (Keogh) retirement plans: $15,100 (reported on 0.3% of returns )45224:
$15,100Ohio:
$24,898
(% of AGI for various income ranges: 87.1% for AGIs $100k-200k ) Total itemized deductions: $35,366 (reported on 5.8% of returns )Here:
$35,366State:
$33,869
(% of AGI for various income ranges: 29.9% for AGIs below $25k , 74.3% for AGIs $25k-50k , 298.1% for AGIs $50k-75k , 480.9% for AGIs $75k-100k , 1149.4% for AGIs $100k-200k , 10237.1% for AGIs over 200k ) Charity contributions: $18,992 (reported on 4.6% of returns )Here:
$18,992State:
$14,577
(% of AGI for various income ranges: 14.9% for AGIs $25k-50k , 47.9% for AGIs $50k-75k , 128.5% for AGIs $75k-100k , 403.7% for AGIs $100k-200k , 7770.0% for AGIs over 200k ) Taxes paid: $6,452 (reported on 5.8% of returns )(% of AGI for various income ranges: 2.6% for AGIs below $25k , 12.6% for AGIs $25k-50k , 57.1% for AGIs $50k-75k , 135.4% for AGIs $75k-100k , 281.5% for AGIs $100k-200k , 1065.7% for AGIs over 200k ) Earned income credit: $2,301 (reported on 20.0% of returns )(% of AGI for various income ranges: 112.6% for AGIs below $25k , 73.3% for AGIs $25k-50k ) Percentage of individuals using paid preparers for their 2020 taxes: 91.6%(% for various income ranges: 92.0% for AGIs below $25k , 92.9% for AGIs $25k-50k , 90.0% for AGIs $50k-75k , 89.9% for AGIs $75k-100k , 90.5% for AGIs $100k-200k , 90.0% for AGIs over 200k )
Averages for the 2012 tax year for zip code 45224, filed in 2013:
Average Adjusted Gross Income (AGI) in 2012: $45,578 (Individual Income Tax Returns) Here:
$45,578State:
$54,926
Salary/wage: $38,162 (reported on 81.1% of returns )Here:
$38,162State:
$45,869
(% of AGI for various income ranges: 73.9% for AGIs below $25k , 76.1% for AGIs $25k-50k , 71.9% for AGIs $50k-75k , 65.1% for AGIs $75k-100k , 64.8% for AGIs $100k-200k , 50.5% for AGIs over 200k ) Taxable interest for individuals: $1,208 (reported on 26.6% of returns )This zip code:
$1,208Ohio:
$1,297
(% of AGI for various income ranges: 0.7% for AGIs below $25k , 0.5% for AGIs $25k-50k , 0.5% for AGIs $50k-75k , 1.0% for AGIs $75k-100k , 0.8% for AGIs $100k-200k , 0.9% for AGIs over 200k ) Ordinary dividends: $8,568 (reported on 22.1% of returns )(% of AGI for various income ranges: 1.8% for AGIs below $25k , 1.7% for AGIs $25k-50k , 2.5% for AGIs $50k-75k , 3.3% for AGIs $75k-100k , 5.7% for AGIs $100k-200k , 11.6% for AGIs over 200k ) Net capital gain/loss in AGI: +$6,195 (reported on 14.5% of returns )Here:
+$6,195State:
+$11,232
(% of AGI for various income ranges: 0.1% for AGIs below $25k , 0.4% for AGIs $25k-50k , 0.6% for AGIs $50k-75k , 1.1% for AGIs $75k-100k , 3.3% for AGIs $100k-200k , 7.1% for AGIs over 200k ) Profit/loss from business: +$9,629 (reported on 13.1% of returns )Here:
+$9,629State:
+$12,773
(% of AGI for various income ranges: 8.0% for AGIs below $25k , 1.7% for AGIs $25k-50k , 1.7% for AGIs $50k-75k , 2.6% for AGIs $75k-100k , 1.8% for AGIs $100k-200k , 3.2% for AGIs over 200k ) Taxable individual retirement arrangement distribution: $17,105 (reported on 12.3% of returns )45224:
$17,105Ohio:
$14,511
(% of AGI for various income ranges: 3.2% for AGIs below $25k , 2.7% for AGIs $25k-50k , 3.5% for AGIs $50k-75k , 5.0% for AGIs $75k-100k , 6.5% for AGIs $100k-200k , 7.3% for AGIs over 200k ) Self-employment retirement plans: $9,950 (reported on 0.4% of returns )(% of AGI for various income ranges: 0.4% for AGIs $100k-200k ) Total itemized deductions: $18,594 (22% of AGI, reported on 31.1% of returns )Here:
$18,594State:
$21,278
Here:
22.2% of AGIState:
18.8% of AGI
(% of AGI for various income ranges: 8.7% for AGIs below $25k , 9.8% for AGIs $25k-50k , 12.7% for AGIs $50k-75k , 14.0% for AGIs $75k-100k , 14.3% for AGIs $100k-200k , 16.7% for AGIs over 200k ) Charity contributions: $4,509 (reported on 25.7% of returns )(% of AGI for various income ranges: 0.9% for AGIs below $25k , 1.5% for AGIs $25k-50k , 2.0% for AGIs $50k-75k , 3.0% for AGIs $75k-100k , 3.3% for AGIs $100k-200k , 5.0% for AGIs over 200k ) Taxes paid: $6,916 (reported on 30.9% of returns )(% of AGI for various income ranges: 1.4% for AGIs below $25k , 3.1% for AGIs $25k-50k , 4.6% for AGIs $50k-75k , 5.2% for AGIs $75k-100k , 6.3% for AGIs $100k-200k , 7.1% for AGIs over 200k ) Earned income credit: $2,476 (reported on 22.5% of returns )(% of AGI for various income ranges: 8.8% for AGIs below $25k , 1.0% for AGIs $25k-50k ) Percentage of individuals using paid preparers for their 2012 taxes: 43.6%(% for various income ranges: 41.0% for AGIs below $25k , 41.1% for AGIs $25k-50k , 47.6% for AGIs $50k-75k , 48.7% for AGIs $75k-100k , 49.3% for AGIs $100k-200k , 62.5% for AGIs over 200k )
Averages for the 2004 tax year for zip code 45224, filed in 2005:
Average Adjusted Gross Income (AGI) in 2004: $40,879 (Individual Income Tax Returns) Here:
$40,879State:
$44,480
Salary/wage: $34,504 (reported on 82.2% of returns )Here:
$34,504State:
$39,198
(% of AGI for various income ranges: 90.5% for AGIs below $10k , 75.3% for AGIs $10k-25k , 79.1% for AGIs $25k-50k , 73.6% for AGIs $50k-75k , 74.6% for AGIs $75k-100k , 50.7% for AGIs over 100k ) Taxable interest for individuals: $1,654 (reported on 38.8% of returns )This zip code:
$1,654Ohio:
$1,532
(% of AGI for various income ranges: 3.6% for AGIs below $10k , 2.0% for AGIs $10k-25k , 1.2% for AGIs $25k-50k , 1.8% for AGIs $50k-75k , 1.3% for AGIs $75k-100k , 1.5% for AGIs over 100k ) Taxable dividends: $6,551 (reported on 28.5% of returns )(% of AGI for various income ranges: 6.6% for AGIs below $10k , 2.5% for AGIs $10k-25k , 2.1% for AGIs $25k-50k , 3.6% for AGIs $50k-75k , 4.4% for AGIs $75k-100k , 8.3% for AGIs over 100k ) Net capital gain/loss: +$8,106 (reported on 19.6% of returns )Here:
+$8,106State:
+$8,582
(% of AGI for various income ranges: -1.7% for AGIs below $10k , 0.3% for AGIs $10k-25k , 0.5% for AGIs $25k-50k , 1.2% for AGIs $50k-75k , 2.2% for AGIs $75k-100k , 11.8% for AGIs over 100k ) Profit/loss from business: +$7,025 (reported on 11.4% of returns )Here:
+$7,025State:
+$10,813
(% of AGI for various income ranges: 3.4% for AGIs below $10k , 2.8% for AGIs $10k-25k , 1.7% for AGIs $25k-50k , 1.6% for AGIs $50k-75k , 2.3% for AGIs $75k-100k , 1.8% for AGIs over 100k ) IRA payment deduction: $2,434 (reported on 1.9% of returns )(% of AGI for various income ranges: 0.2% for AGIs $10k-25k , 0.1% for AGIs $25k-50k , 0.1% for AGIs $50k-75k , 0.1% for AGIs $75k-100k , 0.1% for AGIs over 100k ) Self-employed pension: $7,370 (reported on 0.5% of returns )(% of AGI for various income ranges: 0.1% for AGIs $50k-75k , 0.1% for AGIs $75k-100k , 0.2% for AGIs over 100k ) Total itemized deductions: $16,437 (23% of AGI, reported on 37.9% of returns )Here:
$16,437State:
$17,503
Here:
23.1% of AGIState:
20.8% of AGI
(% of AGI for various income ranges: 9.4% for AGIs below $10k , 8.6% for AGIs $10k-25k , 14.1% for AGIs $25k-50k , 17.7% for AGIs $50k-75k , 17.6% for AGIs $75k-100k , 16.3% for AGIs over 100k ) Charity contributions deductions: $4,165 (6% of AGI, reported on 33.4% of returns )Here:
5.6% of AGIState:
3.4% of AGI
(% of AGI for various income ranges: 0.6% for AGIs below $10k , 1.3% for AGIs $10k-25k , 2.3% for AGIs $25k-50k , 3.2% for AGIs $50k-75k , 4.0% for AGIs $75k-100k , 5.3% for AGIs over 100k ) Total tax: $5,584 (reported on 73.7% of returns )(% of AGI for various income ranges: 1.9% for AGIs below $10k , 3.6% for AGIs $10k-25k , 7.1% for AGIs $25k-50k , 9.4% for AGIs $50k-75k , 10.5% for AGIs $75k-100k , 16.2% for AGIs over 100k ) Earned income credit: $1,802 (reported on 18.2% of returns )Percentage of individuals using paid preparers for their 2004 taxes: 52.7%(% for various income ranges: 44.2% for AGIs below $10k , 58.3% for AGIs $10k-25k , 52.7% for AGIs $25k-50k , 55.4% for AGIs $50k-75k , 50.7% for AGIs $75k-100k , 53.1% for AGIs over 100k )
Estimated median household income in 2022: This zip code:
$53,714Ohio:
$65,720
Nearest zip codes: 45232 ,
45223 ,
45231 ,
45217 ,
45239 ,
45216 .
North College Hill Zip Code Map
Percentage of family households: This zip code:
35.7%Ohio:
43.3%
Percentage of households with unmarried partners: This zip code:
3.9%Ohio:
44.6%
Likely homosexual households (counted as self-reported same-sex unmarried-partner households)
Lesbian couples: 0.3% of all households Gay men: 0.0% of all households
Household received Food Stamps/SNAP in the past 12 months: 1,187Household did not receive Food Stamps/SNAP in the past 12 months: 8,183
Women who had a birth in the past 12 months: 344 (171 now married , 169 unmarried) Women who did not have a birth in the past 12 months: 4,055 (1,143 now married , 2,914 unmarried)
Housing units in zip code 45224 with a mortgage: 3,910 (337
second mortgage , 17
home equity loan , 230
both second mortgage and home equity loan )
Houses without a mortgage: 94
Median monthly owner costs for units with a mortgage: $1,377
Median monthly owner costs for units without a mortgage: $560
Residents with income below the poverty level in 2022:
This zip code:
19.2%Whole state:
13.4%
Residents with income below 50% of the poverty level in 2022:
This zip code:
10.1%Whole state:
7.0%
Median number of rooms in houses and condos: Median number of rooms in apartments: Notable locations in this zip code not listed on our city pages
Click to draw/clear zip code borders Notable locations in zip code 45224: (A) , Center Hill Landfill (B) , Methodist Home for the Aged (C) , Laurel Court (D) , Springfield Township Fire Department Station 81 (E) , Cincinnati Fire Department Engine and Truck 51 (F) , Number 51 Engine House (G) , Northern Hills Branch Public Library of Cincinnati and Hamilton County (H) , College Hill Town Hall (I) . Display/hide their locations on the map
Churches in zip code 45224 include: (A) , Cornerstone Baptist Church (B) , College Hill Christian Church (C) , Grace Episcopal Church (D) , Parkview Heights Church (E) , Saint Vivians Catholic Church (F) , Northern Hills Bible Chapel (G) , Holy Trinity-Saint Nicholas Greek Orthodox Church (H) , Central Baptist Church (I) . Display/hide their locations on the map
Reservoir: (A) . Display/hide its location on the map
Parks in zip code 45224 include: (1) , Warder Park (2) , McEvory Park (3) , La Boiteaux Woods (4) , Fox Preserve (5) . Display/hide their locations on the map
Year house built (houses)
0 2020 or later390 2010 to 201954 2000 to 2009440 1990 to 1999485 1980 to 19891,026 1970 to 19791,834 1960 to 19692,436 1950 to 1959989 1940 to 19491,939 1939 or earlier
Zip code 45224 household income distribution in 2022 989 Less than $10,000618 $10,000 to $14,999425 $15,000 to $19,999358 $20,000 to $24,999314 $25,000 to $29,999311 $30,000 to $34,999662 $35,000 to $39,999443 $40,000 to $44,999290 $45,000 to $49,999864 $50,000 to $59,9991,025 $60,000 to $74,9991,235 $75,000 to $99,999768 $100,000 to $124,999313 $125,000 to $149,999407 $150,000 to $199,999417 $200,000 or moreEstimate of home value of owner-occupied houses/condos in 2022 in zip code 45224 17 Less than $10,00096 $10,000 to $14,99947 $15,000 to $19,99933 $20,000 to $24,9992 $25,000 to $29,99923 $30,000 to $34,99938 $40,000 to $49,99952 $50,000 to $59,999104 $60,000 to $69,999131 $70,000 to $79,999165 $80,000 to $89,999244 $90,000 to $99,999764 $100,000 to $124,999842 $125,000 to $149,999452 $150,000 to $174,999414 $175,000 to $199,999958 $200,000 to $249,999357 $250,000 to $299,999393 $300,000 to $399,999110 $400,000 to $499,99952 $500,000 to $749,99934 $750,000 to $999,999Rent paid by renters in 2022 in zip code 45224 47 Less than $100134 $200 to $24963 $250 to $29967 $300 to $3494 $350 to $399132 $400 to $449129 $450 to $499181 $500 to $549330 $550 to $599240 $600 to $649372 $650 to $699271 $700 to $749183 $750 to $799444 $800 to $899199 $900 to $999246 $1,000 to $1,249158 $1,250 to $1,4995 $1,500 to $1,99946 $2,000 to $2,49915 $2,500 to $2,99993 $3,000 to $3,49953 $3,500 or more159 No cash rent
Median gross rent in 2022: $839.
Median price asked for vacant for-sale houses and condos in 2022: $213,442.
Estimated median house (or condo) value in 2022 for: White Non-Hispanic householders: $184,016Black or African American householders: $144,739American Indian or Alaska Native householders: $271,595Asian householders: $168,138Some other race householders: $134,878Two or more races householders: $148,416Hispanic or Latino householders: $109,975Estimated median house or condo value in 2022: $162,790
45224:
$162,790Ohio:
$204,100
Lower value quartile - upper value quartile: $118,063 - $245,110
Mean price in 2022: Detached houses: $325,857Here:
$325,857State:
$254,366
Townhouses or other attached units: $430,385Here:
$430,385State:
$225,733
In 2-unit structures: $135,112Here:
$135,112State:
$144,384
In 3-to-4-unit structures: $220,187Here:
$220,187State:
$203,002
In 5-or-more-unit structures: $266,262Here:
$266,262State:
$211,593
Housing units in structures:
One, detached: 6,486One, attached: 365Two: 2483 or 4: 6365 to 9: 23010 to 19: 59120 to 49: 35950 or more: 857Unemployment : 5.3%
Means of transportation to work in zip code 45224 70.5% 6,908 Drove a car alone10.1% 987 Carpooled3.5% 339 Bus or trolley bus0.1% 12 Taxi0.2% 21 Motorcycle0.1% 5 Bicycle2.3% 222 Walked0.4% 39 Other means12.5% 1,225 Worked at homeTravel time to work (commute) in zip code 45224 191 Less than 5 minutes437 5 to 9 minutes691 10 to 14 minutes1,293 15 to 19 minutes2,204 20 to 24 minutes954 25 to 29 minutes1,331 30 to 34 minutes334 35 to 39 minutes381 40 to 44 minutes285 45 to 59 minutes332 60 to 89 minutes125 90 or more minutes
Neighborhoods in zip code 45224: Percentage of zip code residents living and working in this county: 87.0%
Household type by relationship:
Households: 20,881
Male householders: 3,523 (1,582 living alone ), Female householders: 5,865 (2,350 living alone )3,079 spouses (2,954 opposite-sex spouses ), 520 unmarried partners , (484 opposite-sex unmarried partners ), 5,522 children (5,288 natural , 132 adopted , 108 stepchildren ), 597 grandchildren , 217 brothers or sisters , 216 parents , 78 foster children , 272 other relatives , 458 non-relatives In group quarters: 550 (-1 institutionalized population )
Size of family households: 2,424 2-persons , 1,279 3-persons , 691 4-persons , 271 5-persons , 293 6-persons , 3 7-or-more-persons
Size of nonfamily households: 3,935 1-person , 444 2-persons , 13 3-persons , 30 7-or-more-persons
1,598 married couples with children. single-parent households (155 men , 1,563 women ).
96.8% of residents of 45224 zip code speak English at home. of residents speak Spanish at home (92% very well, 8% well ).of residents speak other Indo-European language at home (93% very well, 7% not well ).of residents speak Asian or Pacific Island language at home (100% very well ).of residents speak other language at home (61% very well, 32% well, 8% not at all ).
Foreign born population: 610 (2.9%)
(69.0%
of them are naturalized citizens )
This zip code:
2.9%Whole state:
5.0%
11% Bhutan 11% Liberia 9% Haiti 8% United Kingdom, excluding England and Scotland 7% Sweden 7% Moldova 5% Poland 10% German 3% English 3% African 3% American 2% European 1% Italian 1% Scottish
Year of entry for the foreign-born population
155 2010 or later 56 2000 to 2009 155 1990 to 1999 242 Before 1990
There are
80 Medical Specialists in Zip Code 45224 .
Facilities with environmental interests located in this zip code:
BP OIL NO 09095 (6464 WINTON RD in CINCINNATI, OH)
STATE MASTER (Ohio general info) - AIR MAJOR STATE MASTER (Ohio general info) - -315541-1038-DD, EPCRA, RCRA-OHD987027414, HAZARDOUS WASTE PROGRAM Conditionally Exempt Small Quantity Generators, less than 100 kg/month of hazardous waste (Resource Conservation and Recovery Act (tracking hazardous waste)) - notification Organizations: BP OIL CO (CONTACT/OWNER)
, BP OIL COMPANY (CONTACT/OWNER)
Alternative names: BP OIL CO SITE 09095, BP OIL SITE NO 09095
BP OIL NO 09011 (6899 HAMILTON AVE in CINCINNATI, OH)
STATE MASTER (Ohio general info) - AIR MAJOR, -31-5541-1038-S, EPCRA, RCRA-OHD987027968, HAZARDOUS WASTE PROGRAM Conditionally Exempt Small Quantity Generators, less than 100 kg/month of hazardous waste (Resource Conservation and Recovery Act (tracking hazardous waste)) - notification Organizations: BP OIL CO (CONTACT/OWNER)
, BP OIL COMPANY (CONTACT/OWNER)
Alternative names: BP OIL CO SITE 09011
BP OIL CO SITE 09001 (5757 HAMILTON AVE in CINCINNATI, OH)
(Resource Conservation and Recovery Act (tracking hazardous waste)) Organizations: BP OIL COMPANY (CONTACT/OWNER)
CENTRAL BAPTIST SCH (7645 WINTON RD in CINCINNATI, OH)
COMPLIANCE ACTIVITY (Tracking inspections of insecticide, fungicide, and rodenticide, and toxic substances)
Housing units lacking complete plumbing facilities: 0.5%
Housing units lacking complete kitchen facilities: 1.4%
64.9% Utility gas 29.5% Electricity 2.7% Bottled, tank, or LP gas 1.0% No fuel used 0.8% Other fuel 0.7% Fuel oil, kerosene, etc.
Population in 1990: 23,394.
Place of birth for U.S.-born residents:
This state: 15,513Northeast: 585Midwest: 1,224South: 2,592West: 276
62% of the 45224 zip code residents lived in the same house 5 years ago.
Out of people who lived in different houses, 84% lived in this county.
Out of people who lived in different counties, 50% lived in Ohio.
88% of the 45224 zip code residents lived in the same house 1 year ago.
Out of people who lived in different houses, 64% moved from this county.
Out of people who lived in different houses, 1% moved from different county within same state.
Out of people who lived in different houses, 29% moved from different state.
Out of people who lived in different houses, 2% moved from abroad.
Private vs. public school enrollment:
Students in private schools in grades 1 to 8 (elementary and middle school): 176
Students in private schools in grades 9 to 12 (high school): 250
Students in private undergraduate colleges: 74
Occupation by median earnings in the past 12 months ($)
75,492 Computer and mathematical occupations 66,910 Management occupations 66,244 Health diagnosing and treating practitioners and other technical occupations 63,883 Architecture and engineering occupations 62,568 Personal care and service occupations 61,629 Business and financial operations occupations
Top industries in this zip code by the number of employees in 2005:
Professional, Scientific, and Technical Services: Research and Development in the Physical, Engineering, and Life Sciences (over 1000 employees: 1 establishment)Health Care and Social Assistance: Continuing Care Retirement Communities (250-499: 2)Educational Services: Elementary and Secondary Schools (250-499: 1, 100-249: 1, 50-99: 1, 20-49: 1)Other Services (except Public Administration): Religious Organizations (50-99: 3, 20-49: 1, 10-19: 2, 5-9: 4, 1-4: 6)Health Care and Social Assistance: Nursing Care Facilities (100-249: 1, 50-99: 1)Administrative and Support and Waste Management and Remediation Services: Janitorial Services (100-249: 1, 10-19: 1, 1-4: 4)Accommodation and Food Services: Limited-Service Restaurants (50-99: 1, 20-49: 2, 10-19: 3, 1-4: 1)Health Care and Social Assistance: Home Health Care Services (50-99: 1, 10-19: 1)Accommodation and Food Services: Full-Service Restaurants (20-49: 2, 5-9: 1, 1-4: 1)
People in group quarters in 2010:
357 people in nursing facilities/skilled-nursing facilities
40 people in group homes intended for adults
38 people in other noninstitutional facilities
24 people in mental (psychiatric) hospitals and psychiatric units in other hospitals
13 people in emergency and transitional shelters (with sleeping facilities) for people experiencing homelessness
5 people in group homes for juveniles (non-correctional)
2 people in workers' group living quarters and job corps centers
People in group quarters in 2000:
688 people in nursing homes
51 people in religious group quarters
13 people in homes for the mentally retarded
6 people in other noninstitutional group quarters
4 people in other nonhousehold living situations
Fatal accident statistics in 2014:
Fatal accident count: 3Vehicles involved in fatal accidents: 4Fatal accidents caused by drunken drivers: 0Fatalities: 4Persons involved in fatal accidents: 9Pedestrians involved in fatal accidents: 1
Fatal accident statistics in 2013:
Fatal accident count: 1Vehicles involved in fatal accidents: 1Fatal accidents caused by drunken drivers: 0Fatalities: 1Persons involved in fatal accidents: 1Pedestrians involved in fatal accidents: 1
Home Mortgage Disclosure Act Aggregated Statistics For Year 2009(Based on 7 full and 10 partial tracts) A) FHA, FSA/RHS & VA B) Conventional C) Refinancings D) Home Improvement Loans E) Loans on Dwellings For 5+ Families F) Non-occupant Loans on Number Average Value Number Average Value Number Average Value Number Average Value Number Average Value Number Average Value
LOANS ORIGINATED 189 $94,419 101 $92,175 498 $108,611 35 $29,400 2 $698,075 44 $57,835 APPLICATIONS APPROVED, NOT ACCEPTED 10 $92,764 3 $114,960 42 $101,708 9 $30,123 0 $0 4 $65,858 APPLICATIONS DENIED 43 $88,513 20 $76,736 321 $111,018 81 $23,688 0 $0 24 $77,119 APPLICATIONS WITHDRAWN 12 $102,835 6 $138,627 125 $116,438 6 $28,252 0 $0 10 $112,834 FILES CLOSED FOR INCOMPLETENESS 7 $89,499 1 $238,780 34 $111,781 5 $51,150 0 $0 4 $125,015
Aggregated Statistics For Year 2008(Based on 7 full and 10 partial tracts) A) FHA, FSA/RHS & VA B) Conventional C) Refinancings D) Home Improvement Loans E) Loans on Dwellings For 5+ Families F) Non-occupant Loans on Number Average Value Number Average Value Number Average Value Number Average Value Number Average Value Number Average Value
LOANS ORIGINATED 149 $99,993 156 $87,084 293 $103,274 73 $23,431 3 $652,500 88 $71,543 APPLICATIONS APPROVED, NOT ACCEPTED 11 $92,373 16 $123,559 57 $105,408 20 $26,793 0 $0 11 $59,475 APPLICATIONS DENIED 39 $108,181 31 $73,664 358 $108,830 111 $35,302 1 $174,200 51 $70,157 APPLICATIONS WITHDRAWN 14 $93,809 17 $93,221 132 $114,464 3 $313,757 0 $0 13 $86,748 FILES CLOSED FOR INCOMPLETENESS 1 $204,000 2 $184,105 40 $116,727 8 $47,734 0 $0 5 $73,074
Aggregated Statistics For Year 2007(Based on 7 full and 10 partial tracts) A) FHA, FSA/RHS & VA B) Conventional C) Refinancings D) Home Improvement Loans E) Loans on Dwellings For 5+ Families F) Non-occupant Loans on G) Loans On Manufactured Number Average Value Number Average Value Number Average Value Number Average Value Number Average Value Number Average Value Number Average Value
LOANS ORIGINATED 61 $102,916 391 $102,056 490 $100,075 114 $29,079 4 $888,718 135 $76,212 2 $69,925 APPLICATIONS APPROVED, NOT ACCEPTED 4 $79,895 39 $98,521 142 $107,175 30 $25,170 0 $0 20 $89,784 2 $23,335 APPLICATIONS DENIED 25 $100,804 117 $81,801 658 $108,187 131 $31,531 1 $350,000 110 $87,254 0 $0 APPLICATIONS WITHDRAWN 12 $79,667 37 $94,854 206 $109,977 13 $73,956 0 $0 18 $76,887 0 $0 FILES CLOSED FOR INCOMPLETENESS 1 $128,000 11 $107,524 82 $110,540 2 $108,880 1 $568,000 11 $97,471 0 $0
Aggregated Statistics For Year 2006(Based on 7 full and 10 partial tracts) A) FHA, FSA/RHS & VA B) Conventional C) Refinancings D) Home Improvement Loans E) Loans on Dwellings For 5+ Families F) Non-occupant Loans on G) Loans On Manufactured Number Average Value Number Average Value Number Average Value Number Average Value Number Average Value Number Average Value Number Average Value
LOANS ORIGINATED 55 $108,307 624 $94,382 713 $92,202 161 $27,068 5 $940,150 176 $74,300 3 $71,400 APPLICATIONS APPROVED, NOT ACCEPTED 6 $130,518 119 $100,407 214 $93,483 32 $45,644 0 $0 35 $72,305 2 $129,270 APPLICATIONS DENIED 10 $74,359 233 $92,366 719 $93,897 166 $34,183 4 $265,155 108 $73,021 0 $0 APPLICATIONS WITHDRAWN 8 $101,005 102 $101,526 330 $102,029 19 $33,625 0 $0 40 $83,803 2 $53,140 FILES CLOSED FOR INCOMPLETENESS 2 $129,460 32 $84,182 95 $114,740 2 $83,800 0 $0 10 $86,931 0 $0
Aggregated Statistics For Year 2005(Based on 7 full and 10 partial tracts) A) FHA, FSA/RHS & VA B) Conventional C) Refinancings D) Home Improvement Loans E) Loans on Dwellings For 5+ Families F) Non-occupant Loans on G) Loans On Manufactured Number Average Value Number Average Value Number Average Value Number Average Value Number Average Value Number Average Value Number Average Value
LOANS ORIGINATED 64 $101,717 702 $89,284 832 $96,025 154 $40,167 9 $540,396 246 $78,497 2 $85,000 APPLICATIONS APPROVED, NOT ACCEPTED 5 $120,482 124 $78,073 220 $96,179 30 $19,715 0 $0 38 $87,783 0 $0 APPLICATIONS DENIED 15 $125,476 217 $84,506 850 $102,743 175 $33,358 5 $1,239,222 89 $74,846 1 $24,820 APPLICATIONS WITHDRAWN 7 $131,363 80 $91,251 378 $102,552 49 $113,278 0 $0 42 $91,650 3 $101,327 FILES CLOSED FOR INCOMPLETENESS 2 $97,225 28 $96,933 81 $112,591 2 $4,785 1 $1,013,000 10 $105,686 0 $0
Aggregated Statistics For Year 2004(Based on 7 full and 10 partial tracts) A) FHA, FSA/RHS & VA B) Conventional C) Refinancings D) Home Improvement Loans E) Loans on Dwellings For 5+ Families F) Non-occupant Loans on G) Loans On Manufactured Number Average Value Number Average Value Number Average Value Number Average Value Number Average Value Number Average Value Number Average Value
LOANS ORIGINATED 87 $109,712 614 $93,106 921 $92,154 146 $28,770 9 $546,606 196 $76,997 2 $66,000 APPLICATIONS APPROVED, NOT ACCEPTED 5 $112,408 90 $88,584 224 $96,653 29 $29,723 4 $234,158 33 $78,438 0 $0 APPLICATIONS DENIED 21 $96,566 116 $83,114 633 $96,794 180 $26,389 1 $540,000 53 $70,344 1 $5,000 APPLICATIONS WITHDRAWN 10 $95,803 94 $97,697 357 $96,890 26 $46,206 1 $120,730 29 $89,362 0 $0 FILES CLOSED FOR INCOMPLETENESS 5 $114,474 22 $109,565 78 $98,415 4 $24,218 0 $0 10 $82,217 0 $0
Aggregated Statistics For Year 2003(Based on 7 full and 10 partial tracts) A) FHA, FSA/RHS & VA B) Conventional C) Refinancings D) Home Improvement Loans E) Loans on Dwellings For 5+ Families F) Non-occupant Loans on Number Average Value Number Average Value Number Average Value Number Average Value Number Average Value Number Average Value
LOANS ORIGINATED 117 $104,358 455 $96,942 1,900 $94,376 122 $22,437 4 $1,226,902 190 $79,831 APPLICATIONS APPROVED, NOT ACCEPTED 13 $110,852 80 $94,381 321 $90,385 32 $22,781 0 $0 34 $76,515 APPLICATIONS DENIED 13 $87,362 105 $83,035 745 $93,061 138 $21,543 0 $0 63 $78,276 APPLICATIONS WITHDRAWN 11 $117,618 64 $82,535 390 $94,850 13 $24,002 0 $0 31 $69,064 FILES CLOSED FOR INCOMPLETENESS 10 $87,198 20 $108,454 135 $101,672 2 $87,815 0 $0 10 $69,068
Aggregated Statistics For Year 2002(Based on 7 full and 10 partial tracts) A) FHA, FSA/RHS & VA B) Conventional C) Refinancings D) Home Improvement Loans E) Loans on Dwellings For 5+ Families F) Non-occupant Loans on Number Average Value Number Average Value Number Average Value Number Average Value Number Average Value Number Average Value
LOANS ORIGINATED 127 $101,089 467 $94,127 1,368 $92,290 135 $17,491 7 $378,771 148 $82,668 APPLICATIONS APPROVED, NOT ACCEPTED 7 $80,484 67 $83,257 359 $91,297 36 $26,293 0 $0 26 $86,244 APPLICATIONS DENIED 20 $88,146 94 $84,997 699 $86,940 121 $16,882 0 $0 41 $64,426 APPLICATIONS WITHDRAWN 14 $110,448 47 $103,686 334 $92,021 7 $30,967 0 $0 16 $80,871 FILES CLOSED FOR INCOMPLETENESS 2 $107,500 12 $77,979 89 $96,343 5 $30,792 0 $0 6 $101,170
Aggregated Statistics For Year 2001(Based on 7 full and 10 partial tracts) A) FHA, FSA/RHS & VA B) Conventional C) Refinancings D) Home Improvement Loans E) Loans on Dwellings For 5+ Families F) Non-occupant Loans on Number Average Value Number Average Value Number Average Value Number Average Value Number Average Value Number Average Value
LOANS ORIGINATED 170 $96,277 342 $91,298 1,129 $87,249 132 $19,782 4 $866,310 100 $75,993 APPLICATIONS APPROVED, NOT ACCEPTED 9 $82,193 39 $81,610 299 $82,889 44 $17,060 0 $0 15 $77,036 APPLICATIONS DENIED 27 $87,586 111 $61,928 734 $81,777 190 $11,815 0 $0 34 $66,008 APPLICATIONS WITHDRAWN 11 $112,755 44 $90,732 384 $86,860 34 $19,524 0 $0 13 $77,052 FILES CLOSED FOR INCOMPLETENESS 0 $0 7 $94,071 78 $86,231 9 $21,446 0 $0 2 $44,260
Aggregated Statistics For Year 2000(Based on 7 full and 10 partial tracts) A) FHA, FSA/RHS & VA B) Conventional C) Refinancings D) Home Improvement Loans E) Loans on Dwellings For 5+ Families F) Non-occupant Loans on Number Average Value Number Average Value Number Average Value Number Average Value Number Average Value Number Average Value
LOANS ORIGINATED 160 $94,292 386 $85,954 512 $71,080 177 $11,330 5 $241,152 110 $68,405 APPLICATIONS APPROVED, NOT ACCEPTED 11 $97,429 41 $65,369 231 $71,337 76 $11,637 0 $0 16 $60,172 APPLICATIONS DENIED 20 $88,979 104 $70,170 589 $72,499 275 $12,898 0 $0 34 $82,503 APPLICATIONS WITHDRAWN 15 $79,691 67 $76,592 253 $62,139 19 $27,405 0 $0 19 $69,285 FILES CLOSED FOR INCOMPLETENESS 3 $79,300 14 $62,826 75 $82,958 10 $6,898 0 $0 2 $46,550
Aggregated Statistics For Year 1999(Based on 6 full and 4 partial tracts) A) FHA, FSA/RHS & VA B) Conventional C) Refinancings D) Home Improvement Loans E) Loans on Dwellings For 5+ Families F) Non-occupant Loans on Number Average Value Number Average Value Number Average Value Number Average Value Number Average Value Number Average Value
LOANS ORIGINATED 132 $88,955 256 $84,384 499 $69,363 150 $13,477 2 $403,040 60 $61,529 APPLICATIONS APPROVED, NOT ACCEPTED 5 $91,894 41 $72,425 185 $71,375 57 $11,791 2 $202,000 13 $54,285 APPLICATIONS DENIED 7 $94,571 62 $72,584 358 $68,296 216 $11,105 3 $273,620 22 $44,685 APPLICATIONS WITHDRAWN 15 $90,731 37 $81,232 216 $70,973 21 $40,632 1 $440,000 10 $73,157 FILES CLOSED FOR INCOMPLETENESS 3 $110,433 6 $61,457 52 $73,686 2 $12,395 0 $0 2 $65,770
Private Mortgage Insurance Companies Aggregated Statistics For Year 2009(Based on 7 full and 8 partial tracts) A) Conventional B) Refinancings C) Non-occupant Loans on Number Average Value Number Average Value Number Average Value
LOANS ORIGINATED 12 $120,538 17 $127,580 1 $159,460 APPLICATIONS APPROVED, NOT ACCEPTED 5 $109,666 8 $137,748 1 $63,000 APPLICATIONS DENIED 3 $110,720 4 $135,430 0 $0 APPLICATIONS WITHDRAWN 2 $83,325 1 $87,860 0 $0 FILES CLOSED FOR INCOMPLETENESS 0 $0 0 $0 0 $0
Aggregated Statistics For Year 2008(Based on 7 full and 10 partial tracts) A) Conventional B) Refinancings C) Non-occupant Loans on Number Average Value Number Average Value Number Average Value
LOANS ORIGINATED 62 $93,472 30 $116,929 20 $72,812 APPLICATIONS APPROVED, NOT ACCEPTED 14 $89,393 30 $133,747 5 $88,672 APPLICATIONS DENIED 9 $55,264 5 $210,646 8 $50,922 APPLICATIONS WITHDRAWN 1 $99,900 1 $114,560 1 $65,000 FILES CLOSED FOR INCOMPLETENESS 1 $105,000 3 $126,977 2 $134,105
Aggregated Statistics For Year 2007(Based on 7 full and 10 partial tracts) A) Conventional B) Refinancings C) Non-occupant Loans on Number Average Value Number Average Value Number Average Value
LOANS ORIGINATED 200 $104,290 64 $118,056 28 $76,578 APPLICATIONS APPROVED, NOT ACCEPTED 14 $124,166 27 $134,273 3 $118,157 APPLICATIONS DENIED 3 $135,123 6 $147,995 1 $113,900 APPLICATIONS WITHDRAWN 4 $94,420 6 $111,443 0 $0 FILES CLOSED FOR INCOMPLETENESS 0 $0 1 $162,000 0 $0
Aggregated Statistics For Year 2006(Based on 7 full and 10 partial tracts) A) Conventional B) Refinancings C) Non-occupant Loans on Number Average Value Number Average Value Number Average Value
LOANS ORIGINATED 106 $101,940 39 $113,189 7 $89,263 APPLICATIONS APPROVED, NOT ACCEPTED 18 $118,782 22 $119,813 6 $106,405 APPLICATIONS DENIED 1 $98,250 0 $0 0 $0 APPLICATIONS WITHDRAWN 3 $149,337 4 $144,120 0 $0 FILES CLOSED FOR INCOMPLETENESS 0 $0 0 $0 0 $0
Aggregated Statistics For Year 2005(Based on 7 full and 10 partial tracts) A) Conventional B) Refinancings C) Non-occupant Loans on Number Average Value Number Average Value Number Average Value
LOANS ORIGINATED 131 $110,785 77 $116,150 42 $87,349 APPLICATIONS APPROVED, NOT ACCEPTED 26 $110,753 28 $123,551 3 $79,780 APPLICATIONS DENIED 0 $0 1 $83,380 0 $0 APPLICATIONS WITHDRAWN 4 $130,125 15 $96,285 1 $110,000 FILES CLOSED FOR INCOMPLETENESS 2 $69,055 0 $0 2 $69,055
Aggregated Statistics For Year 2004(Based on 7 full and 10 partial tracts) A) Conventional B) Refinancings C) Non-occupant Loans on Number Average Value Number Average Value Number Average Value
LOANS ORIGINATED 99 $109,499 76 $114,087 17 $82,035 APPLICATIONS APPROVED, NOT ACCEPTED 18 $77,508 40 $119,898 8 $75,032 APPLICATIONS DENIED 5 $80,514 3 $179,067 1 $84,000 APPLICATIONS WITHDRAWN 5 $109,538 20 $111,608 4 $83,220 FILES CLOSED FOR INCOMPLETENESS 1 $106,000 0 $0 0 $0
Aggregated Statistics For Year 2003(Based on 7 full and 10 partial tracts) A) Conventional B) Refinancings C) Non-occupant Loans on Number Average Value Number Average Value Number Average Value
LOANS ORIGINATED 107 $114,740 172 $110,639 21 $69,345 APPLICATIONS APPROVED, NOT ACCEPTED 26 $103,830 65 $124,181 8 $90,282 APPLICATIONS DENIED 7 $142,353 8 $122,712 3 $126,000 APPLICATIONS WITHDRAWN 6 $92,912 22 $145,537 4 $108,702 FILES CLOSED FOR INCOMPLETENESS 0 $0 2 $83,910 2 $83,910
Aggregated Statistics For Year 2002(Based on 7 full and 10 partial tracts) A) Conventional B) Refinancings C) Non-occupant Loans on Number Average Value Number Average Value Number Average Value
LOANS ORIGINATED 132 $108,163 164 $103,308 25 $81,133 APPLICATIONS APPROVED, NOT ACCEPTED 23 $116,403 66 $101,430 5 $84,228 APPLICATIONS DENIED 3 $105,080 4 $100,675 4 $116,800 APPLICATIONS WITHDRAWN 9 $64,632 21 $90,490 5 $56,070 FILES CLOSED FOR INCOMPLETENESS 0 $0 1 $89,980 0 $0
Aggregated Statistics For Year 2001(Based on 7 full and 10 partial tracts) A) Conventional B) Refinancings C) Non-occupant Loans on Number Average Value Number Average Value Number Average Value
LOANS ORIGINATED 107 $103,551 149 $105,939 8 $56,071 APPLICATIONS APPROVED, NOT ACCEPTED 18 $113,708 27 $113,436 4 $83,112 APPLICATIONS DENIED 1 $86,240 7 $123,447 2 $101,160 APPLICATIONS WITHDRAWN 6 $94,475 8 $91,211 0 $0 FILES CLOSED FOR INCOMPLETENESS 0 $0 3 $92,903 0 $0
Aggregated Statistics For Year 2000(Based on 7 full and 10 partial tracts) A) Conventional B) Refinancings C) Non-occupant Loans on Number Average Value Number Average Value Number Average Value
LOANS ORIGINATED 122 $91,599 28 $86,996 15 $56,547 APPLICATIONS APPROVED, NOT ACCEPTED 16 $91,903 7 $108,370 1 $74,730 APPLICATIONS DENIED 3 $78,943 2 $149,505 0 $0 APPLICATIONS WITHDRAWN 1 $132,000 0 $0 0 $0 FILES CLOSED FOR INCOMPLETENESS 0 $0 0 $0 0 $0
Aggregated Statistics For Year 1999(Based on 6 full and 4 partial tracts) A) Conventional B) Refinancings C) Non-occupant Loans on Number Average Value Number Average Value Number Average Value
LOANS ORIGINATED 73 $100,998 49 $87,735 6 $67,702 APPLICATIONS APPROVED, NOT ACCEPTED 7 $92,819 8 $83,155 0 $0 APPLICATIONS DENIED 5 $68,714 3 $69,877 1 $54,000 APPLICATIONS WITHDRAWN 1 $126,000 1 $133,000 0 $0 FILES CLOSED FOR INCOMPLETENESS 2 $121,000 0 $0 0 $0
2002 - 2018 National Fire Incident Reporting System (NFIRS) incidents See full 2006 National Fire Incident Reporting System statistics for zip code 45224, Ohio
Most common first names in zip code 45224 among deceased individuals Name Count Lived (average)
William 270 77.3 years Mary 268 81.5 years John 233 77.4 years Robert 199 74.6 years Helen 174 82.8 years Charles 157 78.0 years Ruth 150 82.2 years James 146 73.3 years Margaret 137 82.7 years Anna 132 84.3 years
Most common last names in zip code 45224 among deceased individuals Last name Count Lived (average)
Smith 93 78.3 years Johnson 63 75.5 years Williams 63 74.3 years Jones 57 76.4 years Miller 57 81.1 years Brown 52 78.9 years Davis 43 79.9 years Meyer 39 81.9 years Thomas 36 77.4 years Thompson 33 75.3 years
Businesses in zip code 45224
Name Count Name Count
AutoZone 1 Papa John's Pizza 1 Cricket Wireless 1 U-Haul 2 H&R Block 1 White Castle 1 McDonald's 2

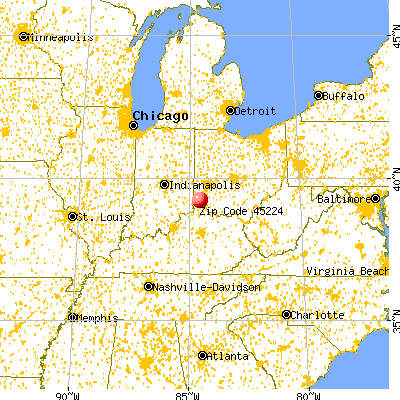


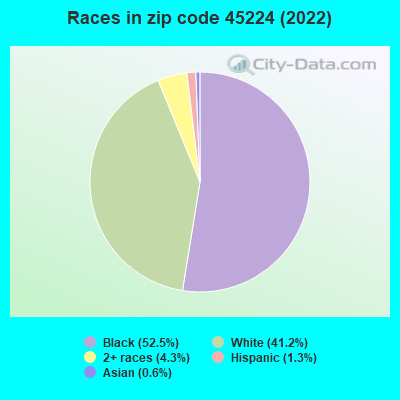


 Nearest zip codes: 45232, 45223, 45231, 45217, 45239, 45216.
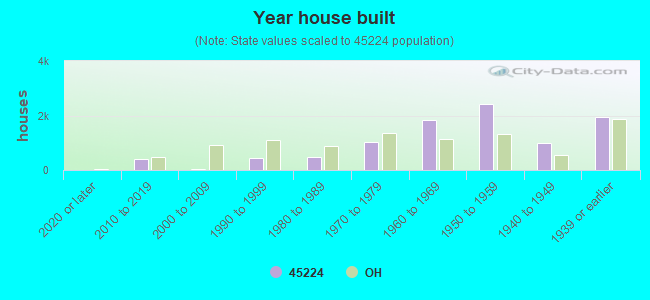

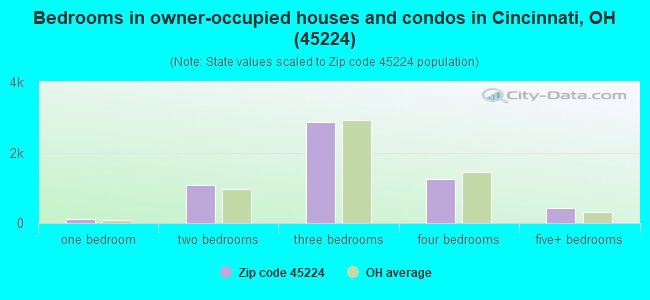
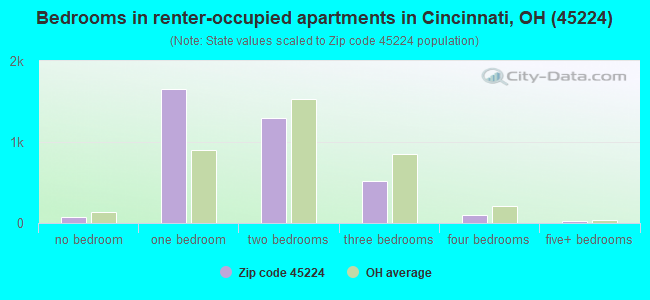
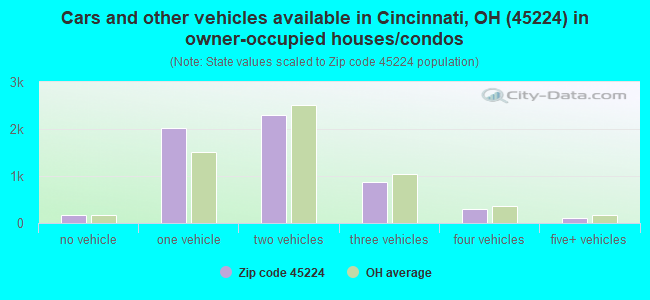
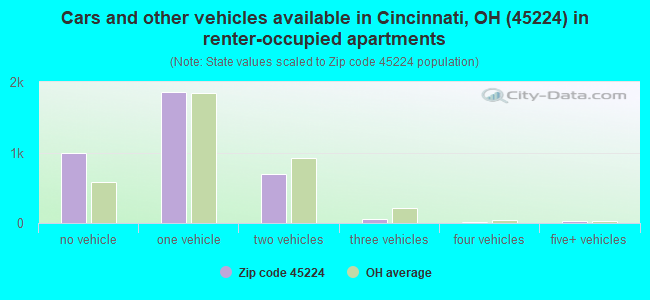


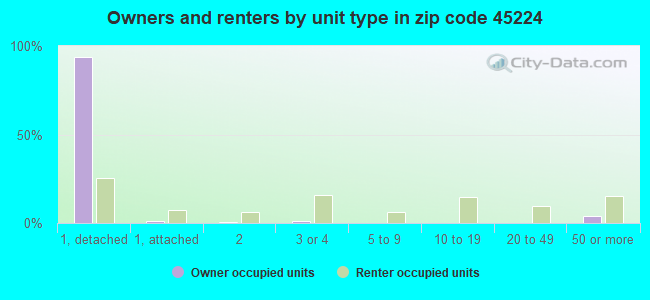
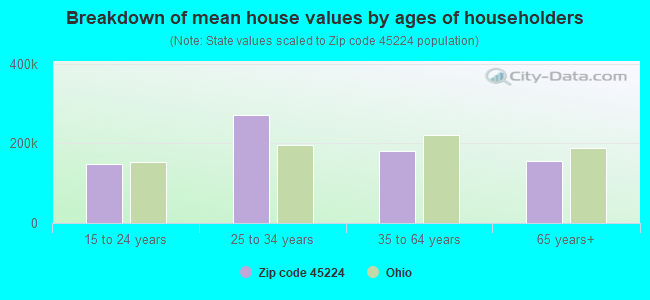


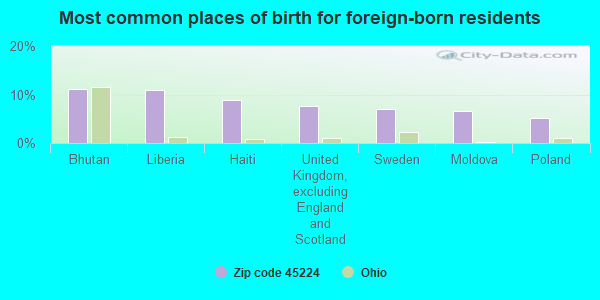
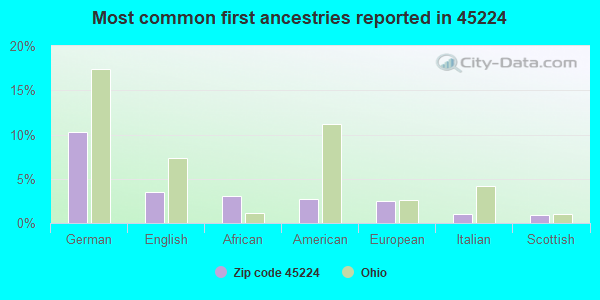
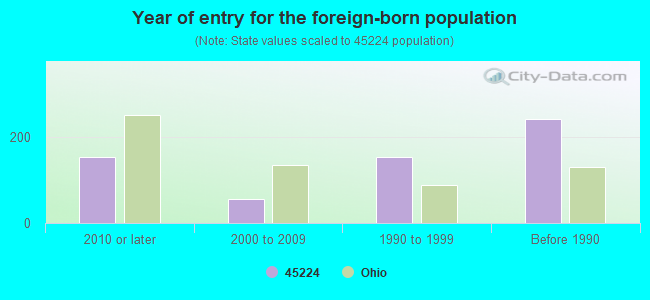


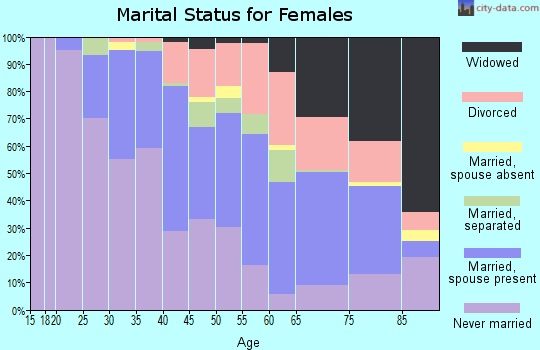
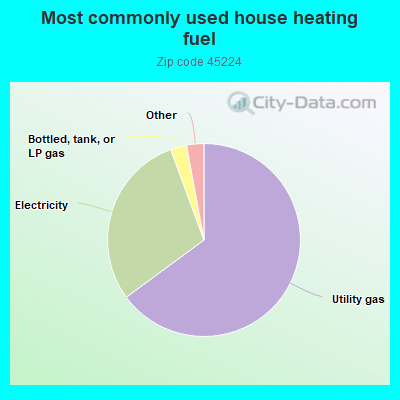
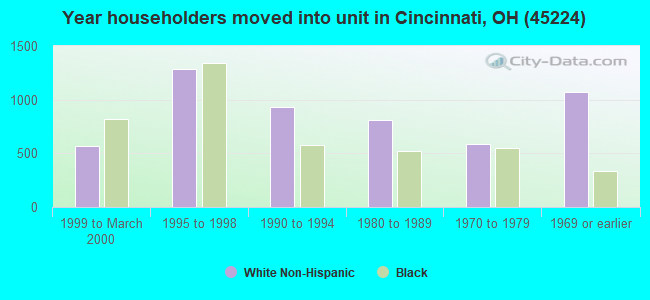
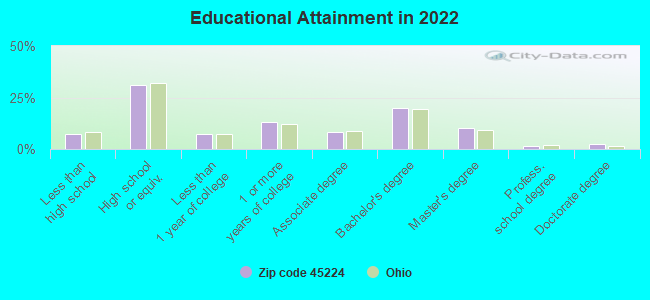
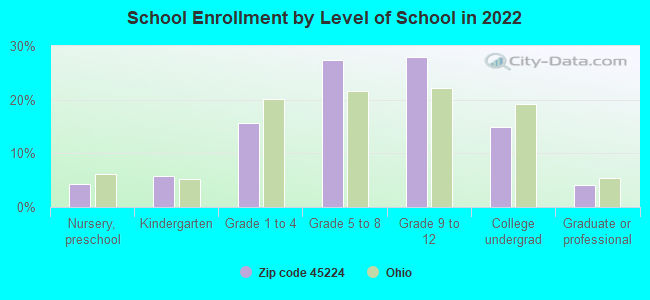
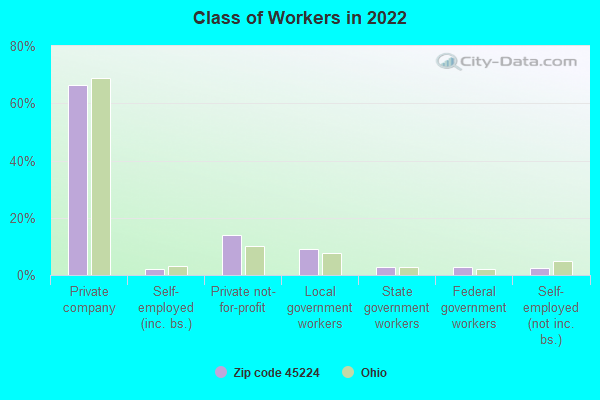
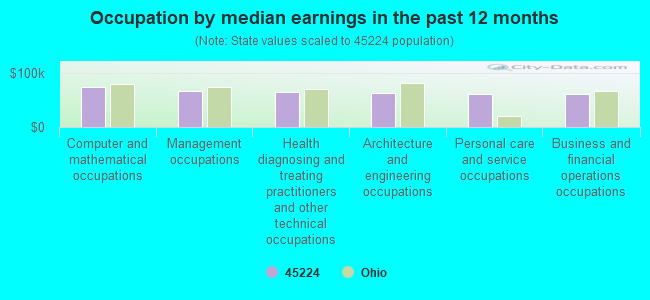
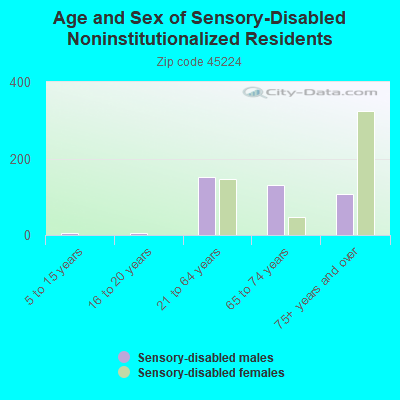
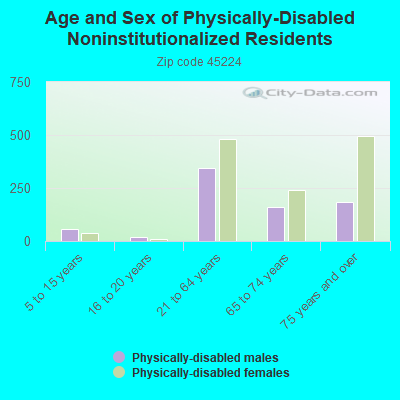
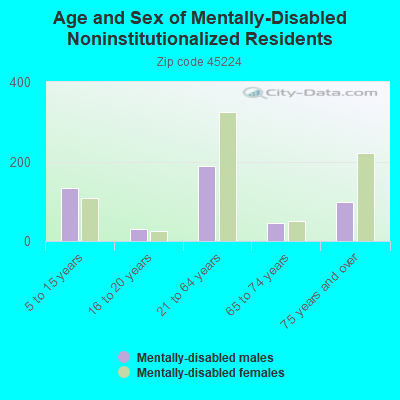
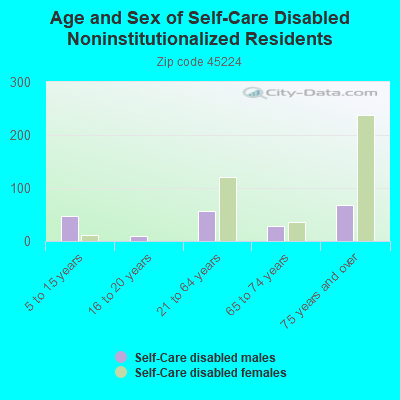
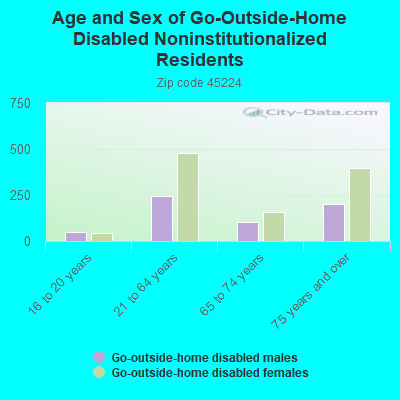
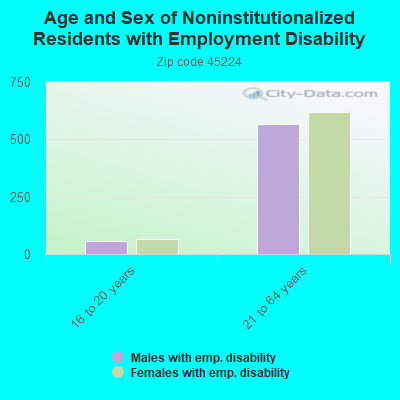
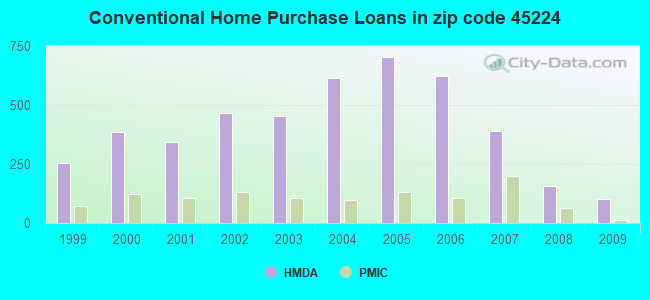
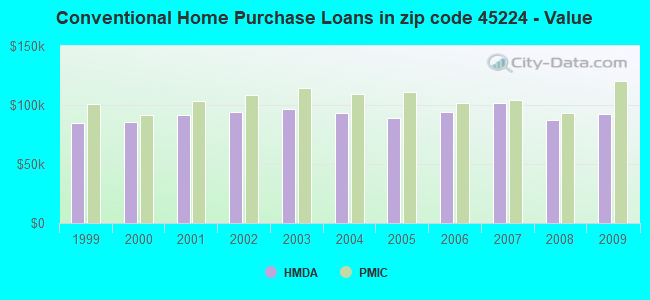
 Based on the data from the years 2002 - 2018 the average number of fires per year is 72. The highest number of fire incidents - 99 took place in 2010, and the least - 33 in 2002. The data has a rising trend.
 When looking into fire subcategories, the most reports belonged to: Structure Fires (41.3%), and Outside Fires (26.0%).