Estimated zip code population in 2022: 20,452 Zip code population in 2010: 20,197 Zip code population in 2000: 22,304
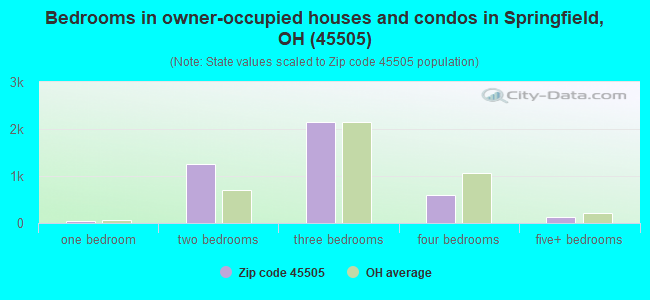
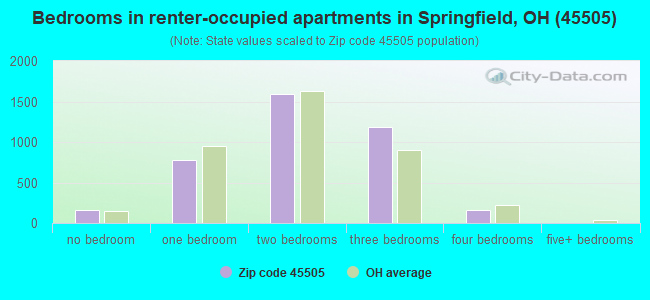
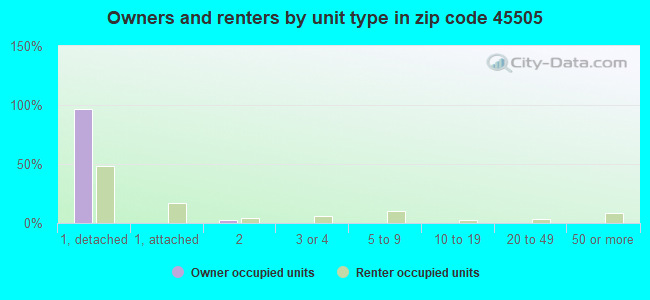
Houses and condos: 9,275 Renter-occupied apartments: 3,888
% of renters here:
48%
State:
33%
March 2022 cost of living index in zip code 45505: 91.3 (less than average, U.S. average is 100)
Land area: 13.5 sq. mi. Water area: 0.0 sq. mi.
Population density: 1,518 people per square mile
(low).
OSM Map
General Map
Google Map
MSN Map
OSM Map
General Map
Google Map
MSN Map
OSM Map
General Map
Google Map
MSN Map
OSM Map
General Map
Google Map
MSN Map
Please wait while loading the map...
Real estate property taxes paid for housing units in 2022:
This zip code:
1.3% ($1,195)
Ohio:
1.3% ($2,639)
Median real estate property taxes paid for housing units with mortgages in 2022: $1,280 (1.3%) Median real estate property taxes paid for housing units with no mortgage in 2022: $1,040 (1.4%)
Business Search- 14 Million verified businesses
Males: 10,066
(49.2%)
Females: 10,386
(50.8%)
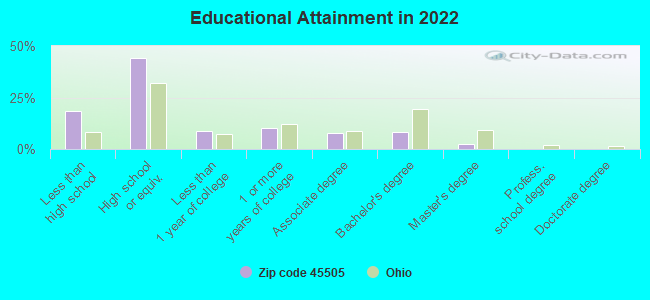
For population 25 years and over in 45505:
High school or higher: 80.4%
Bachelor's degree or higher: 10.7%
Graduate or professional degree: 2.8%
Unemployed: 7.5%
Mean travel time to work (commute): 22.6 minutes
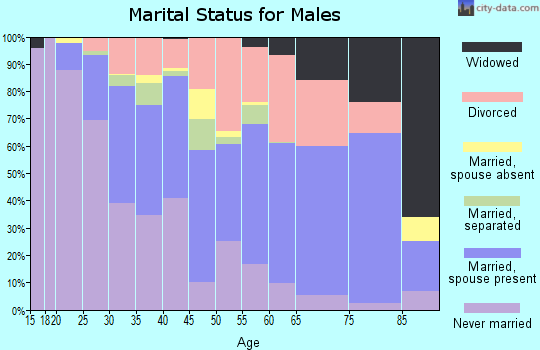
For population 15 years and over in 45505:
Never married: 41.3%
Now married: 35.2%
Separated: 2.4%
Widowed: 7.1%
Divorced: 14.0%
Zip code 45505 compared to state average:
Median household income below state average.
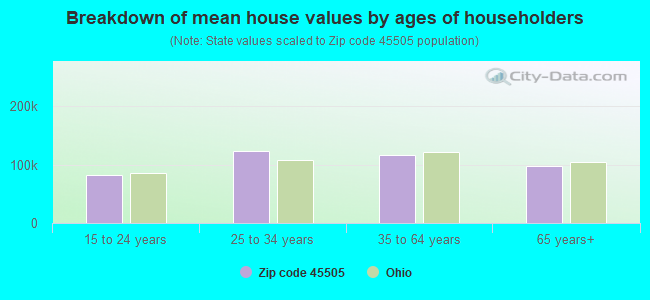
Median house value below state average.
Unemployed percentage above state average.
Median age below state average.
Length of stay since moving in significantly above state average.
House age above state average.
Number of college students below state average.
Percentage of population with a bachelor's degree or higher significantly below state average.
Averages for the 2020 tax year for zip code 45505, filed in 2021:
Average Adjusted Gross Income (AGI) in 2020: $35,985 (Individual Income Tax Returns)
Here:
$35,985
State:
$67,288
Salary/wage: $32,408 (reported on 85.7% of returns)
Here:
$32,408
State:
$55,628
(% of AGI for various income ranges: 1098.5% for AGIs below $25k, 3552.9% for AGIs $25k-50k, 6175.7% for AGIs $50k-75k, 8766.9% for AGIs $75k-100k, 13265.8% for AGIs $100k-200k)
Taxable interest for individuals: $414 (reported on 14.4% of returns)
This zip code:
$414
Ohio:
$1,518
(% of AGI for various income ranges: 4.5% for AGIs below $25k, 4.8% for AGIs $25k-50k, 15.3% for AGIs $50k-75k, 18.0% for AGIs $75k-100k, 27.1% for AGIs $100k-200k)
Ordinary dividends: $2,643 (reported on 5.0% of returns)
Here:
$2,643
State:
$7,167
(% of AGI for various income ranges: 3.6% for AGIs below $25k, 8.2% for AGIs $25k-50k, 20.9% for AGIs $50k-75k, 41.7% for AGIs $75k-100k, 217.1% for AGIs $100k-200k)
Net capital gain/loss in AGI: +$5,914 (reported on 4.0% of returns)
Here:
+$5,914
State:
+$18,919
(% of AGI for various income ranges: 1.0% for AGIs below $25k, 7.5% for AGIs $25k-50k, 40.6% for AGIs $50k-75k, 124.0% for AGIs $75k-100k, 447.1% for AGIs $100k-200k)
Profit/loss from business: +$7,762 (reported on 8.7% of returns)
Here:
+$7,762
State:
+$13,744
(% of AGI for various income ranges: 66.6% for AGIs below $25k, 50.6% for AGIs $25k-50k, 131.3% for AGIs $50k-75k, 141.7% for AGIs $75k-100k, 377.5% for AGIs $100k-200k)
Taxable individual retirement arrangement distribution: $12,754 (reported on 4.5% of returns)
45505:
$12,754
Ohio:
$18,876
(% of AGI for various income ranges: 24.2% for AGIs below $25k, 32.3% for AGIs $25k-50k, 89.0% for AGIs $50k-75k, 266.6% for AGIs $75k-100k, 714.6% for AGIs $100k-200k)
Total itemized deductions: $28,733 (reported on 1.0% of returns)
Here:
$28,733
State:
$33,869
(% of AGI for various income ranges: 11.4% for AGIs below $25k, 77.4% for AGIs $50k-75k, 182.6% for AGIs $75k-100k, 380.4% for AGIs $100k-200k)
Charity contributions: $7,967 (reported on 0.7% of returns)
Here:
$7,967
State:
$14,577
(% of AGI for various income ranges: 26.0% for AGIs $50k-75k, 105.8% for AGIs $100k-200k)
Taxes paid: $6,144 (reported on 1.0% of returns)
45505:
$6,144
State:
$7,681
(% of AGI for various income ranges: 1.7% for AGIs below $25k, 15.6% for AGIs $50k-75k, 42.3% for AGIs $75k-100k, 89.6% for AGIs $100k-200k)
Earned income credit: $2,482 (reported on 28.6% of returns)
Here:
$2,482
State:
$2,304
(% of AGI for various income ranges: 131.8% for AGIs below $25k, 80.2% for AGIs $25k-50k, 2.6% for AGIs $50k-75k)
Percentage of individuals using paid preparers for their 2020 taxes: 95.0%
Here:
95%
State:
94%
(% for various income ranges: 94.9% for AGIs below $25k, 95.1% for AGIs $25k-50k, 94.6% for AGIs $50k-75k, 93.6% for AGIs $75k-100k, 97.1% for AGIs $100k-200k, 100.0% for AGIs over 200k)
Averages for the 2012 tax year for zip code 45505, filed in 2013:
Average Adjusted Gross Income (AGI) in 2012: $30,620 (Individual Income Tax Returns)
Here:
$30,620
State:
$54,926
Salary/wage: $27,749 (reported on 86.6% of returns)
Here:
$27,749
State:
$45,869
(% of AGI for various income ranges: 78.9% for AGIs below $25k, 83.5% for AGIs $25k-50k, 78.7% for AGIs $50k-75k, 80.0% for AGIs $75k-100k, 72.4% for AGIs $100k-200k, 42.9% for AGIs over 200k)
Taxable interest for individuals: $599 (reported on 15.4% of returns)
This zip code:
$599
Ohio:
$1,297
(% of AGI for various income ranges: 0.4% for AGIs below $25k, 0.2% for AGIs $25k-50k, 0.3% for AGIs $50k-75k, 0.2% for AGIs $75k-100k, 0.2% for AGIs $100k-200k, 0.5% for AGIs over 200k)
Ordinary dividends: $2,720 (reported on 6.5% of returns)
Here:
$2,720
State:
$5,821
(% of AGI for various income ranges: 0.3% for AGIs below $25k, 0.2% for AGIs $25k-50k, 0.3% for AGIs $50k-75k, 1.0% for AGIs $75k-100k, 2.6% for AGIs $100k-200k)
Net capital gain/loss in AGI: +$2,745 (reported on 3.7% of returns)
Here:
+$2,745
State:
+$11,232
(% of AGI for various income ranges: 0.4% for AGIs $50k-75k, 2.5% for AGIs $100k-200k)
Profit/loss from business: +$9,468 (reported on 9.1% of returns)
Here:
+$9,468
State:
+$12,773
(% of AGI for various income ranges: 5.6% for AGIs below $25k, 1.6% for AGIs $25k-50k, 1.4% for AGIs $50k-75k, 2.3% for AGIs $75k-100k, 4.8% for AGIs $100k-200k)
Taxable individual retirement arrangement distribution: $9,055 (reported on 6.0% of returns)
45505:
$9,055
Ohio:
$14,511
(% of AGI for various income ranges: 1.5% for AGIs below $25k, 1.2% for AGIs $25k-50k, 1.9% for AGIs $50k-75k, 1.5% for AGIs $75k-100k, 4.8% for AGIs $100k-200k)
Total itemized deductions: $15,275 (22% of AGI, reported on 11.8% of returns)
Here:
$15,275
State:
$21,278
Here:
22.0% of AGI
State:
18.8% of AGI
(% of AGI for various income ranges: 2.3% for AGIs below $25k, 4.0% for AGIs $25k-50k, 7.4% for AGIs $50k-75k, 7.8% for AGIs $75k-100k, 12.9% for AGIs $100k-200k, 12.0% for AGIs over 200k)
Charity contributions: $3,426 (reported on 8.0% of returns)
Here:
$3,426
State:
$3,943
(% of AGI for various income ranges: 0.2% for AGIs below $25k, 0.5% for AGIs $25k-50k, 1.0% for AGIs $50k-75k, 1.2% for AGIs $75k-100k, 2.8% for AGIs $100k-200k, 2.5% for AGIs over 200k)
Taxes paid: $5,302 (reported on 11.7% of returns)
45505:
$5,302
State:
$9,568
(% of AGI for various income ranges: 0.4% for AGIs below $25k, 1.1% for AGIs $25k-50k, 2.5% for AGIs $50k-75k, 2.9% for AGIs $75k-100k, 4.8% for AGIs $100k-200k, 7.1% for AGIs over 200k)
Earned income credit: $2,435 (reported on 32.9% of returns)
Here:
$2,435
State:
$2,285
(% of AGI for various income ranges: 9.6% for AGIs below $25k, 1.4% for AGIs $25k-50k)
Percentage of individuals using paid preparers for their 2012 taxes: 43.9%
Here:
44%
State:
51%
(% for various income ranges: 41.1% for AGIs below $25k, 45.1% for AGIs $25k-50k, 47.0% for AGIs $50k-75k, 54.1% for AGIs $75k-100k, 60.0% for AGIs $100k-200k, 66.7% for AGIs over 200k)
Averages for the 2004 tax year for zip code 45505, filed in 2005:
Average Adjusted Gross Income (AGI) in 2004: $27,892 (Individual Income Tax Returns)
Here:
$27,892
State:
$44,480
Salary/wage: $25,697 (reported on 88.8% of returns)
Here:
$25,697
State:
$39,198
(% of AGI for various income ranges: 87.5% for AGIs below $10k, 80.4% for AGIs $10k-25k, 85.6% for AGIs $25k-50k, 84.1% for AGIs $50k-75k, 85.4% for AGIs $75k-100k, 56.3% for AGIs over 100k)
Taxable interest for individuals: $1,121 (reported on 24.3% of returns)
This zip code:
$1,121
Ohio:
$1,532
(% of AGI for various income ranges: 1.5% for AGIs below $10k, 1.1% for AGIs $10k-25k, 0.6% for AGIs $25k-50k, 0.8% for AGIs $50k-75k, 1.2% for AGIs $75k-100k, 2.2% for AGIs over 100k)
Taxable dividends: $1,670 (reported on 8.6% of returns)
Here:
$1,670
State:
$3,496
(% of AGI for various income ranges: 0.5% for AGIs below $10k, 0.4% for AGIs $10k-25k, 0.3% for AGIs $25k-50k, 0.4% for AGIs $50k-75k, 0.9% for AGIs $75k-100k, 1.5% for AGIs over 100k)
Net capital gain/loss: +$5,988 (reported on 5.7% of returns)
Here:
+$5,988
State:
+$8,582
(% of AGI for various income ranges: 0.6% for AGIs below $10k, 0.2% for AGIs $10k-25k, 0.3% for AGIs $25k-50k, 0.5% for AGIs $50k-75k, 1.3% for AGIs $75k-100k, 9.9% for AGIs over 100k)
Profit/loss from business: +$5,928 (reported on 8.4% of returns)
Here:
+$5,928
State:
+$10,813
(% of AGI for various income ranges: 3.4% for AGIs below $10k, 2.4% for AGIs $10k-25k, 1.1% for AGIs $25k-50k, 1.0% for AGIs $50k-75k, 1.5% for AGIs $75k-100k, 4.5% for AGIs over 100k)
IRA payment deduction: $1,896 (reported on 1.1% of returns)
45505:
$1,896
Ohio:
$2,794
Total itemized deductions: $13,101 (23% of AGI, reported on 18.0% of returns)
Here:
$13,101
State:
$17,503
Here:
23.1% of AGI
State:
20.8% of AGI
(% of AGI for various income ranges: 2.6% for AGIs below $10k, 3.4% for AGIs $10k-25k, 7.2% for AGIs $25k-50k, 10.7% for AGIs $50k-75k, 13.9% for AGIs $75k-100k, 16.2% for AGIs over 100k)
Charity contributions deductions: $2,728 (4% of AGI, reported on 13.4% of returns)
Here:
$2,728
State:
$3,087
Here:
4.4% of AGI
State:
3.4% of AGI
(% of AGI for various income ranges: 0.2% for AGIs below $10k, 0.3% for AGIs $10k-25k, 0.8% for AGIs $25k-50k, 1.6% for AGIs $50k-75k, 2.0% for AGIs $75k-100k, 5.0% for AGIs over 100k)
Total tax: $3,243 (reported on 65.2% of returns)
45505:
$3,243
State:
$6,781
(% of AGI for various income ranges: 1.4% for AGIs below $10k, 3.6% for AGIs $10k-25k, 6.8% for AGIs $25k-50k, 9.0% for AGIs $50k-75k, 10.5% for AGIs $75k-100k, 16.2% for AGIs over 100k)
Earned income credit: $1,798 (reported on 27.1% of returns)
Here:
$1,798
State:
$1,696
Percentage of individuals using paid preparers for their 2004 taxes: 55.5%
Here:
56%
State:
55%
(% for various income ranges: 48.0% for AGIs below $10k, 59.5% for AGIs $10k-25k, 57.0% for AGIs $25k-50k, 56.7% for AGIs $50k-75k, 54.4% for AGIs $75k-100k, 60.9% for AGIs over 100k)
Likely homosexual households (counted as self-reported same-sex unmarried-partner households)
Lesbian couples: 0.1% of all households
Gay men: 0.3% of all households
Household received Food Stamps/SNAP in the past 12 months: 2,509 Household did not receive Food Stamps/SNAP in the past 12 months: 5,650
Women who had a birth in the past 12 months: 329 (165 now married, 161 unmarried) Women who did not have a birth in the past 12 months: 4,493 (1,436 now married, 3,058 unmarried)
Housing units in zip code 45505 with a mortgage: 2,382 (198 second mortgage, 110 both second mortgage and home equity loan) Houses without a mortgage: 184
Median monthly owner costs for units with a mortgage: $884 Median monthly owner costs for units without a mortgage: $402
Residents with income below the poverty level in 2022:
This zip code:
27.0%
Whole state:
13.4%
Residents with income below 50% of the poverty level in 2022:
This zip code:
10.7%
Whole state:
7.0%
Median number of rooms in houses and condos:
Here:
6.2
State:
6.7
Median number of rooms in apartments:
Here:
4.7
State:
4.4
Notable locations in this zip code not listed on our city pages
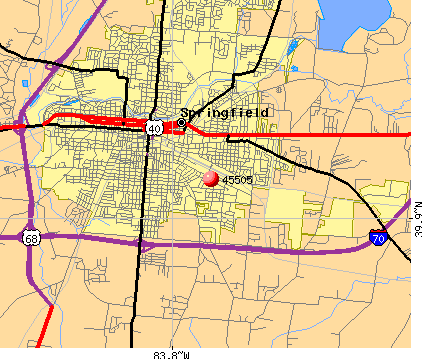
Notable locations in zip code 45505: Evans Stadium (A), Clark County Fairgrounds (B), Reid Memorial Golf Course (C), Quality Care Transport (D), Metropolitan Park Recreation Center (E), Springfield Township Fire and Rescue Station 2 (F), Springfield Fire and Rescue Division Station 3 (G), Springfield Fire and Rescue Division Station 6 (H). Display/hide their locations on the map
Shopping Centers: Burnett Plaza Shopping Center (1), Southern Village Shopping Center (2), Circus Plaza Shopping Center (3), Springfield Shopping Center (4). Display/hide their locations on the map
Churches in zip code 45505 include: Assumption of the Blessed Virgin Mary Greek Orthodox Cathedral (A), Beacon Street Church of Christ in Christian Union (B), Church of God (C), Clifton Avenue Church of God (D), Elbethel Temple (E), Fellowship Christian Church (F), Fifth Lutheran Church (G), First Church of the Open Bible (H), Maranatha Baptist Church (I). Display/hide their locations on the map
In group quarters: 136 (-1 institutionalized population)
Size of family households: 1,747 2-persons, 1,093 3-persons, 746 4-persons, 716 5-persons, 230 6-persons, 165 7-or-more-persons
Size of nonfamily households: 2,660 1-person, 595 2-persons, 151 3-persons
1,711 married couples with children.
2,632 single-parent households (368 men, 2,264 women).
94.1% of residents of 45505 zip code speak English at home.
3.1% of residents speak Spanish at home (46% very well, 16% well, 14% not well, 24% not at all).
2.0% of residents speak other Indo-European language at home (18% very well, 37% well, 10% not well, 35% not at all).
0.7% of residents speak Asian or Pacific Island language at home (21% very well, 79% not well).
0.1% of residents speak other language at home (67% very well, 33% well).
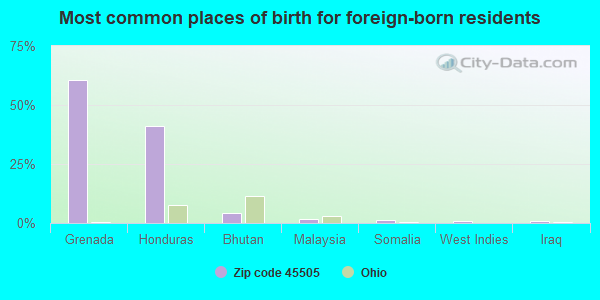
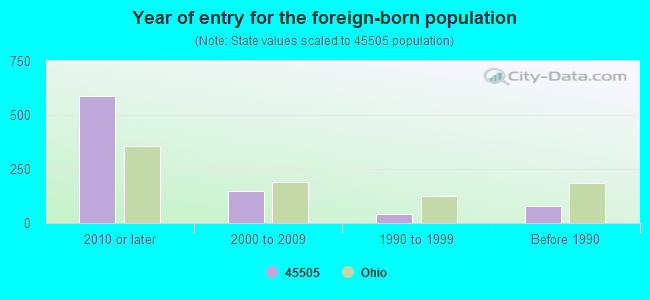
Foreign born population: 678 (3.3%) (11.9% of them are naturalized citizens)
Facilities with environmental interests located in this zip code:
BORG WARNER AUTOMOTIVE AFS-SPRINGFIELD * (1600 E PLEASANT AVE in SPRINGFIELD, OH)
AIR MAJOR (AIRS/AFS) STATE MASTER (Ohio general info) - RCRA-OHD089424972, HAZARDOUS WASTE PROGRAM, AIR MAJOR STATE MASTER (Ohio general info) - AIR MAJOR, EPCRA, TRIS-45505SNYDR1600E, TRI REPORTER HAZARDOUS WASTE BIENNIAL REPORTER (Resource Conservation and Recovery Act (tracking hazardous waste)) Small Quantity Generators, between 100 kg and 1000 kg of hazardous waste/month (Resource Conservation and Recovery Act (tracking hazardous waste)) - notification TRI REPORTER (Tracking of toxic chemicals releasing facilities) Business SIC classification: MOTOR VEHICLE PARTS AND ACCESSORIES Organizations: BORG-WARNER AUTOMOTIVE AFS INC (CONTACT/OWNER)
, BORG-WARNER AUTOMOTIVE AFS-SPR (CONTACT/OWNER)
Alternative names: BORG WARNER AUTOMOTIVE OHIO, SNYDER TANK CORP.
AKZO NOBEL COATINGS INC (1550 PROGRESS DRIVE in SPRINGFIELD, OH)
AIR MINOR (AIRS/AFS) CRITERIA AND HAZARDOUS AIR POLLUTANT INVENTORY (Inventory of air pollution sources) STATE MASTER (Ohio general info) - RCRA-OHD981958044, HAZARDOUS WASTE PROGRAM, AIR MAJOR, TRIS-45505KZCTN1550P, TRI REPORTER HAZARDOUS WASTE BIENNIAL REPORTER (Resource Conservation and Recovery Act (tracking hazardous waste)) Large Quantity Generators, more that 1000 kg of hazardous waste/month (Resource Conservation and Recovery Act (tracking hazardous waste)) - notification TRI REPORTER (Tracking of toxic chemicals releasing facilities) Business SIC classification: PAINTS, VARNISHES, LACQUERS, ENAMELS, AND ALLIED PRODUCTS Business NAICS classification: PAINT AND COATING MANUFACTURING. Alternative names: AKZO COATINGS INC, AKZO COATINGS AMERICA, INC.
ARMOLOY OF OHIO INC (1950 E. LEFFEL LANE in SPRINGFIELD, OH)
AIR MINOR (AIRS/AFS) ENFORCEMENT/COMPLIANCE ACTIVITY (Integrated Compliance Information System) STATE MASTER (Ohio general info) - AIR MAJOR, EPCRA, RCRA-OHD987055043, HAZARDOUS WASTE PROGRAM Small Quantity Generators, between 100 kg and 1000 kg of hazardous waste/month (Resource Conservation and Recovery Act (tracking hazardous waste)) - notification TRI REPORTER (Tracking of toxic chemicals releasing facilities) Business SIC classification: ELECTROPLATING, PLATING, POLISHING, ANODIZING, AND COLORING Organizations: ARMOLOY OF OHIO INC BUTLER VALERIE (CONTACT/OWNER)
, ARMOLOY OF OHIO INC - BUTLER V (CONTACT/OWNER)
CHAMPION CO (400 HARRISON ST. in SPRINGFIELD, OH)
AIR MINOR (AIRS/AFS) CRITERIA AND HAZARDOUS AIR POLLUTANT INVENTORY (Inventory of air pollution sources) STATE MASTER (Ohio general info) - EPCRA, TRIS-45505THCHM400HA, TRI REPORTER, RCRA-OHD004283917, HAZARDOUS WASTE PROGRAM Small Quantity Generators, between 100 kg and 1000 kg of hazardous waste/month (Resource Conservation and Recovery Act (tracking hazardous waste)) - notification TRI REPORTER (Tracking of toxic chemicals releasing facilities) Business SIC classification: CHEMICALS AND CHEMICAL PREPARATIONS; MANUFACTURING INDUSTRIES Alternative names: CHAMPION COMPANY PLANT 1
BAUSER ROAD OILING (525 EAST ST in SPRINGFIELD, OH)
STATE MASTER (Ohio general info) - RCRA-OHD000371732, HAZARDOUS WASTE PROGRAM TRANSPORTER (Resource Conservation and Recovery Act (tracking hazardous waste)) Organizations: GEORGE W BAUSER JR (CONTACT/OWNER)
CHERRY POINT MOBILE PARK (580 SOUTH BIRD RD in SPRINGFIELD, OH)
STATE MASTER (Ohio general info) - SDWIS-1200512, DRINKING WATER PROGRAM, PCS-OH0131784, National Pollutant Discharge Elimination System Permit National Pollutant Discharge Elimination System NON-MAJOR (Tracking pollutant discharge elimination systems) - permit Business SIC classification: OPERATORS OF RESIDENTIAL MOBILE HOME SITES Organizations: PAUL R. CHANEY DBA (CONTACT/OWNER)
Alternative names: CHERRY POINT MHP, CHERRY POINT MOBILE HOME PARK
ARROWHEAD PLASTICS INC (1620 E PLEASANT ST in SPRINGFIELD, OH)
STATE MASTER (Ohio general info) - RCRA-OHD987035938, HAZARDOUS WASTE PROGRAM Small Quantity Generators, between 100 kg and 1000 kg of hazardous waste/month (Resource Conservation and Recovery Act (tracking hazardous waste)) - notification
BENJAMIN STEEL CO (423 S YORK ST in SPRINGFIELD, OH)
STATE MASTER (Ohio general info) - RCRA-OHD987029865, HAZARDOUS WASTE PROGRAM Small Quantity Generators, between 100 kg and 1000 kg of hazardous waste/month (Resource Conservation and Recovery Act (tracking hazardous waste)) - notification Organizations: BENJAMIN STEEL CORP (CONTACT/OWNER)
CERTIFIED OIL CO NO 431 (2501 SOUTH LIMESTONE STREET in SPRINGFIELD, OH)
CRITERIA AND HAZARDOUS AIR POLLUTANT INVENTORY (Inventory of air pollution sources) STATE MASTER (Ohio general info) - AIR MAJOR, SDWIS-1241912, DRINKING WATER PROGRAM Business SIC classification: GASOLINE SERVICE STATIONS Alternative names: CERTIFIED OIL COMPANY
ARMOLOY OF OHIO INCORPORATED (1601 SHERIDAN AVENUE SITE B in SPRINGFIELD, OH)
(Resource Conservation and Recovery Act (tracking hazardous waste)) Organizations: D AND H MANUFACTURERS INC (CONTACT/OWNER)
BP OIL CO SITE 09444 (1931 S LIMESTONE ST in SPRINGFIELD, OH)
(Resource Conservation and Recovery Act (tracking hazardous waste)) Organizations: BP OIL COMPANY (CONTACT/OWNER)
BASIC PLASTICS LTD (625 BURT ST in SPRINGFIELD, OH)
Conditionally Exempt Small Quantity Generators, less than 100 kg/month of hazardous waste (Resource Conservation and Recovery Act (tracking hazardous waste)) Organizations: FREUDENBERG HOUSEHOLD PRODUCTS (CONTACT/OPERATOR)
, LEVENTHAL LIMITED PARTNERSHIP (CONTACT/OWNER)
Housing units lacking complete plumbing facilities: 4.1% Housing units lacking complete kitchen facilities: 6.8%
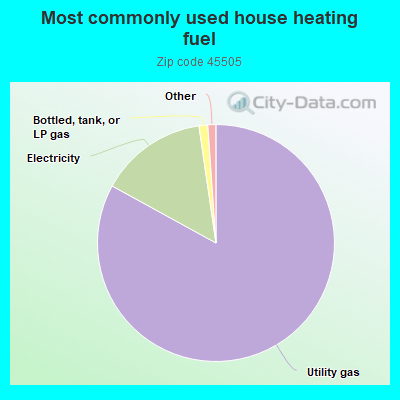
83.0%Utility gas
14.7%Electricity
1.2%Bottled, tank, or LP gas
Population in 1990: 23,956.
Place of birth for U.S.-born residents:
This state: 17,217
Northeast: 317
Midwest: 465
South: 1,483
West: 133
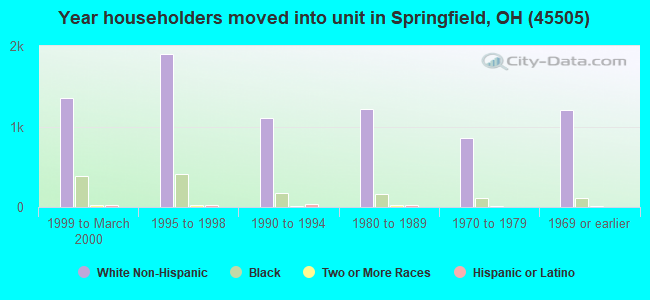
53% of the 45505 zip code residents lived in the same house 5 years ago. Out of people who lived in different houses, 79% lived in this county. Out of people who lived in different counties, 50% lived in Ohio.
84% of the 45505 zip code residents lived in the same house 1 year ago. Out of people who lived in different houses, 61% moved from this county. Out of people who lived in different houses, 14% moved from different county within same state. Out of people who lived in different houses, 15% moved from different state. Out of people who lived in different houses, 6% moved from abroad.
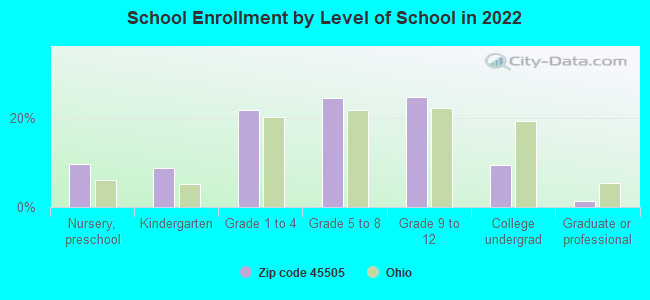
Private vs. public school enrollment:
Students in private schools in grades 1 to 8 (elementary and middle school): 240
Here:
10.9%
Ohio:
16.0%
Students in private schools in grades 9 to 12 (high school): 214
Here:
18.0%
Ohio:
13.1%
Students in private undergraduate colleges: 74
Here:
16.6%
Ohio:
22.3%
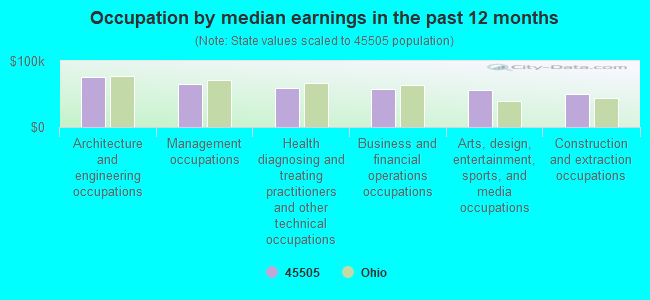
Occupation by median earnings in the past 12 months ($)
75,740Architecture and engineering occupations
65,346Management occupations
58,343Health diagnosing and treating practitioners and other technical occupations
58,049Business and financial operations occupations
55,829Arts, design, entertainment, sports, and media occupations
49,393Construction and extraction occupations
Companies with federal contracts located in this zip code (SPRINGFIELD, OH):
TAC INDUSTRIES, INC (2160 OLD SELMA RD) : $21,744,454 in 4 contractsfrom 2005 to 2006
$10,956,865 with Air Force for Parachutes; Aerial Pick Up, Delivery, Recovery Systems; and Cargo Tie Down Equipment. Signed on 2005-07-28. Completion date: 2006-09-29.
$10,000,136, same as above.Signed on 2006-06-29. Completion date: 2007-12-31.
$781,788, same as above.Signed on 2005-06-30. Completion date: 2009-06-29.
$5,665, same as above.Signed on 2005-11-21. Completion date: 2005-12-30.
BENNETT & BENNETT INC (1318 KENTON ST; small business) : $248,874 in 13 contractsfrom 2002 to 2005
Contracts for Miscellaneous Maintenance and Repair Shop Specialized Equipment, Fuses, Arresters, Absorbers, and Protectors, , Safety and Rescue Equipment by Defense Logistics Agency, NASA Signed by year:2000: $0; 2001: $0; 2002: $108,258; 2003: $45,400; 2004: $70,966; 2005: $24,250; 2006: $0.
Biggest contracts:
$45,400 with Defense Logistics Agency for Miscellaneous Maintenance and Repair Shop Specialized Equipment. Signed on 2003-10-28. Completion date: 2004-05-25.
$40,474, same as above.Signed on 2002-08-09. Completion date: 2002-12-17.
$40,474, same as above.Signed on 2002-08-09. Completion date: 2002-12-17.
$28,661, same as above.Signed on 2004-03-17. Completion date: 2004-11-12.
TRIEC ELECTRICAL SERVICES, INC (1630 PROGRESS RD; small business) : $150,559 in 4 contractsfrom 2002 to 2006
$74,340 with Army for Miscellaneous Electrical and Electronic Components. Signed on 2002-07-12. Completion date: 2002-08-12.
$34,340, same as above.Signed on 2002-04-04. Completion date: 2002-04-25.
$22,629 with Army for Maintenance, Repair or Alteration of Real Property -- Office Buildings. Signed on 2006-05-03. Completion date: 2006-06-17.
$19,250 with Army for Electric Services. Signed on 2004-09-10. Completion date: 2004-09-12.
MANPOWER INC OF SPRINGFIELD, (23 S BELMONT AVENUE; small business) : $23,706 in 8 contractsfrom 2003 to 2006
Contracts for Custodial Janitorial Services by Army Signed by year:2000: $0; 2001: $0; 2002: $0; 2003: $11,309; 2004: $11,701; 2005: $1,669; 2006: -$973.
Biggest contracts:
$12,009 with Army for Custodial Janitorial Services. Signed on 2004-10-01. Completion date: 2005-09-30.
$11,309, same as above.Signed on 2003-10-01. Completion date: 2004-09-30.
$2,916, same as above.Signed on 2005-10-01. Completion date: 2005-09-30.
$242, same as above.Signed on 2006-02-16. Completion date: 2005-09-30.
HAYS FABRICATING & WELDING INC (633 E LEFFEL LN; small business)
$19,592 with Navy for Miscellaneous Welding Equipment. Signed on 2005-03-14. Completion date: 2005-04-07.
J & S INSTRUMENTS INC (3071 STATE ROUTE 72 S; small business) : $18,013 in 5 contractsfrom 2005 to 2006
Contracts for Pressure, Temperature, and Humidity Measuring and Controlling Instruments, Mini and Micro Computer Control Devices by Defense Logistics Agency, EPA Signed by year:2000: $0; 2001: $0; 2002: $0; 2003: $0; 2004: $0; 2005: $3,695; 2006: $14,318.
Biggest contracts:
$4,439 with Defense Logistics Agency for Pressure, Temperature, and Humidity Measuring and Controlling Instruments. Signed on 2006-06-23. Completion date: 2006-08-22.
$3,900, same as above.Signed on 2006-03-06. Completion date: 2006-05-05.
$3,695 with EPA for Mini and Micro Computer Control Devices. Taking place in KS. Signed on 2005-09-07. Completion date: 2005-10-07.
$3,000 with Defense Logistics Agency for Pressure, Temperature, and Humidity Measuring and Controlling Instruments. Signed on 2006-03-08. Completion date: 2006-05-07.
COLEMAN LANDSCAPING AND SNOW R (818 OAK ST; small business) : $5,650 in 2 contractsin 2003
$5,650 with Army for Snow Removal/Salt Service (also spreading aggregate or other snow melting material). Signed on 2003-11-01. Completion date: 2004-10-31.
$0, same as above.Signed on 2003-11-01. Completion date: 2004-10-31.
BRAIN LUMBER COMPANY, THE (409 EAST ST; small business)
$4,402 with Army for Fencing, Fences, Gates and Components. Signed on 2004-09-07. Completion date: 2004-10-07.
ROLLINS MOVING & STORAGE INC (1900 E LEFFEL LN; small business)
$4,142 with Army for Packaging and Packing Bulk Materials. Signed on 2004-05-18. Completion date: 2004-06-16.
Top industries in this zip code by the number of employees in 2005:
Health Care and Social Assistance: General Medical and Surgical Hospitals (over 1000 employees: 1 establishment)
Health Care and Social Assistance: Offices of Physicians (except Mental Health Specialists) (50-99: 2, 20-49: 4, 10-19: 5, 5-9: 19, 1-4: 12)
2002 - 2018 National Fire Incident Reporting System (NFIRS) incidents
Based on the data from the years 2002 - 2018 the average number of fires per year is 136. The highest number of fire incidents - 184 took place in 2002, and the least - 96 in 2018. The data has a dropping trend.
When looking into fire subcategories, the most reports belonged to: Structure Fires (46.2%), and Outside Fires (31.0%).
Fire incident types reported to NFIRS in Zip Code 45505

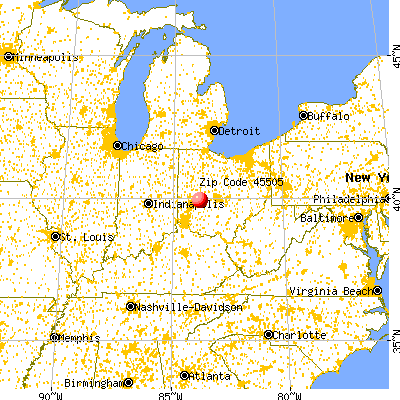


 Nearest zip codes: 45502, 45503, 45506, 45504, 45368, 45316.
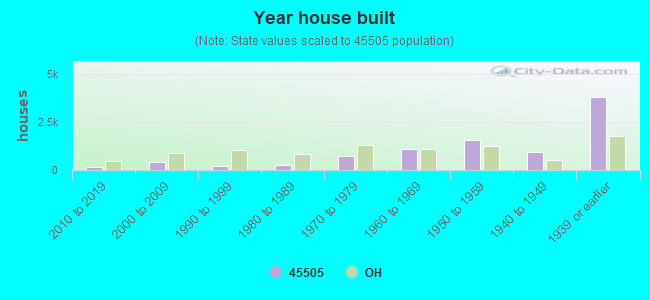


 Based on the data from the years 2002 - 2018 the average number of fires per year is 136. The highest number of fire incidents - 184 took place in 2002, and the least - 96 in 2018. The data has a dropping trend.
 When looking into fire subcategories, the most reports belonged to: Structure Fires (46.2%), and Outside Fires (31.0%).