Estimated zip code population in 2022: 3,739 Zip code population in 2010: 4,179 Zip code population in 2000: 4,163
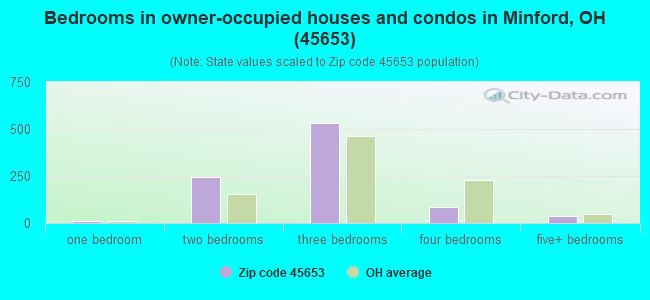
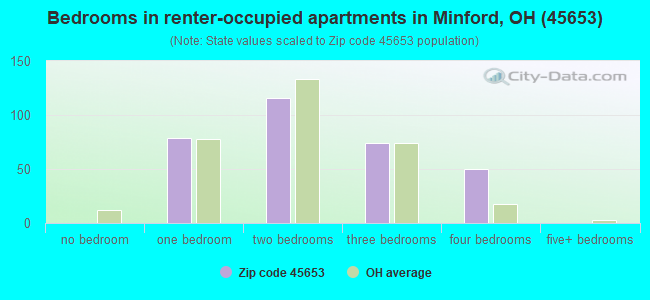
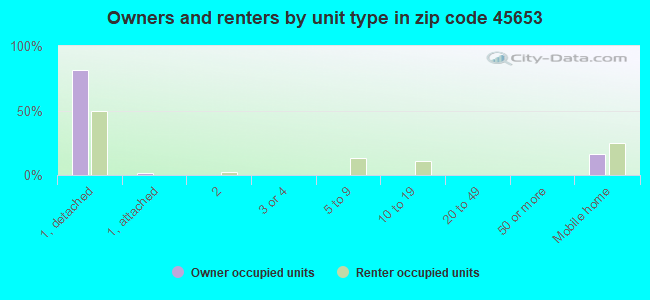
Houses and condos: 1,532 Renter-occupied apartments: 318
% of renters here:
26%
State:
33%
March 2022 cost of living index in zip code 45653: 81.6 (low, U.S. average is 100)
Land area: 46.6 sq. mi. Water area: 0.2 sq. mi.
Population density: 80 people per square mile
(very low).
OSM Map
General Map
Google Map
MSN Map
OSM Map
General Map
Google Map
MSN Map
OSM Map
General Map
Google Map
MSN Map
OSM Map
General Map
Google Map
MSN Map
Please wait while loading the map...
Real estate property taxes paid for housing units in 2022:
This zip code:
1.0% ($1,513)
Ohio:
1.3% ($2,639)
Median real estate property taxes paid for housing units with mortgages in 2022: $1,595 (0.9%) Median real estate property taxes paid for housing units with no mortgage in 2022: $1,255 (1.4%)
Business Search- 14 Million verified businesses
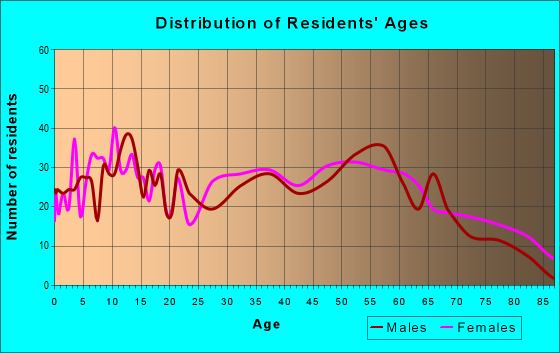
Males: 1,783
(47.7%)
Females: 1,955
(52.3%)
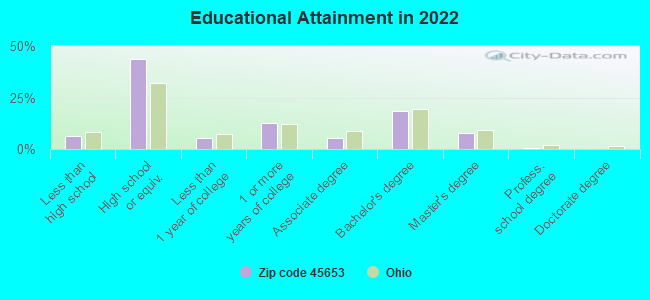
For population 25 years and over in 45653:
High school or higher: 92.8%
Bachelor's degree or higher: 26.4%
Graduate or professional degree: 8.1%
Unemployed: 3.4%
Mean travel time to work (commute): 25.0 minutes
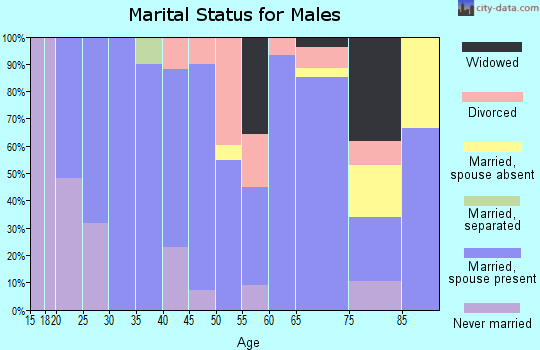
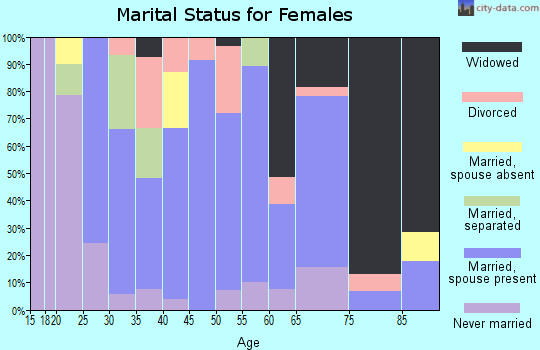
For population 15 years and over in 45653:
Never married: 32.5%
Now married: 52.5%
Separated: 1.5%
Widowed: 9.2%
Divorced: 4.3%
Zip code 45653 compared to state average:
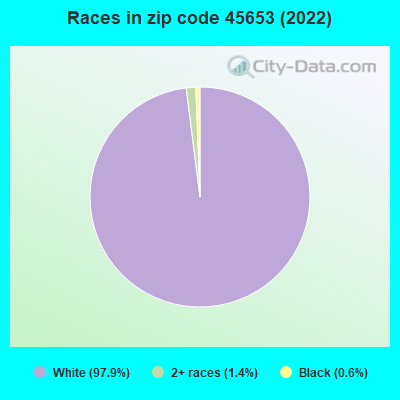
Black race population percentage significantly below state average.
Hispanic race population percentage significantly below state average.
Median age below state average.
Foreign-born population percentage significantly below state average.
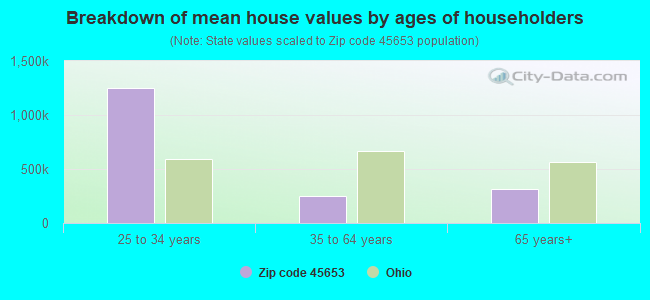
Estimated median house/condo value in 2022: $144,863
45653:
$144,863
Ohio:
$204,100
According to our research of Ohio and other state lists, there were 3 registered sex offenders living in 45653 zip code as of April 26, 2024. The ratio of all residents to sex offenders in zip code 45653 is 1,412 to 1. The ratio of registered sex offenders to all residents in this zip code is much lower than the state average.
Median resident age:
This zip code:
34.7 years
Ohio median age:
39.9 years
Average household size:
This zip code:
3.0 people
Ohio:
2.4 people
Averages for the 2020 tax year for zip code 45653, filed in 2021:
Average Adjusted Gross Income (AGI) in 2020: $56,899 (Individual Income Tax Returns)
Here:
$56,899
State:
$67,288
Salary/wage: $52,633 (reported on 79.4% of returns)
Here:
$52,633
State:
$55,628
(% of AGI for various income ranges: 1091.5% for AGIs below $25k, 3019.4% for AGIs $25k-50k, 6095.0% for AGIs $50k-75k, 9945.4% for AGIs $75k-100k, 13890.5% for AGIs $100k-200k)
Taxable interest for individuals: $984 (reported on 25.3% of returns)
This zip code:
$984
Ohio:
$1,518
(% of AGI for various income ranges: 11.0% for AGIs below $25k, 28.2% for AGIs $25k-50k, 76.0% for AGIs $50k-75k, 42.3% for AGIs $75k-100k, 40.0% for AGIs $100k-200k)
Ordinary dividends: $2,235 (reported on 11.8% of returns)
Here:
$2,235
State:
$7,167
(% of AGI for various income ranges: 6.8% for AGIs below $25k, 19.4% for AGIs $25k-50k, 51.0% for AGIs $50k-75k, 46.9% for AGIs $75k-100k, 100.5% for AGIs $100k-200k)
Net capital gain/loss in AGI: +$5,550 (reported on 10.6% of returns)
Here:
+$5,550
State:
+$18,919
(% of AGI for various income ranges: 7.5% for AGIs below $25k, 19.1% for AGIs $25k-50k, 13.0% for AGIs $50k-75k, 33.8% for AGIs $75k-100k, 438.9% for AGIs $100k-200k)
Profit/loss from business: +$9,355 (reported on 12.9% of returns)
Here:
+$9,355
State:
+$13,744
(% of AGI for various income ranges: 130.5% for AGIs below $25k, 112.4% for AGIs $25k-50k, 84.0% for AGIs $50k-75k, 252.3% for AGIs $75k-100k, 346.3% for AGIs $100k-200k)
Taxable individual retirement arrangement distribution: $13,458 (reported on 7.1% of returns)
45653:
$13,458
Ohio:
$18,876
(% of AGI for various income ranges: 35.0% for AGIs below $25k, 49.1% for AGIs $25k-50k, 302.5% for AGIs $50k-75k, 370.0% for AGIs $100k-200k)
Total itemized deductions: $25,100 (reported on 3.5% of returns)
Here:
$25,100
State:
$33,869
(% of AGI for various income ranges: 174.1% for AGIs $25k-50k, 481.1% for AGIs $100k-200k)
Charity contributions: $9,475 (reported on 2.4% of returns)
Here:
$9,475
State:
$14,577
(% of AGI for various income ranges: 199.5% for AGIs $100k-200k)
Taxes paid: $5,050 (reported on 3.5% of returns)
45653:
$5,050
State:
$7,681
(% of AGI for various income ranges: 30.0% for AGIs $25k-50k, 105.8% for AGIs $100k-200k)
Earned income credit: $2,621 (reported on 17.1% of returns)
Here:
$2,621
State:
$2,304
(% of AGI for various income ranges: 116.0% for AGIs below $25k, 87.1% for AGIs $25k-50k)
Percentage of individuals using paid preparers for their 2020 taxes: 94.7%
Here:
95%
State:
94%
(% for various income ranges: 94.3% for AGIs below $25k, 95.1% for AGIs $25k-50k, 92.9% for AGIs $50k-75k, 94.7% for AGIs $75k-100k, 96.2% for AGIs $100k-200k, 100.0% for AGIs over 200k)
Averages for the 2012 tax year for zip code 45653, filed in 2013:
Average Adjusted Gross Income (AGI) in 2012: $48,763 (Individual Income Tax Returns)
Here:
$48,763
State:
$54,926
Salary/wage: $42,727 (reported on 82.6% of returns)
Here:
$42,727
State:
$45,869
(% of AGI for various income ranges: 67.3% for AGIs below $25k, 69.8% for AGIs $25k-50k, 76.6% for AGIs $50k-75k, 76.7% for AGIs $75k-100k, 70.4% for AGIs $100k-200k)
Taxable interest for individuals: $744 (reported on 31.0% of returns)
This zip code:
$744
Ohio:
$1,297
(% of AGI for various income ranges: 0.9% for AGIs below $25k, 0.6% for AGIs $25k-50k, 0.7% for AGIs $50k-75k, 0.4% for AGIs $75k-100k, 0.2% for AGIs $100k-200k)
Ordinary dividends: $1,406 (reported on 11.6% of returns)
Here:
$1,406
State:
$5,821
(% of AGI for various income ranges: 0.2% for AGIs below $25k, 0.4% for AGIs $25k-50k, 0.3% for AGIs $50k-75k, 0.5% for AGIs $75k-100k, 0.2% for AGIs $100k-200k)
Net capital gain/loss in AGI: +$2,183 (reported on 7.7% of returns)
Here:
+$2,183
State:
+$11,232
(% of AGI for various income ranges: 0.9% for AGIs $25k-50k, 0.6% for AGIs $100k-200k)
Profit/loss from business: +$6,992 (reported on 16.1% of returns)
Here:
+$6,992
State:
+$12,773
(% of AGI for various income ranges: 10.9% for AGIs below $25k, 2.3% for AGIs $25k-50k, 0.6% for AGIs $50k-75k, 3.2% for AGIs $75k-100k, 0.5% for AGIs $100k-200k)
Taxable individual retirement arrangement distribution: $14,220 (reported on 6.5% of returns)
45653:
$14,220
Ohio:
$14,511
(% of AGI for various income ranges: 1.4% for AGIs below $25k, 2.2% for AGIs $25k-50k, 3.0% for AGIs $50k-75k, 2.2% for AGIs $100k-200k)
Total itemized deductions: $18,025 (19% of AGI, reported on 23.2% of returns)
Here:
$18,025
State:
$21,278
Here:
19.2% of AGI
State:
18.8% of AGI
(% of AGI for various income ranges: 4.0% for AGIs below $25k, 6.7% for AGIs $25k-50k, 8.4% for AGIs $50k-75k, 7.5% for AGIs $75k-100k, 11.6% for AGIs $100k-200k)
Charity contributions: $4,044 (reported on 16.1% of returns)
Here:
$4,044
State:
$3,943
(% of AGI for various income ranges: 0.9% for AGIs $25k-50k, 0.9% for AGIs $50k-75k, 1.1% for AGIs $75k-100k, 2.4% for AGIs $100k-200k)
Taxes paid: $5,831 (reported on 23.2% of returns)
45653:
$5,831
State:
$9,568
(% of AGI for various income ranges: 0.5% for AGIs below $25k, 1.4% for AGIs $25k-50k, 1.9% for AGIs $50k-75k, 2.3% for AGIs $75k-100k, 5.0% for AGIs $100k-200k)
Earned income credit: $2,370 (reported on 21.3% of returns)
Here:
$2,370
State:
$2,285
(% of AGI for various income ranges: 8.9% for AGIs below $25k, 1.1% for AGIs $25k-50k)
Percentage of individuals using paid preparers for their 2012 taxes: 56.1%
Here:
56%
State:
51%
(% for various income ranges: 51.7% for AGIs below $25k, 60.0% for AGIs $25k-50k, 62.5% for AGIs $50k-75k, 50.0% for AGIs $75k-100k, 58.8% for AGIs $100k-200k)
Averages for the 2004 tax year for zip code 45653, filed in 2005:
Average Adjusted Gross Income (AGI) in 2004: $35,310 (Individual Income Tax Returns)
Here:
$35,310
State:
$44,480
Salary/wage: $33,595 (reported on 85.7% of returns)
Here:
$33,595
State:
$39,198
(% of AGI for various income ranges: 105.1% for AGIs below $10k, 74.6% for AGIs $10k-25k, 82.3% for AGIs $25k-50k, 87.9% for AGIs $50k-75k, 89.6% for AGIs $75k-100k, 60.6% for AGIs over 100k)
Taxable interest for individuals: $963 (reported on 37.1% of returns)
This zip code:
$963
Ohio:
$1,532
(% of AGI for various income ranges: 5.1% for AGIs below $10k, 1.6% for AGIs $10k-25k, 1.4% for AGIs $25k-50k, 0.7% for AGIs $50k-75k, 0.4% for AGIs $75k-100k, 0.4% for AGIs over 100k)
Taxable dividends: $1,044 (reported on 14.1% of returns)
Here:
$1,044
State:
$3,496
(% of AGI for various income ranges: 0.9% for AGIs below $10k, 0.6% for AGIs $10k-25k, 0.4% for AGIs $25k-50k, 0.2% for AGIs $50k-75k, 0.1% for AGIs $75k-100k, 1.1% for AGIs over 100k)
Net capital gain/loss: +$2,012 (reported on 10.1% of returns)
Here:
+$2,012
State:
+$8,582
(% of AGI for various income ranges: 0.5% for AGIs below $10k, 1.0% for AGIs $10k-25k, 0.0% for AGIs $25k-50k, 0.4% for AGIs $50k-75k, 2.5% for AGIs over 100k)
Profit/loss from business: +$4,363 (reported on 14.7% of returns)
Here:
+$4,363
State:
+$10,813
(% of AGI for various income ranges: 11.6% for AGIs below $10k, 4.8% for AGIs $10k-25k, 0.4% for AGIs $25k-50k, 2.9% for AGIs $50k-75k, -0.1% for AGIs $75k-100k, 0.9% for AGIs over 100k)
IRA payment deduction: $2,440 (reported on 1.6% of returns)
45653:
$2,440
Ohio:
$2,794
Total itemized deductions: $14,732 (24% of AGI, reported on 23.6% of returns)
Here:
$14,732
State:
$17,503
Here:
23.6% of AGI
State:
20.8% of AGI
(% of AGI for various income ranges: 7.3% for AGIs $10k-25k, 9.0% for AGIs $25k-50k, 11.6% for AGIs $50k-75k, 10.6% for AGIs $75k-100k, 11.6% for AGIs over 100k)
Charity contributions deductions: $2,795 (4% of AGI, reported on 18.4% of returns)
Here:
$2,795
State:
$3,087
Here:
4.2% of AGI
State:
3.4% of AGI
(% of AGI for various income ranges: 0.5% for AGIs $10k-25k, 1.4% for AGIs $25k-50k, 1.6% for AGIs $50k-75k, 1.4% for AGIs $75k-100k, 2.6% for AGIs over 100k)
Total tax: $4,185 (reported on 71.0% of returns)
45653:
$4,185
State:
$6,781
(% of AGI for various income ranges: 2.6% for AGIs below $10k, 3.7% for AGIs $10k-25k, 6.0% for AGIs $25k-50k, 8.5% for AGIs $50k-75k, 10.8% for AGIs $75k-100k, 16.5% for AGIs over 100k)
Earned income credit: $1,981 (reported on 19.9% of returns)
Here:
$1,981
State:
$1,696
Percentage of individuals using paid preparers for their 2004 taxes: 55.2%
Here:
55%
State:
55%
(% for various income ranges: 46.8% for AGIs below $10k, 57.1% for AGIs $10k-25k, 57.4% for AGIs $25k-50k, 58.3% for AGIs $50k-75k, 46.7% for AGIs $75k-100k, 71.2% for AGIs over 100k)
Household received Food Stamps/SNAP in the past 12 months: 363 Household did not receive Food Stamps/SNAP in the past 12 months: 868
Women who had a birth in the past 12 months: 99 (38 now married, 59 unmarried) Women who did not have a birth in the past 12 months: 929 (394 now married, 534 unmarried)
Housing units in zip code 45653 with a mortgage: 398 (15 second mortgage, 15 both second mortgage and home equity loan) Median monthly owner costs for units with a mortgage: $1,265 Median monthly owner costs for units without a mortgage: $545
Residents with income below the poverty level in 2022:
This zip code:
21.8%
Whole state:
13.4%
Residents with income below 50% of the poverty level in 2022:
This zip code:
11.6%
Whole state:
7.0%
Median number of rooms in houses and condos:
Here:
5.8
State:
6.7
Median number of rooms in apartments:
Here:
4.9
State:
4.4
Notable locations in this zip code not listed on our city pages
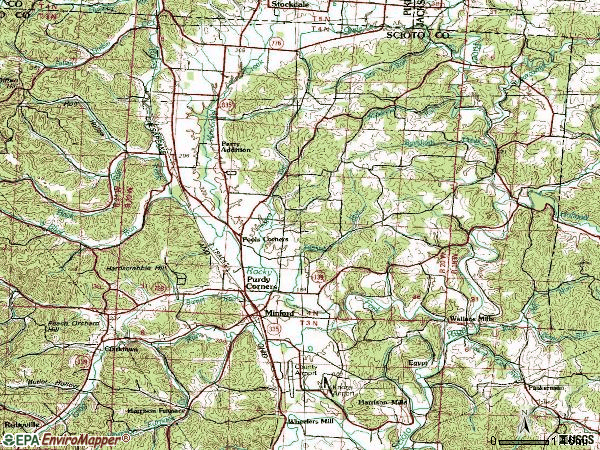
Notable locations in zip code 45653: Pools Corners (A), Minford Emergency Ambulance Service (B), Minford Fire Department (C). Display/hide their locations on the map
Churches in zip code 45653 include: Hamilton Church (A), Madison Missionary Church (B), Mount Carmel Church (C), Salem Church (D), Grace Church (E), White Gravel Church (F), Harrison Church (G), Tri-Township Tabernacle (H), Rivers of Joy Baptist Church (I). Display/hide their locations on the map
Cemeteries: White Gravel Cemetery (1), White Cemetery (2), Titus Cemetery (3), Squire Cemetery (4), Shuter Cemetery (5), Rogers Cemetery (6), Old Bennett Cemetery (7). Display/hide their locations on the map
Streams, rivers, and creeks: Millstone Run (A), Glade Run (B), Dry Run (C), Buckhorn Creek (D), Sugarcamp Creek (E), McConnel Creek (F), Sweet Run (G), Yankee Run (H), Rocky Fork (I). Display/hide their locations on the map
In group quarters: 36 (-1 institutionalized population)
Size of family households: 239 2-persons, 303 3-persons, 182 4-persons, 112 5-persons, 87 6-persons
Size of nonfamily households: 255 1-person, 32 2-persons
825 married couples with children.
304 single-parent households (304 women).
97.5% of residents of 45653 zip code speak English at home.
1.9% of residents speak Spanish at home (100% very well).
Foreign born population: 0 (0.0%)
:
0.0%
Whole state:
5.0%
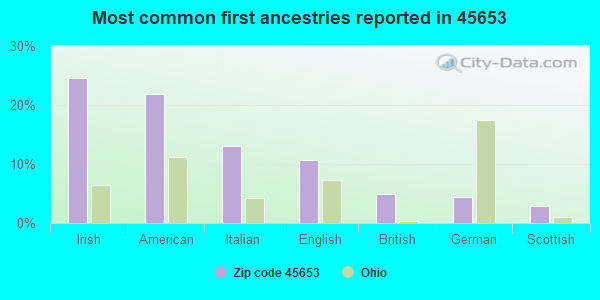
25%Irish
22%American
13%Italian
11%English
5%British
4%German
3%Scottish
Facilities with environmental interests located in this zip code:
BENNETTS BODY SHOP (RR 1 BOX 579 in MINFORD, OH)
STATE MASTER (Ohio general info) - RCRA-OHD987006970, HAZARDOUS WASTE PROGRAM Small Quantity Generators, between 100 kg and 1000 kg of hazardous waste/month (Resource Conservation and Recovery Act (tracking hazardous waste)) - notification Organizations: GAMPP JOHN (CONTACT/OWNER)
Housing units lacking complete plumbing facilities: 2.4%
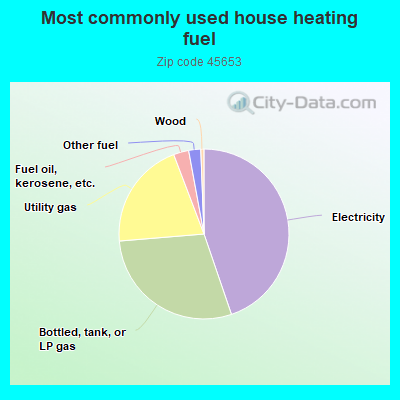
44.9%Electricity
29.0%Bottled, tank, or LP gas
20.6%Utility gas
2.9%Fuel oil, kerosene, etc.
2.3%Other fuel
0.6%Wood
Population in 1990: 3,969. Population change in the 1990s: +194 (+4.9%).
Place of birth for U.S.-born residents:
This state: 3,222
Midwest: 75
South: 385
West: 44
76% of the 45653 zip code residents lived in the same house 5 years ago. Out of people who lived in different houses, 72% lived in this county. Out of people who lived in different counties, 50% lived in Ohio.
86% of the 45653 zip code residents lived in the same house 1 year ago. Out of people who lived in different houses, 45% moved from this county. Out of people who lived in different houses, 38% moved from different county within same state. Out of people who lived in different houses, 12% moved from different state. Out of people who lived in different houses, 3% moved from abroad.
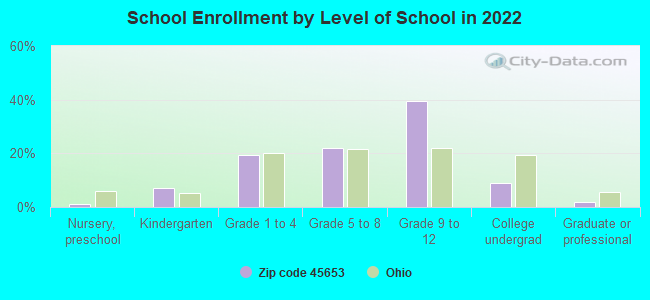
Private vs. public school enrollment:
Students in private schools in grades 1 to 8 (elementary and middle school): 98
Here:
23.7%
Ohio:
16.0%
Students in private schools in grades 9 to 12 (high school):
Here:
0.0%
Ohio:
13.1%
Students in private undergraduate colleges: 40
Here:
46.1%
Ohio:
22.3%
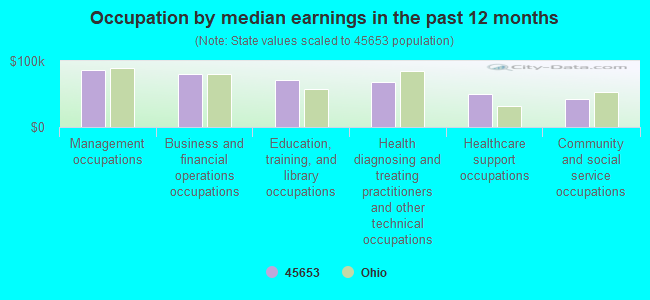
Occupation by median earnings in the past 12 months ($)
86,169Management occupations
80,264Business and financial operations occupations
70,478Education, training, and library occupations
68,626Health diagnosing and treating practitioners and other technical occupations
49,805Healthcare support occupations
42,946Community and social service occupations
Companies with federal contracts located in this zip code:
FANNIN, KYLE (1157 GLADES RD in MINFORD, OH; small business) : $25,550 in 4 contractsin 2005
$12,775 with Army for Construction of Structures and Facilities -- Other Non-Building Facilities. Taking place in KY. Signed on 2005-08-18. Completion date: 2005-08-31.
$12,775 with U.S. Army Corps of Engineers - civil program financing only for Construction of Structures and Facilities -- Other Non-Building Facilities. Taking place in KY. Signed on 2005-08-18. Completion date: 2005-08-31.
$9,875 with Army for Construction of Structures and Facilities -- Other Non-Building Facilities. Signed on 2005-11-07. Completion date: 2005-11-18.
-$9,875, same as above.Signed on 2005-11-29. Completion date: 2005-11-18.
Top industries in this zip code by the number of employees in 2005:
Health Care and Social Assistance: Ambulance Services (10-19: 1)
People in group quarters in 2010:
66 people in nursing facilities/skilled-nursing facilities
People in group quarters in 2000:
68 people in other noninstitutional group quarters
Fatal accident statistics in 2012:
Fatal accident count: 1
Vehicles involved in fatal accidents: 2
Fatal accidents caused by drunken drivers: 0
Fatalities: 1
Persons involved in fatal accidents: 3
Pedestrians involved in fatal accidents: 0
2002 - 2018 National Fire Incident Reporting System (NFIRS) incidents
According to the data from the years 2002 - 2018 the average number of fire incidents per year is 37. The highest number of fires - 78 took place in 2006, and the least - 7 in 2002. The data has a rising trend.
When looking into fire subcategories, the most reports belonged to: Outside Fires (42.8%), and Structure Fires (39.4%).
Fire incident types reported to NFIRS in Zip Code 45653


 Nearest zip codes: 45662, 45613, 45694, 45682, 45648, 45640.


 According to the data from the years 2002 - 2018 the average number of fire incidents per year is 37. The highest number of fires - 78 took place in 2006, and the least - 7 in 2002. The data has a rising trend.
 When looking into fire subcategories, the most reports belonged to: Outside Fires (42.8%), and Structure Fires (39.4%).