Estimated zip code population in 2022: 3,329 Zip code population in 2010: 3,014 Zip code population in 2000: 3,217
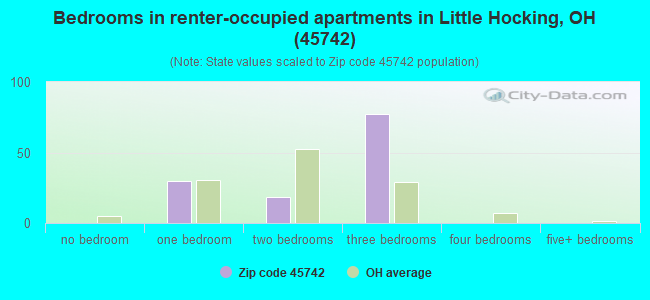
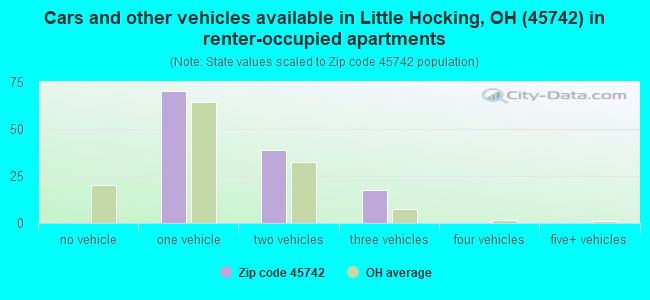
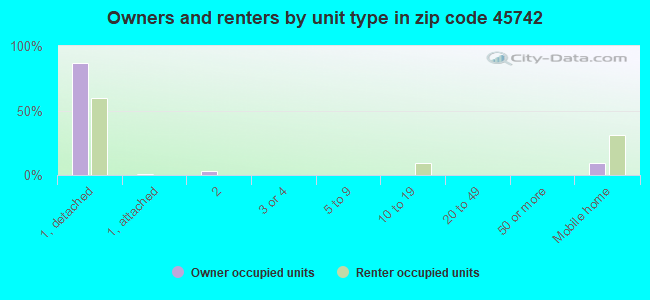
Houses and condos: 1,331 Renter-occupied apartments: 126
% of renters here:
10%
State:
33%
March 2022 cost of living index in zip code 45742: 84.1 (less than average, U.S. average is 100)
Land area: 27.0 sq. mi. Water area: 0.5 sq. mi.
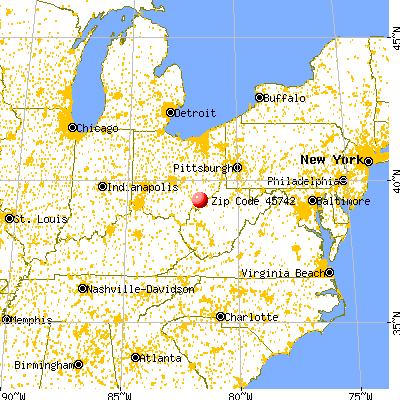
Population density: 123 people per square mile
(very low).
OSM Map
General Map
Google Map
MSN Map
OSM Map
General Map
Google Map
MSN Map
OSM Map
General Map
Google Map
MSN Map
OSM Map
General Map
Google Map
MSN Map
Please wait while loading the map...
Real estate property taxes paid for housing units in 2022:
This zip code:
0.9% ($1,502)
Ohio:
1.3% ($2,639)
Median real estate property taxes paid for housing units with mortgages in 2022: $1,494 (0.8%) Median real estate property taxes paid for housing units with no mortgage in 2022: $1,527 (1.0%)
Business Search- 14 Million verified businesses
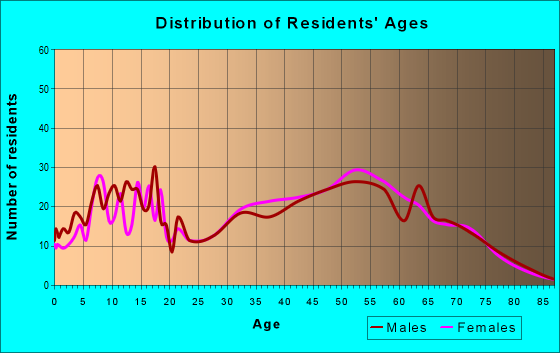
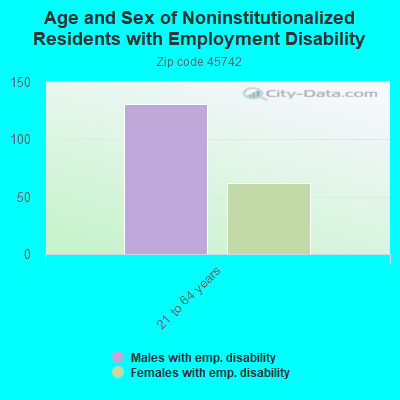
Males: 1,705
(51.2%)
Females: 1,624
(48.8%)
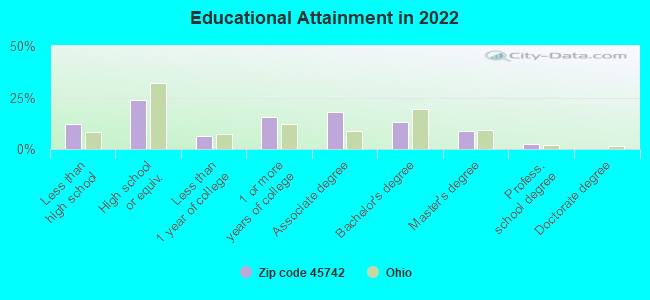
For population 25 years and over in 45742:
High school or higher: 86.3%
Bachelor's degree or higher: 24.2%
Graduate or professional degree: 11.2%
Unemployed: 7.2%
Mean travel time to work (commute): 28.2 minutes
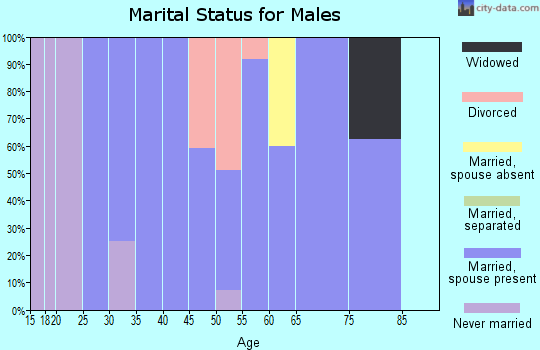
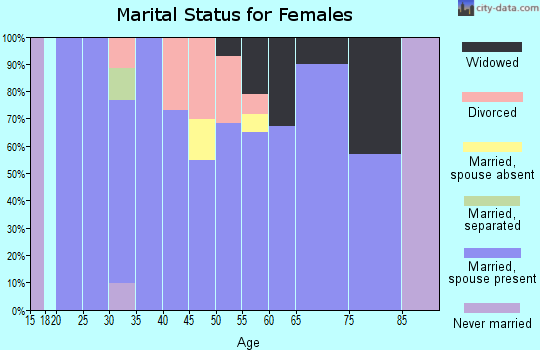
For population 15 years and over in 45742:
Never married: 22.0%
Now married: 64.8%
Separated: 3.3%
Widowed: 2.2%
Divorced: 7.7%
Zip code 45742 compared to state average:
Unemployed percentage above state average.
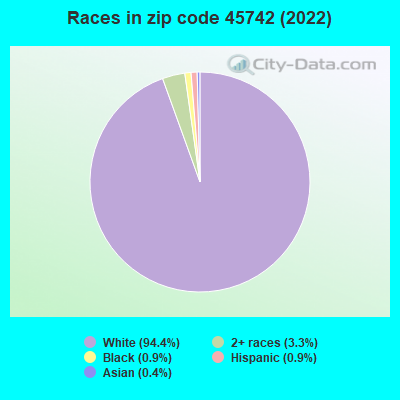
Black race population percentage significantly below state average.
Hispanic race population percentage significantly below state average.
Median age above state average.
Foreign-born population percentage significantly below state average.
Renting percentage significantly below state average.
Length of stay since moving in significantly above state average.
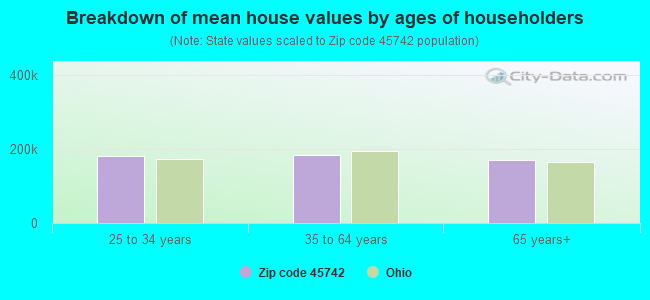
Estimated median house/condo value in 2022: $173,702
45742:
$173,702
Ohio:
$204,100
According to our research of Ohio and other state lists, there were 3 registered sex offenders living in 45742 zip code as of April 27, 2024. The ratio of all residents to sex offenders in zip code 45742 is 958 to 1. The ratio of registered sex offenders to all residents in this zip code is lower than the state average.
Median resident age:
This zip code:
45.2 years
Ohio median age:
39.9 years
Average household size:
This zip code:
2.7 people
Ohio:
2.4 people
Averages for the 2020 tax year for zip code 45742, filed in 2021:
Average Adjusted Gross Income (AGI) in 2020: $60,803 (Individual Income Tax Returns)
Here:
$60,803
State:
$67,288
Salary/wage: $54,019 (reported on 80.7% of returns)
Here:
$54,019
State:
$55,628
(% of AGI for various income ranges: 1183.8% for AGIs below $25k, 3098.6% for AGIs $25k-50k, 5683.5% for AGIs $50k-75k, 8484.7% for AGIs $75k-100k, 16395.6% for AGIs $100k-200k)
Taxable interest for individuals: $709 (reported on 32.1% of returns)
This zip code:
$709
Ohio:
$1,518
(% of AGI for various income ranges: 6.6% for AGIs below $25k, 14.8% for AGIs $25k-50k, 27.1% for AGIs $50k-75k, 34.0% for AGIs $75k-100k, 51.2% for AGIs $100k-200k)
Ordinary dividends: $3,414 (reported on 15.0% of returns)
Here:
$3,414
State:
$7,167
(% of AGI for various income ranges: 23.8% for AGIs $25k-50k, 97.1% for AGIs $50k-75k, 45.3% for AGIs $75k-100k, 259.4% for AGIs $100k-200k)
Net capital gain/loss in AGI: +$6,622 (reported on 12.9% of returns)
Here:
+$6,622
State:
+$18,919
(% of AGI for various income ranges: 10.7% for AGIs $25k-50k, 24.7% for AGIs $50k-75k, 116.0% for AGIs $75k-100k, 590.6% for AGIs $100k-200k)
Profit/loss from business: +$8,228 (reported on 12.9% of returns)
Here:
+$8,228
State:
+$13,744
(% of AGI for various income ranges: 51.0% for AGIs below $25k, 140.0% for AGIs $25k-50k, 104.1% for AGIs $50k-75k, 296.0% for AGIs $75k-100k, 191.2% for AGIs $100k-200k)
Taxable individual retirement arrangement distribution: $16,012 (reported on 11.4% of returns)
45742:
$16,012
Ohio:
$18,876
(% of AGI for various income ranges: 63.1% for AGIs below $25k, 176.9% for AGIs $25k-50k, 152.4% for AGIs $50k-75k, 260.7% for AGIs $75k-100k, 760.0% for AGIs $100k-200k)
Total itemized deductions: $25,775 (reported on 2.9% of returns)
Here:
$25,775
State:
$33,869
(% of AGI for various income ranges: 644.4% for AGIs $100k-200k)
Charity contributions: $9,533 (reported on 2.1% of returns)
Here:
$9,533
State:
$14,577
(% of AGI for various income ranges: 190.7% for AGIs $75k-100k)
Taxes paid: $5,525 (reported on 2.9% of returns)
45742:
$5,525
State:
$7,681
(% of AGI for various income ranges: 147.3% for AGIs $75k-100k)
Earned income credit: $2,000 (reported on 12.1% of returns)
Here:
$2,000
State:
$2,304
(% of AGI for various income ranges: 71.0% for AGIs below $25k, 46.2% for AGIs $25k-50k)
Percentage of individuals using paid preparers for their 2020 taxes: 93.6%
Here:
94%
State:
94%
(% for various income ranges: 92.3% for AGIs below $25k, 97.1% for AGIs $25k-50k, 90.9% for AGIs $50k-75k, 94.7% for AGIs $75k-100k, 91.3% for AGIs $100k-200k, 100.0% for AGIs over 200k)
Averages for the 2012 tax year for zip code 45742, filed in 2013:
Average Adjusted Gross Income (AGI) in 2012: $52,050 (Individual Income Tax Returns)
Here:
$52,050
State:
$54,926
Salary/wage: $43,645 (reported on 84.7% of returns)
Here:
$43,645
State:
$45,869
(% of AGI for various income ranges: 71.3% for AGIs below $25k, 72.7% for AGIs $25k-50k, 72.2% for AGIs $50k-75k, 81.3% for AGIs $75k-100k, 63.1% for AGIs $100k-200k)
Taxable interest for individuals: $898 (reported on 32.1% of returns)
This zip code:
$898
Ohio:
$1,297
(% of AGI for various income ranges: 0.6% for AGIs below $25k, 0.5% for AGIs $25k-50k, 0.5% for AGIs $50k-75k, 0.3% for AGIs $75k-100k, 0.8% for AGIs $100k-200k)
Ordinary dividends: $2,330 (reported on 14.6% of returns)
Here:
$2,330
State:
$5,821
(% of AGI for various income ranges: 0.8% for AGIs below $25k, 0.4% for AGIs $25k-50k, 0.5% for AGIs $50k-75k, 0.4% for AGIs $75k-100k, 1.0% for AGIs $100k-200k)
Net capital gain/loss in AGI: +$1,233 (reported on 8.8% of returns)
Here:
+$1,233
State:
+$11,232
(% of AGI for various income ranges: 0.2% for AGIs $50k-75k, 0.5% for AGIs $100k-200k)
Profit/loss from business: +$9,405 (reported on 13.9% of returns)
Here:
+$9,405
State:
+$12,773
(% of AGI for various income ranges: 5.5% for AGIs below $25k, 3.7% for AGIs $25k-50k, 1.7% for AGIs $50k-75k, 2.8% for AGIs $75k-100k, 1.5% for AGIs $100k-200k)
Taxable individual retirement arrangement distribution: $13,153 (reported on 12.4% of returns)
45742:
$13,153
Ohio:
$14,511
(% of AGI for various income ranges: 2.5% for AGIs below $25k, 2.7% for AGIs $25k-50k, 6.4% for AGIs $50k-75k, 3.3% for AGIs $100k-200k)
Total itemized deductions: $19,657 (19% of AGI, reported on 21.9% of returns)
Here:
$19,657
State:
$21,278
Here:
19.1% of AGI
State:
18.8% of AGI
(% of AGI for various income ranges: 9.2% for AGIs $25k-50k, 7.5% for AGIs $50k-75k, 8.2% for AGIs $75k-100k, 10.5% for AGIs $100k-200k)
Charity contributions: $4,041 (reported on 16.1% of returns)
Here:
$4,041
State:
$3,943
(% of AGI for various income ranges: 1.0% for AGIs $25k-50k, 1.0% for AGIs $50k-75k, 1.0% for AGIs $75k-100k, 2.0% for AGIs $100k-200k)
Taxes paid: $5,443 (reported on 21.9% of returns)
45742:
$5,443
State:
$9,568
(% of AGI for various income ranges: 1.3% for AGIs $25k-50k, 1.5% for AGIs $50k-75k, 2.3% for AGIs $75k-100k, 3.8% for AGIs $100k-200k)
Earned income credit: $1,890 (reported on 14.6% of returns)
Here:
$1,890
State:
$2,285
(% of AGI for various income ranges: 4.4% for AGIs below $25k, 1.0% for AGIs $25k-50k)
Percentage of individuals using paid preparers for their 2012 taxes: 46.0%
Here:
46%
State:
51%
(% for various income ranges: 36.7% for AGIs below $25k, 50.0% for AGIs $25k-50k, 48.0% for AGIs $50k-75k, 52.9% for AGIs $75k-100k, 57.1% for AGIs $100k-200k)
Averages for the 2004 tax year for zip code 45742, filed in 2005:
Average Adjusted Gross Income (AGI) in 2004: $38,655 (Individual Income Tax Returns)
Here:
$38,655
State:
$44,480
Salary/wage: $35,217 (reported on 87.1% of returns)
Here:
$35,217
State:
$39,198
(% of AGI for various income ranges: 98.1% for AGIs below $10k, 70.5% for AGIs $10k-25k, 79.0% for AGIs $25k-50k, 86.2% for AGIs $50k-75k, 85.8% for AGIs $75k-100k, 65.0% for AGIs over 100k)
Taxable interest for individuals: $949 (reported on 44.4% of returns)
This zip code:
$949
Ohio:
$1,532
(% of AGI for various income ranges: 2.9% for AGIs below $10k, 2.2% for AGIs $10k-25k, 1.1% for AGIs $25k-50k, 0.8% for AGIs $50k-75k, 0.5% for AGIs $75k-100k, 1.4% for AGIs over 100k)
Taxable dividends: $1,267 (reported on 15.8% of returns)
Here:
$1,267
State:
$3,496
(% of AGI for various income ranges: 0.9% for AGIs below $10k, 0.7% for AGIs $10k-25k, 0.5% for AGIs $25k-50k, 0.3% for AGIs $50k-75k, 0.4% for AGIs $75k-100k, 0.8% for AGIs over 100k)
Net capital gain/loss: +$1,167 (reported on 12.6% of returns)
Here:
+$1,167
State:
+$8,582
(% of AGI for various income ranges: -1.5% for AGIs below $10k, -0.4% for AGIs $10k-25k, 0.4% for AGIs $25k-50k, 0.0% for AGIs $50k-75k, 0.1% for AGIs $75k-100k, 2.0% for AGIs over 100k)
Profit/loss from business: +$6,702 (reported on 13.4% of returns)
Here:
+$6,702
State:
+$10,813
(% of AGI for various income ranges: -7.1% for AGIs below $10k, 5.5% for AGIs $10k-25k, 2.2% for AGIs $25k-50k, 1.4% for AGIs $50k-75k, 1.1% for AGIs $75k-100k, 4.6% for AGIs over 100k)
IRA payment deduction: $2,441 (reported on 2.6% of returns)
45742:
$2,441
Ohio:
$2,794
Total itemized deductions: $14,769 (22% of AGI, reported on 24.1% of returns)
Here:
$14,769
State:
$17,503
Here:
21.5% of AGI
State:
20.8% of AGI
(% of AGI for various income ranges: 6.0% for AGIs $10k-25k, 7.5% for AGIs $25k-50k, 9.6% for AGIs $50k-75k, 11.5% for AGIs $75k-100k, 12.1% for AGIs over 100k)
Charity contributions deductions: $2,899 (4% of AGI, reported on 18.6% of returns)
Here:
$2,899
State:
$3,087
Here:
4.0% of AGI
State:
3.4% of AGI
(% of AGI for various income ranges: 1.0% for AGIs $10k-25k, 0.9% for AGIs $25k-50k, 1.3% for AGIs $50k-75k, 2.1% for AGIs $75k-100k, 2.1% for AGIs over 100k)
Total tax: $4,657 (reported on 74.9% of returns)
45742:
$4,657
State:
$6,781
(% of AGI for various income ranges: 2.6% for AGIs below $10k, 3.7% for AGIs $10k-25k, 6.3% for AGIs $25k-50k, 8.6% for AGIs $50k-75k, 10.8% for AGIs $75k-100k, 16.8% for AGIs over 100k)
Earned income credit: $1,764 (reported on 14.7% of returns)
Here:
$1,764
State:
$1,696
Percentage of individuals using paid preparers for their 2004 taxes: 47.5%
Here:
48%
State:
55%
(% for various income ranges: 34.0% for AGIs below $10k, 49.1% for AGIs $10k-25k, 50.1% for AGIs $25k-50k, 48.7% for AGIs $50k-75k, 48.5% for AGIs $75k-100k, 74.1% for AGIs over 100k)
Household received Food Stamps/SNAP in the past 12 months: 127 Household did not receive Food Stamps/SNAP in the past 12 months: 1,119
Women who had a birth in the past 12 months: 49 (16 now married, 32 unmarried) Women who did not have a birth in the past 12 months: 563 (360 now married, 202 unmarried)
Housing units in zip code 45742 with a mortgage: 536 (42 second mortgage, 43 both second mortgage and home equity loan) Houses without a mortgage: 73
Median monthly owner costs for units with a mortgage: $1,113 Median monthly owner costs for units without a mortgage: $476
Residents with income below the poverty level in 2022:
This zip code:
7.9%
Whole state:
13.4%
Residents with income below 50% of the poverty level in 2022:
This zip code:
2.2%
Whole state:
7.0%
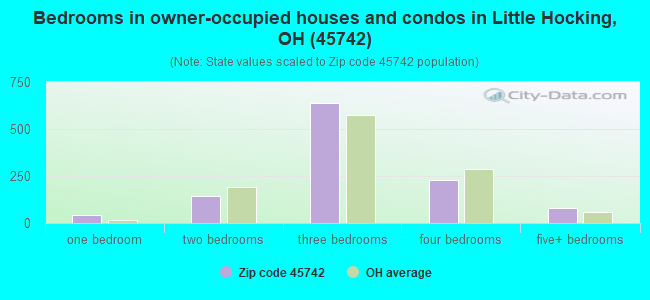
Median number of rooms in houses and condos:
Here:
6.5
State:
6.7
Median number of rooms in apartments:
Here:
4.9
State:
4.4
Notable locations in this zip code not listed on our city pages
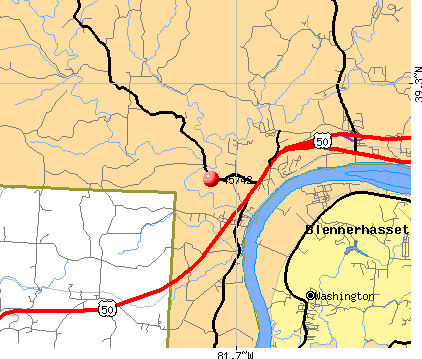
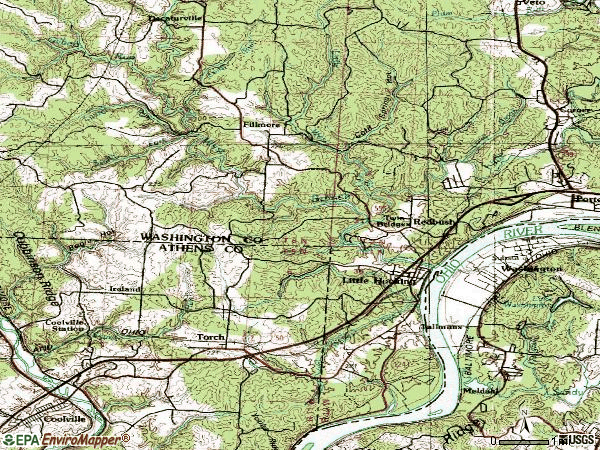
Notable locations in zip code 45742: Twin Bridges (A), Oakes Landing (B), Curtis Landing (C), Little Hocking Fire Department (D). Display/hide their locations on the map
Cemeteries: Decatur Methodist Episcopal Cemetery (1), Decatur Presbyterian Cemetery (2), Little Hocking Cemetery (3), Old Decatur Chapel Cemetery (4), Newberry Cemetery (5), Quaker Cemetery (6), Saint Marys Cemetery (7). Display/hide their locations on the map
Streams, rivers, and creeks: Grass Run (A), Gilbert Run (B), Long Brook (C), Big Run (D), Little Hocking River (E), Whites Run (F), Sawyer Run (G), Longs Run (H), Short Brook (I). Display/hide their locations on the map
Size of family households: 507 2-persons, 109 3-persons, 151 4-persons, 99 5-persons, 83 6-persons
Size of nonfamily households: 248 1-person, 44 2-persons
358 married couples with children.
76 single-parent households (30 men, 46 women).
99.2% of residents of 45742 zip code speak English at home.
0.6% of residents speak other Indo-European language at home (100% very well).
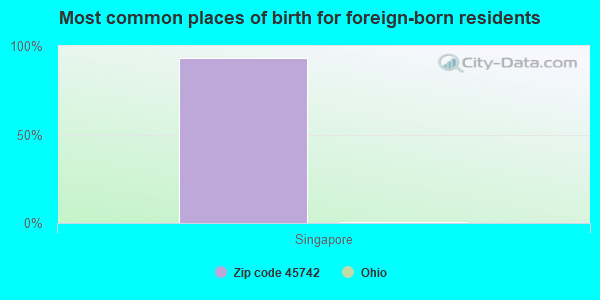
Foreign born population: 15 (0.5%) (100.0% of them are naturalized citizens)
This zip code:
0.5%
Whole state:
5.0%
93%Singapore
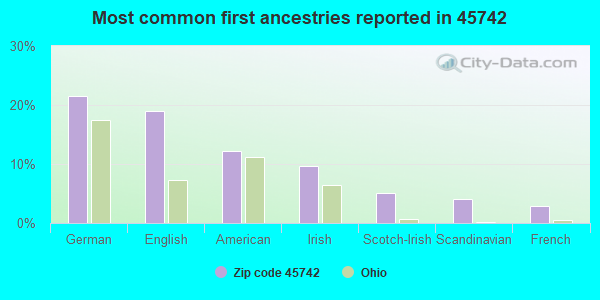
22%German
19%English
12%American
10%Irish
5%Scotch-Irish
4%Scandinavian
3%French
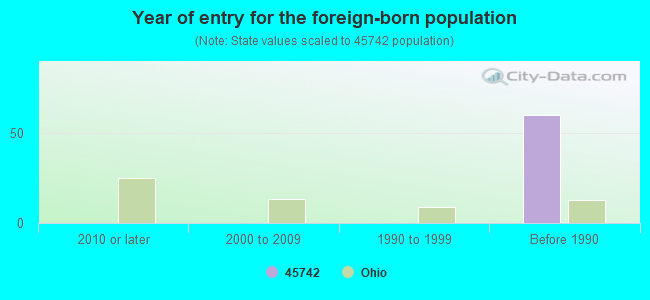
Year of entry for the foreign-born population
02010 or later
02000 to 2009
01990 to 1999
60Before 1990
Facilities with environmental interests located in this zip code:
ALLTEL - PORTERFILED (ROUTE 2, BOX 170 in LITTLE HOCKING, OH)
(Integrated Compliance Information System) - ICIS-HQ-2000-6004, FORMAL ENFORCEMENT ACTION
Housing units lacking complete kitchen facilities: 2.2%
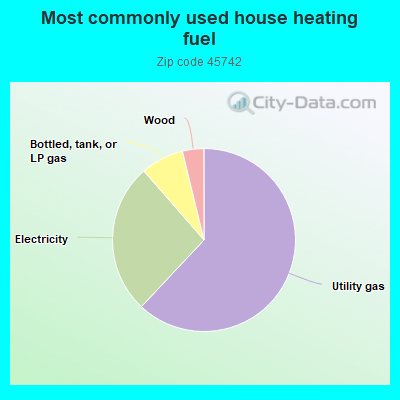
62.0%Utility gas
26.6%Electricity
7.6%Bottled, tank, or LP gas
3.8%Wood
Population in 1990: 3,346.
Place of birth for U.S.-born residents:
This state: 1,570
Northeast: 82
Midwest: 134
South: 1,373
West: 68
74% of the 45742 zip code residents lived in the same house 5 years ago. Out of people who lived in different houses, 51% lived in this county. Out of people who lived in different counties, 50% lived in Ohio.
89% of the 45742 zip code residents lived in the same house 1 year ago. Out of people who lived in different houses, 50% moved from this county. Out of people who lived in different houses, 48% moved from different state.
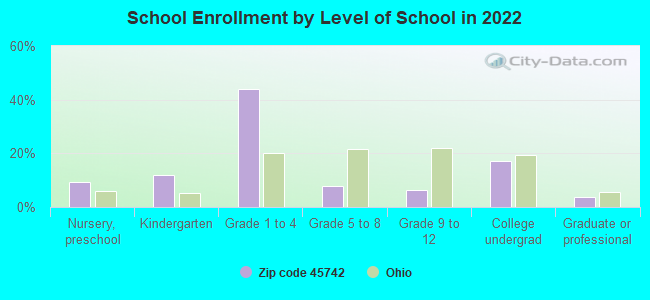
Private vs. public school enrollment:
Students in private schools in grades 1 to 8 (elementary and middle school):
Here:
0.0%
Ohio:
16.0%
Students in private schools in grades 9 to 12 (high school):
Here:
0.0%
Ohio:
13.1%
Students in private undergraduate colleges: 30
Here:
29.3%
Ohio:
22.3%
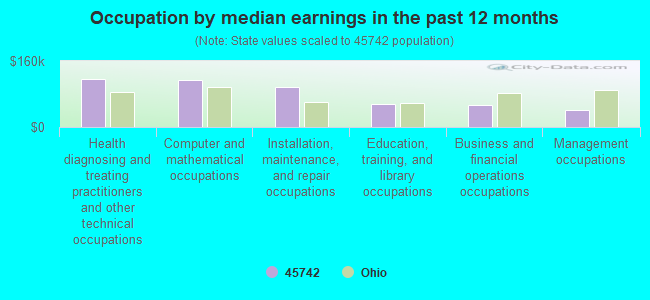
Occupation by median earnings in the past 12 months ($)
116,147Health diagnosing and treating practitioners and other technical occupations
112,814Computer and mathematical occupations
96,161Installation, maintenance, and repair occupations
56,716Education, training, and library occupations
53,047Business and financial operations occupations
40,339Management occupations
Top industries in this zip code by the number of employees in 2005:
Wholesale Trade: Other Grocery and Related Products Merchant Wholesalers (20-49 employees: 1 establishment)
Other Services (except Public Administration): Religious Organizations (5-9: 2, 1-4: 1)
Accommodation and Food Services: Limited-Service Restaurants (10-19: 1)
Construction: Painting and Wall Covering Contractors (5-9: 1, 1-4: 1)
Mining: Construction Sand and Gravel Mining (5-9: 1, 1-4: 1)
Utilities: Water Supply and Irrigation Systems (5-9: 1)
Fatal accident statistics in 2012:
Fatal accident count: 1
Vehicles involved in fatal accidents: 1
Fatal accidents caused by drunken drivers: 1
Fatalities: 1
Persons involved in fatal accidents: 1
Pedestrians involved in fatal accidents: 0
Fatal accident statistics in 2011:
Fatal accident count: 1
Vehicles involved in fatal accidents: 1
Fatal accidents caused by drunken drivers: 1
Fatalities: 1
Persons involved in fatal accidents: 2
Pedestrians involved in fatal accidents: 0
Home Mortgage Disclosure Act Aggregated Statistics For Year 2009 (Based on 4 partial tracts)
A) FHA, FSA/RHS & VA Home Purchase Loans
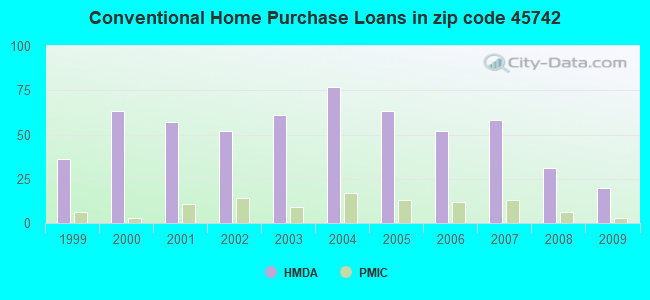
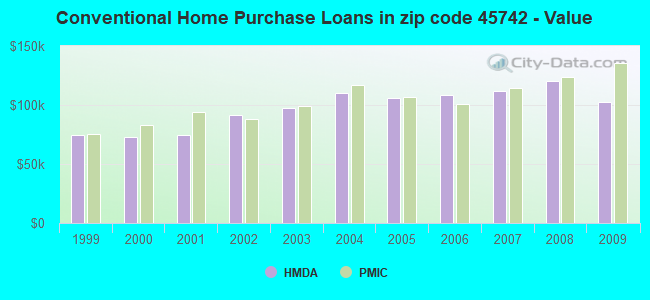
B) Conventional Home Purchase Loans
C) Refinancings
D) Home Improvement Loans
F) Non-occupant Loans on < 5 Family Dwellings (A B C & D)
G) Loans On Manufactured Home Dwelling (A B C & D)
Number
Average Value
Number
Average Value
Number
Average Value
Number
Average Value
Number
Average Value
Number
Average Value
LOANS ORIGINATED
14
$120,973
20
$102,350
105
$113,451
6
$56,363
3
$89,083
9
$61,587
APPLICATIONS APPROVED, NOT ACCEPTED
2
$76,780
0
$0
9
$101,306
1
$37,370
0
$0
1
$56,740
APPLICATIONS DENIED
3
$91,463
6
$81,623
41
$134,914
4
$56,345
2
$73,140
5
$71,830
APPLICATIONS WITHDRAWN
0
$0
3
$78,813
29
$144,465
3
$44,733
1
$35,500
1
$131,590
FILES CLOSED FOR INCOMPLETENESS
1
$67,810
1
$38,970
4
$133,910
0
$0
0
$0
0
$0
Aggregated Statistics For Year 2008 (Based on 4 partial tracts)
A) FHA, FSA/RHS & VA Home Purchase Loans
B) Conventional Home Purchase Loans
C) Refinancings
D) Home Improvement Loans
F) Non-occupant Loans on < 5 Family Dwellings (A B C & D)
G) Loans On Manufactured Home Dwelling (A B C & D)
Number
Average Value
Number
Average Value
Number
Average Value
Number
Average Value
Number
Average Value
Number
Average Value
LOANS ORIGINATED
9
$104,907
31
$120,084
62
$106,732
17
$38,399
7
$82,236
12
$61,878
APPLICATIONS APPROVED, NOT ACCEPTED
1
$91,100
2
$109,650
7
$99,546
1
$16,750
0
$0
1
$94,040
APPLICATIONS DENIED
3
$63,963
6
$78,483
50
$112,346
10
$49,504
1
$29,880
10
$69,474
APPLICATIONS WITHDRAWN
2
$95,100
1
$50,130
21
$122,768
3
$72,177
1
$97,560
2
$65,165
FILES CLOSED FOR INCOMPLETENESS
0
$0
0
$0
1
$143,990
0
$0
0
$0
1
$27,020
Aggregated Statistics For Year 2007 (Based on 4 partial tracts)
A) FHA, FSA/RHS & VA Home Purchase Loans
B) Conventional Home Purchase Loans
C) Refinancings
D) Home Improvement Loans
E) Loans on Dwellings For 5+ Families
F) Non-occupant Loans on < 5 Family Dwellings (A B C & D)
G) Loans On Manufactured Home Dwelling (A B C & D)
Number
Average Value
Number
Average Value
Number
Average Value
Number
Average Value
Number
Average Value
Number
Average Value
Number
Average Value
LOANS ORIGINATED
10
$102,765
58
$111,588
69
$113,990
15
$44,140
1
$79,470
7
$137,997
20
$70,298
APPLICATIONS APPROVED, NOT ACCEPTED
1
$81,410
6
$83,758
14
$115,111
2
$42,480
0
$0
1
$116,560
3
$56,743
APPLICATIONS DENIED
3
$88,443
18
$87,628
65
$111,463
17
$54,742
0
$0
3
$68,330
14
$65,409
APPLICATIONS WITHDRAWN
2
$131,685
7
$92,366
29
$113,428
4
$86,592
0
$0
1
$43,440
2
$46,260
FILES CLOSED FOR INCOMPLETENESS
0
$0
1
$129,760
7
$128,771
1
$92,710
0
$0
0
$0
0
$0
Aggregated Statistics For Year 2006 (Based on 4 partial tracts)
A) FHA, FSA/RHS & VA Home Purchase Loans
B) Conventional Home Purchase Loans
C) Refinancings
D) Home Improvement Loans
F) Non-occupant Loans on < 5 Family Dwellings (A B C & D)
G) Loans On Manufactured Home Dwelling (A B C & D)
Number
Average Value
Number
Average Value
Number
Average Value
Number
Average Value
Number
Average Value
Number
Average Value
LOANS ORIGINATED
10
$101,193
52
$108,342
75
$93,293
23
$43,432
7
$83,416
15
$62,733
APPLICATIONS APPROVED, NOT ACCEPTED
1
$118,850
10
$97,004
12
$97,324
3
$61,233
0
$0
4
$58,528
APPLICATIONS DENIED
4
$81,670
18
$102,535
67
$97,445
15
$38,139
1
$19,020
15
$57,347
APPLICATIONS WITHDRAWN
1
$115,340
10
$91,656
34
$102,155
4
$72,068
1
$95,360
3
$46,060
FILES CLOSED FOR INCOMPLETENESS
0
$0
1
$143,360
9
$111,597
1
$105,030
0
$0
0
$0
Aggregated Statistics For Year 2005 (Based on 4 partial tracts)
A) FHA, FSA/RHS & VA Home Purchase Loans
B) Conventional Home Purchase Loans
C) Refinancings
D) Home Improvement Loans
F) Non-occupant Loans on < 5 Family Dwellings (A B C & D)
G) Loans On Manufactured Home Dwelling (A B C & D)
Number
Average Value
Number
Average Value
Number
Average Value
Number
Average Value
Number
Average Value
Number
Average Value
LOANS ORIGINATED
11
$105,641
63
$106,223
96
$96,378
22
$39,644
12
$92,442
15
$53,157
APPLICATIONS APPROVED, NOT ACCEPTED
2
$77,615
8
$94,066
24
$86,253
4
$54,880
1
$109,600
6
$64,172
APPLICATIONS DENIED
1
$66,970
20
$74,028
75
$95,040
15
$27,492
1
$66,050
19
$57,717
APPLICATIONS WITHDRAWN
1
$82,350
9
$98,064
45
$118,085
4
$117,885
1
$45,270
6
$65,905
FILES CLOSED FOR INCOMPLETENESS
0
$0
1
$47,830
10
$99,980
3
$33,937
0
$0
1
$29,140
Aggregated Statistics For Year 2004 (Based on 4 partial tracts)
A) FHA, FSA/RHS & VA Home Purchase Loans
B) Conventional Home Purchase Loans
C) Refinancings
D) Home Improvement Loans
E) Loans on Dwellings For 5+ Families
F) Non-occupant Loans on < 5 Family Dwellings (A B C & D)
G) Loans On Manufactured Home Dwelling (A B C & D)
Number
Average Value
Number
Average Value
Number
Average Value
Number
Average Value
Number
Average Value
Number
Average Value
Number
Average Value
LOANS ORIGINATED
10
$87,090
77
$110,017
111
$91,066
22
$37,626
1
$52,980
10
$103,440
18
$55,343
APPLICATIONS APPROVED, NOT ACCEPTED
2
$79,385
10
$76,244
24
$88,404
2
$38,530
0
$0
3
$46,777
4
$64,360
APPLICATIONS DENIED
1
$59,870
17
$73,140
79
$91,356
15
$40,427
0
$0
3
$45,107
18
$52,971
APPLICATIONS WITHDRAWN
0
$0
7
$90,884
67
$100,071
5
$42,414
0
$0
2
$47,525
4
$58,435
FILES CLOSED FOR INCOMPLETENESS
1
$71,520
2
$73,110
9
$105,590
1
$12,050
0
$0
0
$0
1
$90,690
Aggregated Statistics For Year 2003 (Based on 4 partial tracts)
A) FHA, FSA/RHS & VA Home Purchase Loans
B) Conventional Home Purchase Loans
C) Refinancings
D) Home Improvement Loans
E) Loans on Dwellings For 5+ Families
F) Non-occupant Loans on < 5 Family Dwellings (A B C & D)
Number
Average Value
Number
Average Value
Number
Average Value
Number
Average Value
Number
Average Value
Number
Average Value
LOANS ORIGINATED
10
$90,312
61
$97,826
229
$90,298
18
$31,101
1
$714,170
6
$50,993
APPLICATIONS APPROVED, NOT ACCEPTED
0
$0
8
$78,451
32
$84,391
1
$5,830
0
$0
0
$0
APPLICATIONS DENIED
1
$132,020
17
$72,580
83
$80,564
9
$18,473
0
$0
3
$36,803
APPLICATIONS WITHDRAWN
2
$77,350
6
$62,738
39
$88,484
5
$12,706
0
$0
1
$70,500
FILES CLOSED FOR INCOMPLETENESS
0
$0
1
$75,930
5
$93,804
0
$0
0
$0
1
$69,160
Aggregated Statistics For Year 2002 (Based on 4 partial tracts)
A) FHA, FSA/RHS & VA Home Purchase Loans
B) Conventional Home Purchase Loans
C) Refinancings
D) Home Improvement Loans
F) Non-occupant Loans on < 5 Family Dwellings (A B C & D)
Number
Average Value
Number
Average Value
Number
Average Value
Number
Average Value
Number
Average Value
LOANS ORIGINATED
10
$98,544
52
$91,343
174
$85,014
15
$16,053
6
$84,360
APPLICATIONS APPROVED, NOT ACCEPTED
1
$99,920
10
$70,389
15
$77,476
4
$22,868
1
$87,130
APPLICATIONS DENIED
1
$41,940
17
$64,001
56
$71,190
9
$19,121
1
$29,360
APPLICATIONS WITHDRAWN
0
$0
6
$68,605
40
$73,628
1
$35,720
1
$20,930
FILES CLOSED FOR INCOMPLETENESS
0
$0
2
$78,810
9
$106,803
1
$30,590
0
$0
Aggregated Statistics For Year 2001 (Based on 4 partial tracts)
A) FHA, FSA/RHS & VA Home Purchase Loans
B) Conventional Home Purchase Loans
C) Refinancings
D) Home Improvement Loans
F) Non-occupant Loans on < 5 Family Dwellings (A B C & D)
Number
Average Value
Number
Average Value
Number
Average Value
Number
Average Value
Number
Average Value
LOANS ORIGINATED
14
$86,789
57
$74,437
164
$76,282
11
$17,182
5
$44,968
APPLICATIONS APPROVED, NOT ACCEPTED
1
$65,310
12
$48,409
23
$68,533
4
$53,225
0
$0
APPLICATIONS DENIED
0
$0
40
$50,925
60
$65,698
7
$28,579
1
$47,850
APPLICATIONS WITHDRAWN
1
$60,400
7
$54,013
40
$72,868
3
$30,813
0
$0
FILES CLOSED FOR INCOMPLETENESS
0
$0
1
$49,800
7
$77,830
0
$0
0
$0
Aggregated Statistics For Year 2000 (Based on 4 partial tracts)
A) FHA, FSA/RHS & VA Home Purchase Loans
B) Conventional Home Purchase Loans
C) Refinancings
D) Home Improvement Loans
F) Non-occupant Loans on < 5 Family Dwellings (A B C & D)
Number
Average Value
Number
Average Value
Number
Average Value
Number
Average Value
Number
Average Value
LOANS ORIGINATED
6
$75,560
63
$72,582
73
$58,067
15
$18,900
8
$38,716
APPLICATIONS APPROVED, NOT ACCEPTED
1
$47,150
13
$56,005
12
$54,034
3
$28,920
0
$0
APPLICATIONS DENIED
1
$23,310
40
$44,746
50
$54,132
8
$11,752
2
$31,190
APPLICATIONS WITHDRAWN
1
$25,960
7
$70,221
29
$44,998
3
$18,653
1
$18,540
FILES CLOSED FOR INCOMPLETENESS
1
$29,140
1
$39,790
3
$75,007
0
$0
0
$0
Aggregated Statistics For Year 1999 (Based on 2 partial tracts)
A) FHA, FSA/RHS & VA Home Purchase Loans
B) Conventional Home Purchase Loans
C) Refinancings
D) Home Improvement Loans
F) Non-occupant Loans on < 5 Family Dwellings (A B C & D)
Detailed PMIC statistics for the following Tracts:0202.00
, 0217.00
2002 - 2018 National Fire Incident Reporting System (NFIRS) incidents
According to the data from the years 2002 - 2018 the average number of fire incidents per year is 15. The highest number of fire incidents - 23 took place in 2011, and the least - 3 in 2015. The data has a declining trend.
When looking into fire subcategories, the most incidents belonged to: Structure Fires (37.2%), and Outside Fires (37.2%).
Fire incident types reported to NFIRS in Zip Code 45742


 Nearest zip codes: 26181, 45723, 45784, 45724, 45714, 26101.


 According to the data from the years 2002 - 2018 the average number of fire incidents per year is 15. The highest number of fire incidents - 23 took place in 2011, and the least - 3 in 2015. The data has a declining trend.
 When looking into fire subcategories, the most incidents belonged to: Structure Fires (37.2%), and Outside Fires (37.2%).