Estimated zip code population in 2022: 3,244 Zip code population in 2010: 3,386 Zip code population in 2000: 2,833
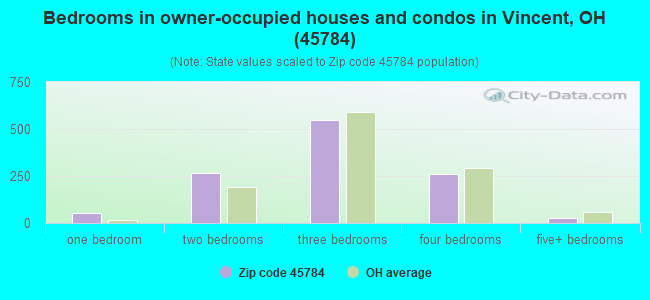
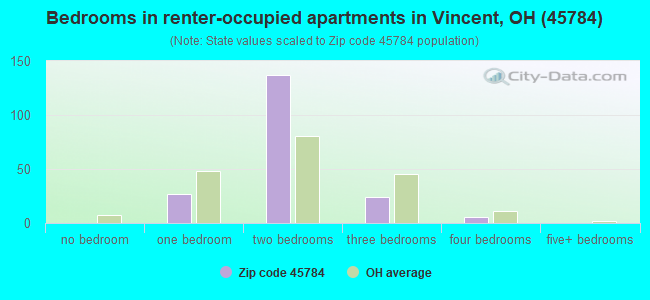
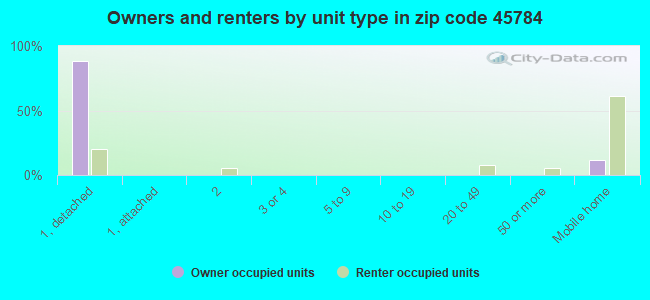
Houses and condos: 1,456 Renter-occupied apartments: 193
% of renters here:
14%
State:
33%
March 2022 cost of living index in zip code 45784: 82.4 (low, U.S. average is 100)
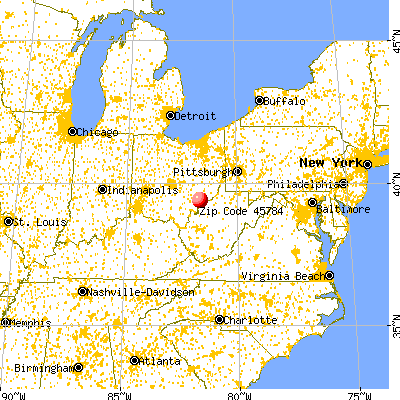
Land area: 37.4 sq. mi. Water area: 0.2 sq. mi.
Population density: 87 people per square mile
(very low).
OSM Map
General Map
Google Map
MSN Map
OSM Map
General Map
Google Map
MSN Map
OSM Map
General Map
Google Map
MSN Map
OSM Map
General Map
Google Map
MSN Map
Please wait while loading the map...
Real estate property taxes paid for housing units in 2022:
This zip code:
0.9% ($1,945)
Ohio:
1.3% ($2,639)
Median real estate property taxes paid for housing units with mortgages in 2022: $1,926 (0.9%) Median real estate property taxes paid for housing units with no mortgage in 2022: $1,969 (1.0%)
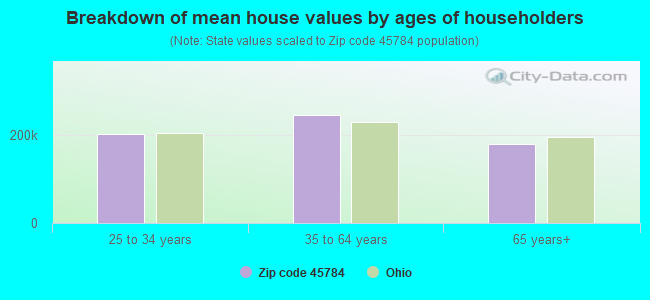
Estimated median house/condo value in 2022: $205,325
45784:
$205,325
Ohio:
$204,100
According to our research of Ohio and other state lists, there were 7 registered sex offenders living in 45784 zip code as of April 25, 2024. The ratio of all residents to sex offenders in zip code 45784 is 495 to 1. The ratio of registered sex offenders to all residents in this zip code is near the state average.
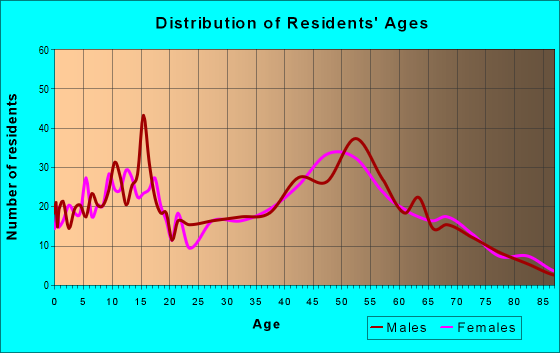
Median resident age:
This zip code:
46.8 years
Ohio median age:
39.9 years
Average household size:
This zip code:
2.4 people
Ohio:
2.4 people
Averages for the 2020 tax year for zip code 45784, filed in 2021:
Average Adjusted Gross Income (AGI) in 2020: $65,707 (Individual Income Tax Returns)
Here:
$65,707
State:
$67,288
Salary/wage: $58,374 (reported on 81.3% of returns)
Here:
$58,374
State:
$55,628
(% of AGI for various income ranges: 1094.8% for AGIs below $25k, 3470.7% for AGIs $25k-50k, 5803.9% for AGIs $50k-75k, 9347.7% for AGIs $75k-100k, 13601.9% for AGIs $100k-200k)
Taxable interest for individuals: $685 (reported on 35.3% of returns)
This zip code:
$685
Ohio:
$1,518
(% of AGI for various income ranges: 22.6% for AGIs below $25k, 9.3% for AGIs $25k-50k, 40.6% for AGIs $50k-75k, 17.7% for AGIs $75k-100k, 46.2% for AGIs $100k-200k)
Ordinary dividends: $2,634 (reported on 19.3% of returns)
Here:
$2,634
State:
$7,167
(% of AGI for various income ranges: 31.3% for AGIs below $25k, 28.9% for AGIs $25k-50k, 72.8% for AGIs $50k-75k, 100.8% for AGIs $75k-100k, 122.4% for AGIs $100k-200k)
Net capital gain/loss in AGI: +$8,292 (reported on 16.0% of returns)
Here:
+$8,292
State:
+$18,919
(% of AGI for various income ranges: 14.5% for AGIs below $25k, 24.8% for AGIs $25k-50k, 101.1% for AGIs $50k-75k, 66.2% for AGIs $75k-100k, 462.4% for AGIs $100k-200k)
Profit/loss from business: +$10,235 (reported on 13.3% of returns)
Here:
+$10,235
State:
+$13,744
(% of AGI for various income ranges: 53.9% for AGIs below $25k, 174.8% for AGIs $25k-50k, 135.0% for AGIs $50k-75k, 183.1% for AGIs $75k-100k, 441.4% for AGIs $100k-200k)
Taxable individual retirement arrangement distribution: $17,487 (reported on 10.0% of returns)
45784:
$17,487
Ohio:
$18,876
(% of AGI for various income ranges: 46.5% for AGIs below $25k, 121.1% for AGIs $25k-50k, 480.0% for AGIs $50k-75k, 613.3% for AGIs $100k-200k)
Total itemized deductions: $28,880 (reported on 3.3% of returns)
Here:
$28,880
State:
$33,869
(% of AGI for various income ranges: 687.6% for AGIs $100k-200k)
Charity contributions: $11,125 (reported on 2.7% of returns)
Here:
$11,125
State:
$14,577
(% of AGI for various income ranges: 211.9% for AGIs $100k-200k)
Taxes paid: $6,980 (reported on 3.3% of returns)
45784:
$6,980
State:
$7,681
(% of AGI for various income ranges: 166.2% for AGIs $100k-200k)
Earned income credit: $2,239 (reported on 12.0% of returns)
Here:
$2,239
State:
$2,304
(% of AGI for various income ranges: 64.2% for AGIs below $25k, 75.6% for AGIs $25k-50k)
Percentage of individuals using paid preparers for their 2020 taxes: 94.7%
Here:
95%
State:
94%
(% for various income ranges: 95.2% for AGIs below $25k, 97.1% for AGIs $25k-50k, 91.7% for AGIs $50k-75k, 100.0% for AGIs $75k-100k, 92.9% for AGIs $100k-200k, 75.0% for AGIs over 200k)
Averages for the 2012 tax year for zip code 45784, filed in 2013:
Average Adjusted Gross Income (AGI) in 2012: $50,605 (Individual Income Tax Returns)
Here:
$50,605
State:
$54,926
Salary/wage: $46,176 (reported on 84.1% of returns)
Here:
$46,176
State:
$45,869
(% of AGI for various income ranges: 72.3% for AGIs below $25k, 74.2% for AGIs $25k-50k, 75.3% for AGIs $50k-75k, 82.1% for AGIs $75k-100k, 77.0% for AGIs $100k-200k)
Taxable interest for individuals: $519 (reported on 35.1% of returns)
This zip code:
$519
Ohio:
$1,297
(% of AGI for various income ranges: 0.9% for AGIs below $25k, 0.6% for AGIs $25k-50k, 0.3% for AGIs $50k-75k, 0.2% for AGIs $75k-100k, 0.2% for AGIs $100k-200k)
Ordinary dividends: $1,700 (reported on 16.6% of returns)
Here:
$1,700
State:
$5,821
(% of AGI for various income ranges: 1.0% for AGIs below $25k, 0.8% for AGIs $25k-50k, 0.4% for AGIs $50k-75k, 1.0% for AGIs $75k-100k, 0.2% for AGIs $100k-200k)
Net capital gain/loss in AGI: +$1,965 (reported on 11.3% of returns)
Here:
+$1,965
State:
+$11,232
(% of AGI for various income ranges: 0.2% for AGIs below $25k, 0.3% for AGIs $25k-50k, 0.6% for AGIs $50k-75k, 0.2% for AGIs $75k-100k, 0.6% for AGIs $100k-200k)
Profit/loss from business: +$9,130 (reported on 15.2% of returns)
Here:
+$9,130
State:
+$12,773
(% of AGI for various income ranges: 7.2% for AGIs below $25k, 3.4% for AGIs $25k-50k, 3.4% for AGIs $50k-75k, 0.7% for AGIs $75k-100k, 2.1% for AGIs $100k-200k)
Taxable individual retirement arrangement distribution: $12,538 (reported on 10.6% of returns)
45784:
$12,538
Ohio:
$14,511
(% of AGI for various income ranges: 2.5% for AGIs below $25k, 2.9% for AGIs $25k-50k, 3.2% for AGIs $50k-75k, 2.7% for AGIs $75k-100k, 2.2% for AGIs $100k-200k)
Total itemized deductions: $17,897 (18% of AGI, reported on 23.2% of returns)
Here:
$17,897
State:
$21,278
Here:
18.5% of AGI
State:
18.8% of AGI
(% of AGI for various income ranges: 6.8% for AGIs $25k-50k, 6.6% for AGIs $50k-75k, 7.7% for AGIs $75k-100k, 11.8% for AGIs $100k-200k)
Charity contributions: $3,767 (reported on 15.9% of returns)
Here:
$3,767
State:
$3,943
(% of AGI for various income ranges: 0.7% for AGIs $25k-50k, 0.8% for AGIs $50k-75k, 1.3% for AGIs $75k-100k, 1.8% for AGIs $100k-200k)
Taxes paid: $6,257 (reported on 23.2% of returns)
45784:
$6,257
State:
$9,568
(% of AGI for various income ranges: 1.4% for AGIs $25k-50k, 1.5% for AGIs $50k-75k, 2.6% for AGIs $75k-100k, 5.1% for AGIs $100k-200k)
Earned income credit: $2,283 (reported on 15.9% of returns)
Here:
$2,283
State:
$2,285
(% of AGI for various income ranges: 6.0% for AGIs below $25k, 1.1% for AGIs $25k-50k)
Percentage of individuals using paid preparers for their 2012 taxes: 49.7%
Here:
50%
State:
51%
(% for various income ranges: 41.8% for AGIs below $25k, 55.3% for AGIs $25k-50k, 59.1% for AGIs $50k-75k, 47.1% for AGIs $75k-100k, 52.6% for AGIs $100k-200k)
Averages for the 2004 tax year for zip code 45784, filed in 2005:
Average Adjusted Gross Income (AGI) in 2004: $39,854 (Individual Income Tax Returns)
Here:
$39,854
State:
$44,480
Salary/wage: $36,801 (reported on 89.1% of returns)
Here:
$36,801
State:
$39,198
(% of AGI for various income ranges: 98.1% for AGIs below $10k, 75.4% for AGIs $10k-25k, 82.9% for AGIs $25k-50k, 87.3% for AGIs $50k-75k, 82.5% for AGIs $75k-100k, 74.2% for AGIs over 100k)
Taxable interest for individuals: $591 (reported on 47.9% of returns)
This zip code:
$591
Ohio:
$1,532
(% of AGI for various income ranges: 1.9% for AGIs below $10k, 1.1% for AGIs $10k-25k, 1.0% for AGIs $25k-50k, 0.3% for AGIs $50k-75k, 0.6% for AGIs $75k-100k, 0.6% for AGIs over 100k)
Taxable dividends: $1,072 (reported on 18.5% of returns)
Here:
$1,072
State:
$3,496
(% of AGI for various income ranges: 0.1% for AGIs below $10k, 0.5% for AGIs $10k-25k, 0.3% for AGIs $25k-50k, 0.4% for AGIs $50k-75k, 0.3% for AGIs $75k-100k, 1.4% for AGIs over 100k)
Net capital gain/loss: +$2,086 (reported on 13.0% of returns)
Here:
+$2,086
State:
+$8,582
(% of AGI for various income ranges: -0.4% for AGIs below $10k, 0.4% for AGIs $10k-25k, -0.1% for AGIs $25k-50k, 0.1% for AGIs $50k-75k, 1.1% for AGIs $75k-100k, 2.7% for AGIs over 100k)
Profit/loss from business: +$5,374 (reported on 14.4% of returns)
Here:
+$5,374
State:
+$10,813
(% of AGI for various income ranges: 4.2% for AGIs below $10k, 5.9% for AGIs $10k-25k, 2.0% for AGIs $25k-50k, 3.0% for AGIs $50k-75k, 0.0% for AGIs $75k-100k, -0.4% for AGIs over 100k)
IRA payment deduction: $2,448 (reported on 2.0% of returns)
45784:
$2,448
Ohio:
$2,794
Total itemized deductions: $14,521 (21% of AGI, reported on 26.5% of returns)
Here:
$14,521
State:
$17,503
Here:
21.2% of AGI
State:
20.8% of AGI
(% of AGI for various income ranges: 3.2% for AGIs $10k-25k, 7.9% for AGIs $25k-50k, 9.9% for AGIs $50k-75k, 13.5% for AGIs $75k-100k, 12.7% for AGIs over 100k)
Charity contributions deductions: $2,677 (4% of AGI, reported on 21.7% of returns)
Here:
$2,677
State:
$3,087
Here:
3.7% of AGI
State:
3.4% of AGI
(% of AGI for various income ranges: 1.1% for AGIs below $10k, 1.0% for AGIs $25k-50k, 1.5% for AGIs $50k-75k, 2.3% for AGIs $75k-100k, 2.2% for AGIs over 100k)
Total tax: $4,562 (reported on 76.2% of returns)
45784:
$4,562
State:
$6,781
(% of AGI for various income ranges: 1.6% for AGIs below $10k, 4.2% for AGIs $10k-25k, 6.3% for AGIs $25k-50k, 8.6% for AGIs $50k-75k, 10.6% for AGIs $75k-100k, 14.5% for AGIs over 100k)
Earned income credit: $1,817 (reported on 13.0% of returns)
Here:
$1,817
State:
$1,696
Percentage of individuals using paid preparers for their 2004 taxes: 49.1%
Here:
49%
State:
55%
(% for various income ranges: 36.7% for AGIs below $10k, 47.3% for AGIs $10k-25k, 55.9% for AGIs $25k-50k, 55.4% for AGIs $50k-75k, 43.2% for AGIs $75k-100k, 48.6% for AGIs over 100k)
Household received Food Stamps/SNAP in the past 12 months: 64 Household did not receive Food Stamps/SNAP in the past 12 months: 1,270
Women who had a birth in the past 12 months: 13 (0 now married, 13 unmarried) Women who did not have a birth in the past 12 months: 578 (338 now married, 239 unmarried)
Housing units in zip code 45784 with a mortgage: 634 (54 second mortgage, 55 both second mortgage and home equity loan) Houses without a mortgage: 36
Median monthly owner costs for units with a mortgage: $1,192 Median monthly owner costs for units without a mortgage: $492
Residents with income below the poverty level in 2022:
This zip code:
3.6%
Whole state:
13.4%
Residents with income below 50% of the poverty level in 2022:
This zip code:
2.7%
Whole state:
7.0%
Median number of rooms in houses and condos:
Here:
6.6
State:
6.7
Median number of rooms in apartments:
Here:
3.6
State:
4.4
Notable locations in this zip code not listed on our city pages
Churches in zip code 45784 include: Fairchild Church (A), Gospel Tabernacle (B), Saint Ambrose Church (C), Barlow Methodist Church (D), Vincent United Methodist Church (E). Display/hide their locations on the map
Cemeteries: Barlow Central Cemetery (1), Fairfield Church Cemetery (2), Veto Cemetery (3), Woodruff Cemetery (4), Murdock Cemetery (5). Display/hide their locations on the map
Streams, rivers, and creeks: Buffalo Run (A), Tupper Creek (B), Southwest Fork South Branch Wolf Creek (C), South Fork South Branch Wolf Creek (D). Display/hide their locations on the map
Size of family households: 455 2-persons, 286 3-persons, 118 4-persons, 24 5-persons, 39 6-persons
Size of nonfamily households: 364 1-person, 47 2-persons
383 married couples with children.
83 single-parent households (29 men, 54 women).
98.4% of residents of 45784 zip code speak English at home.
1.6% of residents speak Spanish at home (100% very well).
0.2% of residents speak other Indo-European language at home (100% well).
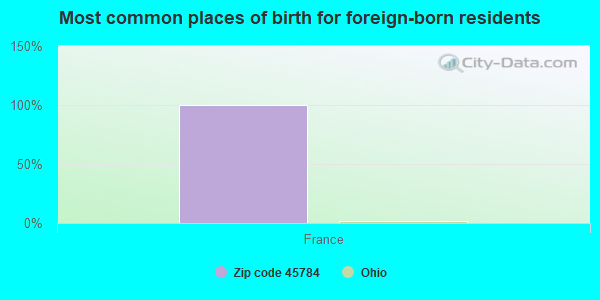
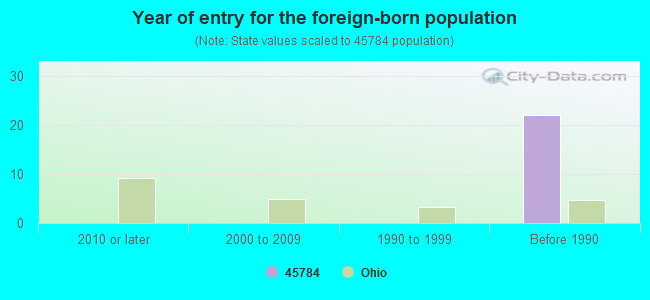
Foreign born population: 10 (0.3%) (100.0% of them are naturalized citizens)
This zip code:
0.3%
Whole state:
5.0%
100%France
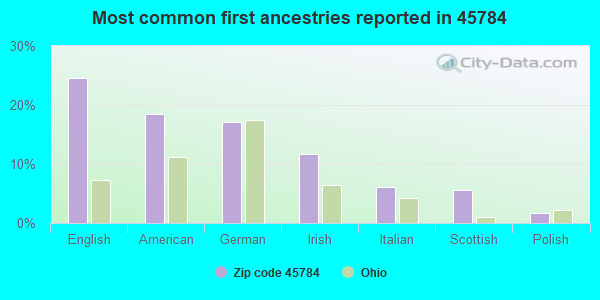
25%English
18%American
17%German
12%Irish
6%Italian
6%Scottish
2%Polish
Year of entry for the foreign-born population
02010 or later
02000 to 2009
01990 to 1999
22Before 1990
Facilities with environmental interests located in this zip code:
BARLOW-VINCENT ELEMENTARY SCH (70 WARRIOR DR in VINCENT, OH)
(Geographic Names Information System) (National Center for Education Statistics) - STATE ID-001578 Organizations: WARREN LOCAL SD (SCHOOL DISTRICT)
Housing units lacking complete plumbing facilities: 1.5% Housing units lacking complete kitchen facilities: 1.0%
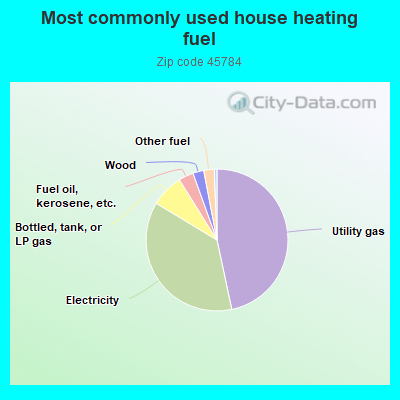
46.8%Utility gas
37.1%Electricity
7.5%Bottled, tank, or LP gas
3.4%Fuel oil, kerosene, etc.
2.5%Wood
2.4%Other fuel
0.6%No fuel used
Population in 1990: 1,524. Population change in the 1990s: +1,309 (+85.9%).
Place of birth for U.S.-born residents:
This state: 1,425
Northeast: 109
Midwest: 212
South: 1,387
West: 49
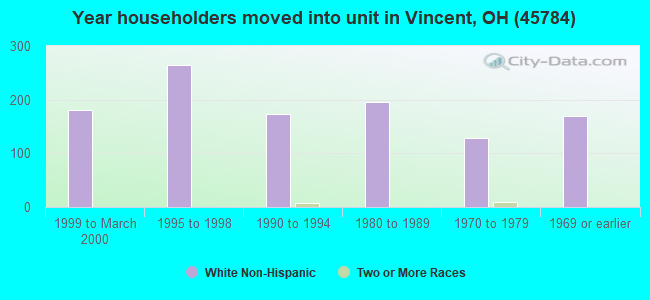
61% of the 45784 zip code residents lived in the same house 5 years ago. Out of people who lived in different houses, 62% lived in this county. Out of people who lived in different counties, 50% lived in Ohio.
85% of the 45784 zip code residents lived in the same house 1 year ago. Out of people who lived in different houses, 17% moved from this county. Out of people who lived in different houses, 8% moved from different county within same state. Out of people who lived in different houses, 77% moved from different state.
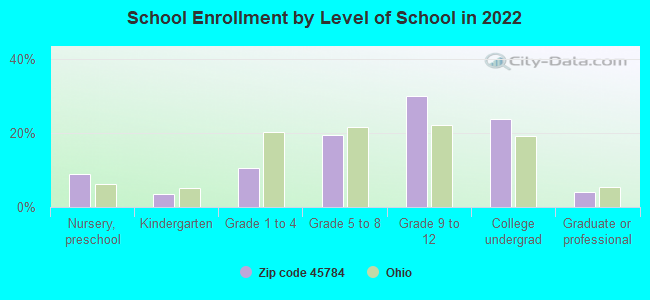
Private vs. public school enrollment:
Students in private schools in grades 1 to 8 (elementary and middle school): 21
Here:
11.3%
Ohio:
16.0%
Students in private schools in grades 9 to 12 (high school):
Here:
0.0%
Ohio:
13.1%
Students in private undergraduate colleges:
Here:
0.0%
Ohio:
22.3%
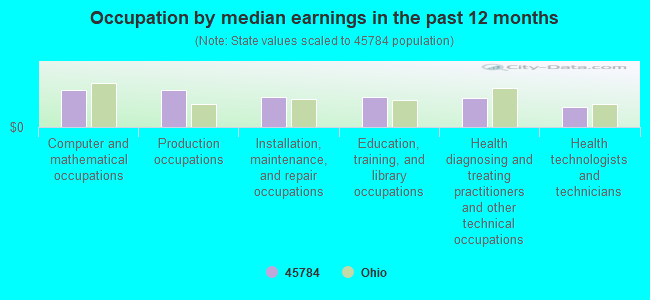
Occupation by median earnings in the past 12 months ($)
89,817Computer and mathematical occupations
89,647Production occupations
74,143Installation, maintenance, and repair occupations
73,258Education, training, and library occupations
71,778Health diagnosing and treating practitioners and other technical occupations
49,242Health technologists and technicians
Companies with federal contracts located in this zip code:
MICRO MACHINE WORKS, INC (10499 STATE ROUTE 339 in VINCENT, OH; small business) : $6,459 in 2 contractsin 2005
$3,600 with Defense Logistics Agency for Bushings, Rings, Shims, and Spacers. Signed on 2005-08-29. Completion date: 2005-12-27.
$2,859 with Defense Logistics Agency for Vehicular Cab, Body, and Frame Structural Components. Signed on 2005-08-03. Completion date: 2005-10-04.
Top industries in this zip code by the number of employees in 2005:
Construction: New Single-Family Housing Construction (except Operative Builders) (5-9 employees: 2 establishments, 1-4 employees: 2 establishments)
Health Care and Social Assistance: Offices of Physicians (except Mental Health Specialists) (10-19: 1)
Real Estate and Rental and Leasing: Video Tape and Disc Rental (10-19: 1)
Health Care and Social Assistance: Child Day Care Services (10-19: 1)
Arts, Entertainment, and Recreation: All Other Amusement and Recreation Industries (5-9: 1)
Construction: Residential Remodelers (5-9: 1)
Information: Cable and Other Program Distribution (5-9: 1)
Fatal accident statistics in 2013:
Fatal accident count: 1
Vehicles involved in fatal accidents: 1
Fatal accidents caused by drunken drivers: 0
Fatalities: 1
Persons involved in fatal accidents: 1
Pedestrians involved in fatal accidents: 0
Fatal accident statistics in 2012:
Fatal accident count: 1
Vehicles involved in fatal accidents: 1
Fatal accidents caused by drunken drivers: 1
Fatalities: 1
Persons involved in fatal accidents: 1
Pedestrians involved in fatal accidents: 0
Home Mortgage Disclosure Act Aggregated Statistics For Year 2009 (Based on 4 partial tracts)
A) FHA, FSA/RHS & VA Home Purchase Loans
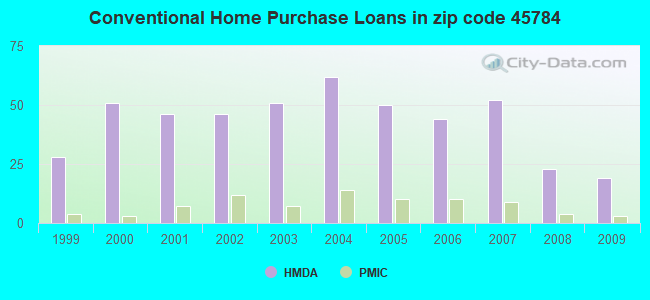
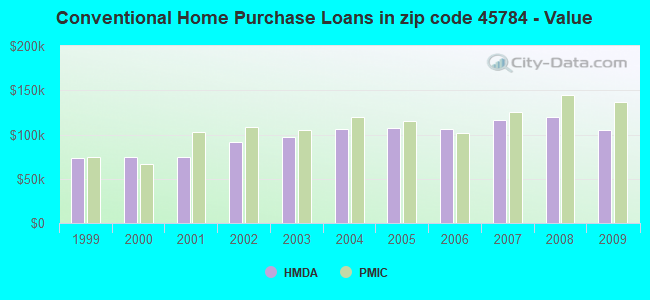
B) Conventional Home Purchase Loans
C) Refinancings
D) Home Improvement Loans
F) Non-occupant Loans on < 5 Family Dwellings (A B C & D)
G) Loans On Manufactured Home Dwelling (A B C & D)
Number
Average Value
Number
Average Value
Number
Average Value
Number
Average Value
Number
Average Value
Number
Average Value
LOANS ORIGINATED
9
$122,792
19
$105,589
85
$112,564
5
$50,540
3
$80,607
9
$64,489
APPLICATIONS APPROVED, NOT ACCEPTED
1
$102,150
0
$0
7
$102,637
1
$53,340
0
$0
1
$42,610
APPLICATIONS DENIED
2
$99,690
7
$91,894
35
$131,485
4
$50,245
2
$61,925
5
$57,346
APPLICATIONS WITHDRAWN
0
$0
2
$125,075
24
$136,307
2
$69,600
0
$0
1
$104,920
FILES CLOSED FOR INCOMPLETENESS
0
$0
1
$31,590
4
$111,232
1
$56,400
0
$0
1
$28,600
Aggregated Statistics For Year 2008 (Based on 4 partial tracts)
A) FHA, FSA/RHS & VA Home Purchase Loans
B) Conventional Home Purchase Loans
C) Refinancings
D) Home Improvement Loans
F) Non-occupant Loans on < 5 Family Dwellings (A B C & D)
G) Loans On Manufactured Home Dwelling (A B C & D)
Number
Average Value
Number
Average Value
Number
Average Value
Number
Average Value
Number
Average Value
Number
Average Value
LOANS ORIGINATED
9
$100,763
23
$120,097
53
$109,930
16
$31,706
6
$72,207
11
$63,239
APPLICATIONS APPROVED, NOT ACCEPTED
1
$69,650
2
$73,040
6
$91,935
1
$17,810
0
$0
1
$72,420
APPLICATIONS DENIED
2
$75,745
5
$80,876
39
$116,843
8
$56,756
1
$25,680
8
$80,870
APPLICATIONS WITHDRAWN
1
$105,830
1
$67,800
16
$124,472
2
$72,555
1
$86,550
1
$72,520
FILES CLOSED FOR INCOMPLETENESS
1
$26,610
0
$0
1
$120,870
0
$0
0
$0
0
$0
Aggregated Statistics For Year 2007 (Based on 4 partial tracts)
A) FHA, FSA/RHS & VA Home Purchase Loans
B) Conventional Home Purchase Loans
C) Refinancings
D) Home Improvement Loans
F) Non-occupant Loans on < 5 Family Dwellings (A B C & D)
G) Loans On Manufactured Home Dwelling (A B C & D)
Number
Average Value
Number
Average Value
Number
Average Value
Number
Average Value
Number
Average Value
Number
Average Value
LOANS ORIGINATED
8
$100,770
52
$116,754
60
$111,900
12
$41,645
8
$113,250
18
$66,796
APPLICATIONS APPROVED, NOT ACCEPTED
1
$115,210
5
$87,286
10
$108,805
2
$66,515
1
$64,860
2
$55,145
APPLICATIONS DENIED
2
$100,425
14
$96,209
52
$104,905
16
$46,409
2
$89,155
13
$68,673
APPLICATIONS WITHDRAWN
2
$107,660
5
$94,368
22
$119,527
3
$77,830
1
$24,170
2
$43,150
FILES CLOSED FOR INCOMPLETENESS
0
$0
1
$105,040
5
$126,238
0
$0
0
$0
0
$0
Aggregated Statistics For Year 2006 (Based on 4 partial tracts)
A) FHA, FSA/RHS & VA Home Purchase Loans
B) Conventional Home Purchase Loans
C) Refinancings
D) Home Improvement Loans
F) Non-occupant Loans on < 5 Family Dwellings (A B C & D)
G) Loans On Manufactured Home Dwelling (A B C & D)
Number
Average Value
Number
Average Value
Number
Average Value
Number
Average Value
Number
Average Value
Number
Average Value
LOANS ORIGINATED
9
$104,137
44
$105,820
66
$92,678
20
$39,722
6
$90,095
15
$60,001
APPLICATIONS APPROVED, NOT ACCEPTED
1
$116,790
9
$89,848
12
$90,593
3
$56,903
0
$0
4
$49,902
APPLICATIONS DENIED
4
$87,755
15
$96,069
65
$95,182
13
$36,113
1
$17,100
16
$55,794
APPLICATIONS WITHDRAWN
1
$88,800
7
$99,583
29
$107,886
3
$73,467
1
$53,060
3
$56,760
FILES CLOSED FOR INCOMPLETENESS
0
$0
1
$84,580
10
$107,311
1
$75,420
0
$0
0
$0
Aggregated Statistics For Year 2005 (Based on 4 partial tracts)
A) FHA, FSA/RHS & VA Home Purchase Loans
B) Conventional Home Purchase Loans
C) Refinancings
D) Home Improvement Loans
F) Non-occupant Loans on < 5 Family Dwellings (A B C & D)
G) Loans On Manufactured Home Dwelling (A B C & D)
Number
Average Value
Number
Average Value
Number
Average Value
Number
Average Value
Number
Average Value
Number
Average Value
LOANS ORIGINATED
9
$111,090
50
$107,084
76
$95,920
18
$32,166
10
$83,122
15
$55,447
APPLICATIONS APPROVED, NOT ACCEPTED
1
$86,380
8
$85,809
20
$81,168
3
$47,130
1
$95,230
5
$68,094
APPLICATIONS DENIED
1
$104,060
20
$75,593
71
$95,159
12
$26,999
1
$57,690
20
$61,671
APPLICATIONS WITHDRAWN
1
$67,330
10
$83,299
40
$111,130
5
$143,382
2
$36,510
7
$71,663
FILES CLOSED FOR INCOMPLETENESS
0
$0
1
$56,050
7
$97,549
2
$28,750
0
$0
1
$56,400
Aggregated Statistics For Year 2004 (Based on 4 partial tracts)
A) FHA, FSA/RHS & VA Home Purchase Loans
B) Conventional Home Purchase Loans
C) Refinancings
D) Home Improvement Loans
F) Non-occupant Loans on < 5 Family Dwellings (A B C & D)
G) Loans On Manufactured Home Dwelling (A B C & D)
Number
Average Value
Number
Average Value
Number
Average Value
Number
Average Value
Number
Average Value
Number
Average Value
LOANS ORIGINATED
7
$85,077
62
$105,654
94
$91,712
17
$36,484
7
$126,740
19
$54,914
APPLICATIONS APPROVED, NOT ACCEPTED
2
$87,900
8
$80,625
20
$79,662
2
$40,970
2
$56,165
3
$72,090
APPLICATIONS DENIED
2
$36,750
15
$69,501
63
$93,070
12
$34,794
2
$50,950
18
$56,865
APPLICATIONS WITHDRAWN
0
$0
7
$88,133
53
$97,156
5
$37,526
2
$39,745
5
$59,070
FILES CLOSED FOR INCOMPLETENESS
0
$0
1
$81,360
6
$101,857
1
$12,370
0
$0
1
$68,860
Aggregated Statistics For Year 2003 (Based on 4 partial tracts)
A) FHA, FSA/RHS & VA Home Purchase Loans
B) Conventional Home Purchase Loans
C) Refinancings
D) Home Improvement Loans
F) Non-occupant Loans on < 5 Family Dwellings (A B C & D)
Number
Average Value
Number
Average Value
Number
Average Value
Number
Average Value
Number
Average Value
LOANS ORIGINATED
7
$93,986
51
$97,710
182
$89,286
14
$24,736
5
$55,898
APPLICATIONS APPROVED, NOT ACCEPTED
1
$50,840
7
$85,550
26
$85,400
1
$3,240
0
$0
APPLICATIONS DENIED
1
$109,400
17
$73,050
74
$77,864
8
$13,191
2
$39,635
APPLICATIONS WITHDRAWN
1
$86,080
6
$61,278
35
$87,903
4
$12,658
1
$46,590
FILES CLOSED FOR INCOMPLETENESS
0
$0
1
$66,590
4
$92,698
1
$28,200
1
$71,030
Aggregated Statistics For Year 2002 (Based on 4 partial tracts)
A) FHA, FSA/RHS & VA Home Purchase Loans
B) Conventional Home Purchase Loans
C) Refinancings
D) Home Improvement Loans
F) Non-occupant Loans on < 5 Family Dwellings (A B C & D)
Number
Average Value
Number
Average Value
Number
Average Value
Number
Average Value
Number
Average Value
LOANS ORIGINATED
8
$99,144
46
$91,917
138
$84,795
14
$15,130
4
$78,335
APPLICATIONS APPROVED, NOT ACCEPTED
1
$86,730
7
$71,883
16
$73,689
3
$21,023
1
$87,540
APPLICATIONS DENIED
1
$64,370
16
$65,680
54
$67,506
7
$18,047
1
$20,300
APPLICATIONS WITHDRAWN
0
$0
5
$61,150
34
$78,416
1
$32,610
1
$40,510
FILES CLOSED FOR INCOMPLETENESS
0
$0
2
$58,285
9
$92,826
1
$22,680
0
$0
Aggregated Statistics For Year 2001 (Based on 4 partial tracts)
A) FHA, FSA/RHS & VA Home Purchase Loans
B) Conventional Home Purchase Loans
C) Refinancings
D) Home Improvement Loans
F) Non-occupant Loans on < 5 Family Dwellings (A B C & D)
Number
Average Value
Number
Average Value
Number
Average Value
Number
Average Value
Number
Average Value
LOANS ORIGINATED
9
$85,059
46
$75,128
133
$76,648
13
$17,125
4
$39,202
APPLICATIONS APPROVED, NOT ACCEPTED
1
$48,230
10
$46,899
18
$68,586
3
$45,053
0
$0
APPLICATIONS DENIED
0
$0
33
$48,095
51
$63,946
6
$20,817
2
$34,255
APPLICATIONS WITHDRAWN
1
$33,610
6
$55,723
30
$72,515
3
$17,997
0
$0
FILES CLOSED FOR INCOMPLETENESS
0
$0
1
$27,710
4
$80,600
0
$0
0
$0
Aggregated Statistics For Year 2000 (Based on 4 partial tracts)
A) FHA, FSA/RHS & VA Home Purchase Loans
B) Conventional Home Purchase Loans
C) Refinancings
D) Home Improvement Loans
F) Non-occupant Loans on < 5 Family Dwellings (A B C & D)
Number
Average Value
Number
Average Value
Number
Average Value
Number
Average Value
Number
Average Value
LOANS ORIGINATED
4
$77,995
51
$75,107
64
$58,089
14
$18,424
8
$38,772
APPLICATIONS APPROVED, NOT ACCEPTED
1
$26,240
11
$59,496
13
$54,728
3
$26,753
0
$0
APPLICATIONS DENIED
0
$0
31
$44,982
42
$51,930
8
$12,518
2
$40,280
APPLICATIONS WITHDRAWN
0
$0
7
$85,610
21
$45,992
2
$19,815
0
$0
FILES CLOSED FOR INCOMPLETENESS
0
$0
1
$33,180
3
$64,567
0
$0
0
$0
Aggregated Statistics For Year 1999 (Based on 2 partial tracts)
A) FHA, FSA/RHS & VA Home Purchase Loans
B) Conventional Home Purchase Loans
C) Refinancings
D) Home Improvement Loans
F) Non-occupant Loans on < 5 Family Dwellings (A B C & D)
Detailed PMIC statistics for the following Tracts:0202.00
, 0217.00
2002 - 2018 National Fire Incident Reporting System (NFIRS) incidents
According to the data from the years 2002 - 2018 the average number of fires per year is 9. The highest number of reported fire incidents - 16 took place in 2008, and the least - 1 in 2002. The data has a rising trend.
When looking into fire subcategories, the most incidents belonged to: Structure Fires (46.1%), and Outside Fires (32.5%).
Fire incident types reported to NFIRS in Zip Code 45784


 Nearest zip codes: 45729, 45787, 45714, 45742, 45786, 45724.


 According to the data from the years 2002 - 2018 the average number of fires per year is 9. The highest number of reported fire incidents - 16 took place in 2008, and the least - 1 in 2002. The data has a rising trend.
 When looking into fire subcategories, the most incidents belonged to: Structure Fires (46.1%), and Outside Fires (32.5%).