Estimated zip code population in 2022: 14,543
Zip code population in 2010: 15,758
Zip code population in 2000: 17,454
Houses and condos: 7,202
Renter-occupied apartments: 2,677
% of renters here:
44%State:
33%
March 2022 cost of living index in zip code 45804: 89.6
(less than average, U.S. average is 100)
Land area: 21.7
sq. mi.
Water area: 1.2
sq. mi.
Population density: 669 people per square mile (low).
OSM Map
General Map
Google Map
MSN Map
OSM Map
General Map
Google Map
MSN Map
OSM Map
General Map
Google Map
MSN Map
OSM Map
General Map
Google Map
MSN Map
Please wait while loading the map...
Real estate property taxes paid for housing units in 2022:
This zip code:
1.0% ($1,000)Ohio:
1.3% ($2,639)
Median real estate property taxes paid for housing units with mortgages in 2022: $1,180 (1.1%)
Median real estate property taxes paid for housing units with no mortgage in 2022: $854 (0.9%)
Profiles of local businesses
Business Search - 14 Million verified businesses
Males: 6,942 Females: 7,600
For population 25 years and over in 45804:
High school or higher: 85.1%Bachelor's degree or higher: 10.3%Graduate or professional degree: 3.4%Unemployed: 6.3%Mean travel time to work (commute): 17.5 minutes
For population 15 years and over in 45804:
Never married: 36.9%Now married: 31.2%Separated: 3.5%Widowed: 9.1%Divorced: 19.4%
Zip code 45804 compared to state average:
Median household income below state average. Median house value below state average. Foreign-born population percentage significantly below state average. Length of stay since moving in significantly above state average. Percentage of population with a bachelor's degree or higher significantly below state average. 10,159 69.9% White 2,921 20.1% Black 1,081 7.4% Two or more races 362 2.5% Hispanic or Latino 6 0.04% Asian 6 0.04% Some other race 4 0.03% American Indian
Data:
Median household income ($)
Median household income (% change since 2000)
Household income diversity
Ratio of average income to average house value (%)
Ratio of average income to average rent
Median household income ($) - White
Median household income ($) - Black or African American
Median household income ($) - Asian
Median household income ($) - Hispanic or Latino
Median household income ($) - American Indian and Alaska Native
Median household income ($) - Multirace
Median household income ($) - Other Race
Median household income for houses/condos with a mortgage ($)
Median household income for apartments without a mortgage ($)
Races - White alone (%)
Races - White alone (% change since 2000)
Races - Black alone (%)
Races - Black alone (% change since 2000)
Races - American Indian alone (%)
Races - American Indian alone (% change since 2000)
Races - Asian alone (%)
Races - Asian alone (% change since 2000)
Races - Hispanic (%)
Races - Hispanic (% change since 2000)
Races - Native Hawaiian and Other Pacific Islander alone (%)
Races - Native Hawaiian and Other Pacific Islander alone (% change since 2000)
Races - Two or more races (%)
Races - Two or more races (% change since 2000)
Races - Other race alone (%)
Races - Other race alone (% change since 2000)
Racial diversity
Unemployment (%)
Unemployment (% change since 2000)
Unemployment (%) - White
Unemployment (%) - Black or African American
Unemployment (%) - Asian
Unemployment (%) - Hispanic or Latino
Unemployment (%) - American Indian and Alaska Native
Unemployment (%) - Multirace
Unemployment (%) - Other Race
Population density (people per square mile)
Population - Males (%)
Population - Females (%)
Population - Males (%) - White
Population - Males (%) - Black or African American
Population - Males (%) - Asian
Population - Males (%) - Hispanic or Latino
Population - Males (%) - American Indian and Alaska Native
Population - Males (%) - Multirace
Population - Males (%) - Other Race
Population - Females (%) - White
Population - Females (%) - Black or African American
Population - Females (%) - Asian
Population - Females (%) - Hispanic or Latino
Population - Females (%) - American Indian and Alaska Native
Population - Females (%) - Multirace
Population - Females (%) - Other Race
Coronavirus confirmed cases (Apr 27, 2024)
Deaths caused by coronavirus (Apr 27, 2024)
Coronavirus confirmed cases (per 100k population) (Apr 27, 2024)
Deaths caused by coronavirus (per 100k population) (Apr 27, 2024)
Daily increase in number of cases (Apr 27, 2024)
Weekly increase in number of cases (Apr 27, 2024)
Cases doubled (in days) (Apr 27, 2024)
Hospitalized patients (Apr 18, 2022)
Negative test results (Apr 18, 2022)
Total test results (Apr 18, 2022)
COVID Vaccine doses distributed (per 100k population) (Sep 19, 2023)
COVID Vaccine doses administered (per 100k population) (Sep 19, 2023)
COVID Vaccine doses distributed (Sep 19, 2023)
COVID Vaccine doses administered (Sep 19, 2023)
Likely homosexual households (%)
Likely homosexual households (% change since 2000)
Likely homosexual households - Lesbian couples (%)
Likely homosexual households - Lesbian couples (% change since 2000)
Likely homosexual households - Gay men (%)
Likely homosexual households - Gay men (% change since 2000)
Cost of living index
Median gross rent ($)
Median contract rent ($)
Median monthly housing costs ($)
Median house or condo value ($)
Median house or condo value ($ change since 2000)
Mean house or condo value by units in structure - 1, detached ($)
Mean house or condo value by units in structure - 1, attached ($)
Mean house or condo value by units in structure - 2 ($)
Mean house or condo value by units in structure by units in structure - 3 or 4 ($)
Mean house or condo value by units in structure - 5 or more ($)
Mean house or condo value by units in structure - Boat, RV, van, etc. ($)
Mean house or condo value by units in structure - Mobile home ($)
Median house or condo value ($) - White
Median house or condo value ($) - Black or African American
Median house or condo value ($) - Asian
Median house or condo value ($) - Hispanic or Latino
Median house or condo value ($) - American Indian and Alaska Native
Median house or condo value ($) - Multirace
Median house or condo value ($) - Other Race
Median resident age
Resident age diversity
Median resident age - Males
Median resident age - Females
Median resident age - White
Median resident age - Black or African American
Median resident age - Asian
Median resident age - Hispanic or Latino
Median resident age - American Indian and Alaska Native
Median resident age - Multirace
Median resident age - Other Race
Median resident age - Males - White
Median resident age - Males - Black or African American
Median resident age - Males - Asian
Median resident age - Males - Hispanic or Latino
Median resident age - Males - American Indian and Alaska Native
Median resident age - Males - Multirace
Median resident age - Males - Other Race
Median resident age - Females - White
Median resident age - Females - Black or African American
Median resident age - Females - Asian
Median resident age - Females - Hispanic or Latino
Median resident age - Females - American Indian and Alaska Native
Median resident age - Females - Multirace
Median resident age - Females - Other Race
Commute - mean travel time to work (minutes)
Travel time to work - Less than 5 minutes (%)
Travel time to work - Less than 5 minutes (% change since 2000)
Travel time to work - 5 to 9 minutes (%)
Travel time to work - 5 to 9 minutes (% change since 2000)
Travel time to work - 10 to 19 minutes (%)
Travel time to work - 10 to 19 minutes (% change since 2000)
Travel time to work - 20 to 29 minutes (%)
Travel time to work - 20 to 29 minutes (% change since 2000)
Travel time to work - 30 to 39 minutes (%)
Travel time to work - 30 to 39 minutes (% change since 2000)
Travel time to work - 40 to 59 minutes (%)
Travel time to work - 40 to 59 minutes (% change since 2000)
Travel time to work - 60 to 89 minutes (%)
Travel time to work - 60 to 89 minutes (% change since 2000)
Travel time to work - 90 or more minutes (%)
Travel time to work - 90 or more minutes (% change since 2000)
Marital status - Never married (%)
Marital status - Now married (%)
Marital status - Separated (%)
Marital status - Widowed (%)
Marital status - Divorced (%)
Median family income ($)
Median family income (% change since 2000)
Median non-family income ($)
Median non-family income (% change since 2000)
Median per capita income ($)
Median per capita income (% change since 2000)
Median family income ($) - White
Median family income ($) - Black or African American
Median family income ($) - Asian
Median family income ($) - Hispanic or Latino
Median family income ($) - American Indian and Alaska Native
Median family income ($) - Multirace
Median family income ($) - Other Race
Median year house/condo built
Median year apartment built
Year house built - Built 2005 or later (%)
Year house built - Built 2000 to 2004 (%)
Year house built - Built 1990 to 1999 (%)
Year house built - Built 1980 to 1989 (%)
Year house built - Built 1970 to 1979 (%)
Year house built - Built 1960 to 1969 (%)
Year house built - Built 1950 to 1959 (%)
Year house built - Built 1940 to 1949 (%)
Year house built - Built 1939 or earlier (%)
Average household size
Household density (households per square mile)
Average household size - White
Average household size - Black or African American
Average household size - Asian
Average household size - Hispanic or Latino
Average household size - American Indian and Alaska Native
Average household size - Multirace
Average household size - Other Race
Occupied housing units (%)
Vacant housing units (%)
Owner occupied housing units (%)
Renter occupied housing units (%)
Vacancy status - For rent (%)
Vacancy status - For sale only (%)
Vacancy status - Rented or sold, not occupied (%)
Vacancy status - For seasonal, recreational, or occasional use (%)
Vacancy status - For migrant workers (%)
Vacancy status - Other vacant (%)
Residents with income below the poverty level (%)
Residents with income below 50% of the poverty level (%)
Children below poverty level (%)
Poor families by family type - Married-couple family (%)
Poor families by family type - Male, no wife present (%)
Poor families by family type - Female, no husband present (%)
Poverty status for native-born residents (%)
Poverty status for foreign-born residents (%)
Poverty among high school graduates not in families (%)
Poverty among people who did not graduate high school not in families (%)
Residents with income below the poverty level (%) - White
Residents with income below the poverty level (%) - Black or African American
Residents with income below the poverty level (%) - Asian
Residents with income below the poverty level (%) - Hispanic or Latino
Residents with income below the poverty level (%) - American Indian and Alaska Native
Residents with income below the poverty level (%) - Multirace
Residents with income below the poverty level (%) - Other Race
Air pollution - Air Quality Index (AQI)
Air pollution - CO
Air pollution - NO2
Air pollution - SO2
Air pollution - Ozone
Air pollution - PM10
Air pollution - PM25
Air pollution - Pb
Crime - Murders per 100,000 population
Crime - Rapes per 100,000 population
Crime - Robberies per 100,000 population
Crime - Assaults per 100,000 population
Crime - Burglaries per 100,000 population
Crime - Thefts per 100,000 population
Crime - Auto thefts per 100,000 population
Crime - Arson per 100,000 population
Crime - City-data.com crime index
Crime - Violent crime index
Crime - Property crime index
Crime - Murders per 100,000 population (5 year average)
Crime - Rapes per 100,000 population (5 year average)
Crime - Robberies per 100,000 population (5 year average)
Crime - Assaults per 100,000 population (5 year average)
Crime - Burglaries per 100,000 population (5 year average)
Crime - Thefts per 100,000 population (5 year average)
Crime - Auto thefts per 100,000 population (5 year average)
Crime - Arson per 100,000 population (5 year average)
Crime - City-data.com crime index (5 year average)
Crime - Violent crime index (5 year average)
Crime - Property crime index (5 year average)
1996 Presidential Elections Results (%) - Democratic Party (Clinton)
1996 Presidential Elections Results (%) - Republican Party (Dole)
1996 Presidential Elections Results (%) - Other
2000 Presidential Elections Results (%) - Democratic Party (Gore)
2000 Presidential Elections Results (%) - Republican Party (Bush)
2000 Presidential Elections Results (%) - Other
2004 Presidential Elections Results (%) - Democratic Party (Kerry)
2004 Presidential Elections Results (%) - Republican Party (Bush)
2004 Presidential Elections Results (%) - Other
2008 Presidential Elections Results (%) - Democratic Party (Obama)
2008 Presidential Elections Results (%) - Republican Party (McCain)
2008 Presidential Elections Results (%) - Other
2012 Presidential Elections Results (%) - Democratic Party (Obama)
2012 Presidential Elections Results (%) - Republican Party (Romney)
2012 Presidential Elections Results (%) - Other
2016 Presidential Elections Results (%) - Democratic Party (Clinton)
2016 Presidential Elections Results (%) - Republican Party (Trump)
2016 Presidential Elections Results (%) - Other
2020 Presidential Elections Results (%) - Democratic Party (Biden)
2020 Presidential Elections Results (%) - Republican Party (Trump)
2020 Presidential Elections Results (%) - Other
Ancestries Reported - Arab (%)
Ancestries Reported - Czech (%)
Ancestries Reported - Danish (%)
Ancestries Reported - Dutch (%)
Ancestries Reported - English (%)
Ancestries Reported - French (%)
Ancestries Reported - French Canadian (%)
Ancestries Reported - German (%)
Ancestries Reported - Greek (%)
Ancestries Reported - Hungarian (%)
Ancestries Reported - Irish (%)
Ancestries Reported - Italian (%)
Ancestries Reported - Lithuanian (%)
Ancestries Reported - Norwegian (%)
Ancestries Reported - Polish (%)
Ancestries Reported - Portuguese (%)
Ancestries Reported - Russian (%)
Ancestries Reported - Scotch-Irish (%)
Ancestries Reported - Scottish (%)
Ancestries Reported - Slovak (%)
Ancestries Reported - Subsaharan African (%)
Ancestries Reported - Swedish (%)
Ancestries Reported - Swiss (%)
Ancestries Reported - Ukrainian (%)
Ancestries Reported - United States (%)
Ancestries Reported - Welsh (%)
Ancestries Reported - West Indian (%)
Ancestries Reported - Other (%)
Educational Attainment - No schooling completed (%)
Educational Attainment - Less than high school (%)
Educational Attainment - High school or equivalent (%)
Educational Attainment - Less than 1 year of college (%)
Educational Attainment - 1 or more years of college (%)
Educational Attainment - Associate degree (%)
Educational Attainment - Bachelor's degree (%)
Educational Attainment - Master's degree (%)
Educational Attainment - Professional school degree (%)
Educational Attainment - Doctorate degree (%)
School Enrollment - Nursery, preschool (%)
School Enrollment - Kindergarten (%)
School Enrollment - Grade 1 to 4 (%)
School Enrollment - Grade 5 to 8 (%)
School Enrollment - Grade 9 to 12 (%)
School Enrollment - College undergrad (%)
School Enrollment - Graduate or professional (%)
School Enrollment - Not enrolled in school (%)
School enrollment - Public schools (%)
School enrollment - Private schools (%)
School enrollment - Not enrolled (%)
Median number of rooms in houses and condos
Median number of rooms in apartments
Housing units lacking complete plumbing facilities (%)
Housing units lacking complete kitchen facilities (%)
Density of houses
Urban houses (%)
Rural houses (%)
Households with people 60 years and over (%)
Households with people 65 years and over (%)
Households with people 75 years and over (%)
Households with one or more nonrelatives (%)
Households with no nonrelatives (%)
Population in households (%)
Family households (%)
Nonfamily households (%)
Population in families (%)
Family households with own children (%)
Median number of bedrooms in owner occupied houses
Mean number of bedrooms in owner occupied houses
Median number of bedrooms in renter occupied houses
Mean number of bedrooms in renter occupied houses
Median number of vehichles in owner occupied houses
Mean number of vehichles in owner occupied houses
Median number of vehichles in renter occupied houses
Mean number of vehichles in renter occupied houses
Mortgage status - with mortgage (%)
Mortgage status - with second mortgage (%)
Mortgage status - with home equity loan (%)
Mortgage status - with both second mortgage and home equity loan (%)
Mortgage status - without a mortgage (%)
Average family size
Average family size - White
Average family size - Black or African American
Average family size - Asian
Average family size - Hispanic or Latino
Average family size - American Indian and Alaska Native
Average family size - Multirace
Average family size - Other Race
Geographical mobility - Same house 1 year ago (%)
Geographical mobility - Moved within same county (%)
Geographical mobility - Moved from different county within same state (%)
Geographical mobility - Moved from different state (%)
Geographical mobility - Moved from abroad (%)
Place of birth - Born in state of residence (%)
Place of birth - Born in other state (%)
Place of birth - Native, outside of US (%)
Place of birth - Foreign born (%)
Housing units in structures - 1, detached (%)
Housing units in structures - 1, attached (%)
Housing units in structures - 2 (%)
Housing units in structures - 3 or 4 (%)
Housing units in structures - 5 to 9 (%)
Housing units in structures - 10 to 19 (%)
Housing units in structures - 20 to 49 (%)
Housing units in structures - 50 or more (%)
Housing units in structures - Mobile home (%)
Housing units in structures - Boat, RV, van, etc. (%)
House/condo owner moved in on average (years ago)
Renter moved in on average (years ago)
Year householder moved into unit - Moved in 1999 to March 2000 (%)
Year householder moved into unit - Moved in 1995 to 1998 (%)
Year householder moved into unit - Moved in 1990 to 1994 (%)
Year householder moved into unit - Moved in 1980 to 1989 (%)
Year householder moved into unit - Moved in 1970 to 1979 (%)
Year householder moved into unit - Moved in 1969 or earlier (%)
Means of transportation to work - Drove car alone (%)
Means of transportation to work - Carpooled (%)
Means of transportation to work - Public transportation (%)
Means of transportation to work - Bus or trolley bus (%)
Means of transportation to work - Streetcar or trolley car (%)
Means of transportation to work - Subway or elevated (%)
Means of transportation to work - Railroad (%)
Means of transportation to work - Ferryboat (%)
Means of transportation to work - Taxicab (%)
Means of transportation to work - Motorcycle (%)
Means of transportation to work - Bicycle (%)
Means of transportation to work - Walked (%)
Means of transportation to work - Other means (%)
Working at home (%)
Industry diversity
Most Common Industries - Agriculture, forestry, fishing and hunting, and mining (%)
Most Common Industries - Agriculture, forestry, fishing and hunting (%)
Most Common Industries - Mining, quarrying, and oil and gas extraction (%)
Most Common Industries - Construction (%)
Most Common Industries - Manufacturing (%)
Most Common Industries - Wholesale trade (%)
Most Common Industries - Retail trade (%)
Most Common Industries - Transportation and warehousing, and utilities (%)
Most Common Industries - Transportation and warehousing (%)
Most Common Industries - Utilities (%)
Most Common Industries - Information (%)
Most Common Industries - Finance and insurance, and real estate and rental and leasing (%)
Most Common Industries - Finance and insurance (%)
Most Common Industries - Real estate and rental and leasing (%)
Most Common Industries - Professional, scientific, and management, and administrative and waste management services (%)
Most Common Industries - Professional, scientific, and technical services (%)
Most Common Industries - Management of companies and enterprises (%)
Most Common Industries - Administrative and support and waste management services (%)
Most Common Industries - Educational services, and health care and social assistance (%)
Most Common Industries - Educational services (%)
Most Common Industries - Health care and social assistance (%)
Most Common Industries - Arts, entertainment, and recreation, and accommodation and food services (%)
Most Common Industries - Arts, entertainment, and recreation (%)
Most Common Industries - Accommodation and food services (%)
Most Common Industries - Other services, except public administration (%)
Most Common Industries - Public administration (%)
Occupation diversity
Most Common Occupations - Management, business, science, and arts occupations (%)
Most Common Occupations - Management, business, and financial occupations (%)
Most Common Occupations - Management occupations (%)
Most Common Occupations - Business and financial operations occupations (%)
Most Common Occupations - Computer, engineering, and science occupations (%)
Most Common Occupations - Computer and mathematical occupations (%)
Most Common Occupations - Architecture and engineering occupations (%)
Most Common Occupations - Life, physical, and social science occupations (%)
Most Common Occupations - Education, legal, community service, arts, and media occupations (%)
Most Common Occupations - Community and social service occupations (%)
Most Common Occupations - Legal occupations (%)
Most Common Occupations - Education, training, and library occupations (%)
Most Common Occupations - Arts, design, entertainment, sports, and media occupations (%)
Most Common Occupations - Healthcare practitioners and technical occupations (%)
Most Common Occupations - Health diagnosing and treating practitioners and other technical occupations (%)
Most Common Occupations - Health technologists and technicians (%)
Most Common Occupations - Service occupations (%)
Most Common Occupations - Healthcare support occupations (%)
Most Common Occupations - Protective service occupations (%)
Most Common Occupations - Fire fighting and prevention, and other protective service workers including supervisors (%)
Most Common Occupations - Law enforcement workers including supervisors (%)
Most Common Occupations - Food preparation and serving related occupations (%)
Most Common Occupations - Building and grounds cleaning and maintenance occupations (%)
Most Common Occupations - Personal care and service occupations (%)
Most Common Occupations - Sales and office occupations (%)
Most Common Occupations - Sales and related occupations (%)
Most Common Occupations - Office and administrative support occupations (%)
Most Common Occupations - Natural resources, construction, and maintenance occupations (%)
Most Common Occupations - Farming, fishing, and forestry occupations (%)
Most Common Occupations - Construction and extraction occupations (%)
Most Common Occupations - Installation, maintenance, and repair occupations (%)
Most Common Occupations - Production, transportation, and material moving occupations (%)
Most Common Occupations - Production occupations (%)
Most Common Occupations - Transportation occupations (%)
Most Common Occupations - Material moving occupations (%)
People in Group quarters - Institutionalized population (%)
People in Group quarters - Correctional institutions (%)
People in Group quarters - Federal prisons and detention centers (%)
People in Group quarters - Halfway houses (%)
People in Group quarters - Local jails and other confinement facilities (including police lockups) (%)
People in Group quarters - Military disciplinary barracks (%)
People in Group quarters - State prisons (%)
People in Group quarters - Other types of correctional institutions (%)
People in Group quarters - Nursing homes (%)
People in Group quarters - Hospitals/wards, hospices, and schools for the handicapped (%)
People in Group quarters - Hospitals/wards and hospices for chronically ill (%)
People in Group quarters - Hospices or homes for chronically ill (%)
People in Group quarters - Military hospitals or wards for chronically ill (%)
People in Group quarters - Other hospitals or wards for chronically ill (%)
People in Group quarters - Hospitals or wards for drug/alcohol abuse (%)
People in Group quarters - Mental (Psychiatric) hospitals or wards (%)
People in Group quarters - Schools, hospitals, or wards for the mentally retarded (%)
People in Group quarters - Schools, hospitals, or wards for the physically handicapped (%)
People in Group quarters - Institutions for the deaf (%)
People in Group quarters - Institutions for the blind (%)
People in Group quarters - Orthopedic wards and institutions for the physically handicapped (%)
People in Group quarters - Wards in general hospitals for patients who have no usual home elsewhere (%)
People in Group quarters - Wards in military hospitals for patients who have no usual home elsewhere (%)
People in Group quarters - Juvenile institutions (%)
People in Group quarters - Long-term care (%)
People in Group quarters - Homes for abused, dependent, and neglected children (%)
People in Group quarters - Residential treatment centers for emotionally disturbed children (%)
People in Group quarters - Training schools for juvenile delinquents (%)
People in Group quarters - Short-term care, detention or diagnostic centers for delinquent children (%)
People in Group quarters - Type of juvenile institution unknown (%)
People in Group quarters - Noninstitutionalized population (%)
People in Group quarters - College dormitories (includes college quarters off campus) (%)
People in Group quarters - Military quarters (%)
People in Group quarters - On base (%)
People in Group quarters - Barracks, unaccompanied personnel housing (UPH), (Enlisted/Officer), ;and similar group living quarters for military personnel (%)
People in Group quarters - Transient quarters for temporary residents (%)
People in Group quarters - Military ships (%)
People in Group quarters - Group homes (%)
People in Group quarters - Homes or halfway houses for drug/alcohol abuse (%)
People in Group quarters - Homes for the mentally ill (%)
People in Group quarters - Homes for the mentally retarded (%)
People in Group quarters - Homes for the physically handicapped (%)
People in Group quarters - Other group homes (%)
People in Group quarters - Religious group quarters (%)
People in Group quarters - Dormitories (%)
People in Group quarters - Agriculture workers' dormitories on farms (%)
People in Group quarters - Job Corps and vocational training facilities (%)
People in Group quarters - Other workers' dormitories (%)
People in Group quarters - Crews of maritime vessels (%)
People in Group quarters - Other nonhousehold living situations (%)
People in Group quarters - Other noninstitutional group quarters (%)
Residents speaking English at home (%)
Residents speaking English at home - Born in the United States (%)
Residents speaking English at home - Native, born elsewhere (%)
Residents speaking English at home - Foreign born (%)
Residents speaking Spanish at home (%)
Residents speaking Spanish at home - Born in the United States (%)
Residents speaking Spanish at home - Native, born elsewhere (%)
Residents speaking Spanish at home - Foreign born (%)
Residents speaking other language at home (%)
Residents speaking other language at home - Born in the United States (%)
Residents speaking other language at home - Native, born elsewhere (%)
Residents speaking other language at home - Foreign born (%)
Class of Workers - Employee of private company (%)
Class of Workers - Self-employed in own incorporated business (%)
Class of Workers - Private not-for-profit wage and salary workers (%)
Class of Workers - Local government workers (%)
Class of Workers - State government workers (%)
Class of Workers - Federal government workers (%)
Class of Workers - Self-employed workers in own not incorporated business and Unpaid family workers (%)
House heating fuel used in houses and condos - Utility gas (%)
House heating fuel used in houses and condos - Bottled, tank, or LP gas (%)
House heating fuel used in houses and condos - Electricity (%)
House heating fuel used in houses and condos - Fuel oil, kerosene, etc. (%)
House heating fuel used in houses and condos - Coal or coke (%)
House heating fuel used in houses and condos - Wood (%)
House heating fuel used in houses and condos - Solar energy (%)
House heating fuel used in houses and condos - Other fuel (%)
House heating fuel used in houses and condos - No fuel used (%)
House heating fuel used in apartments - Utility gas (%)
House heating fuel used in apartments - Bottled, tank, or LP gas (%)
House heating fuel used in apartments - Electricity (%)
House heating fuel used in apartments - Fuel oil, kerosene, etc. (%)
House heating fuel used in apartments - Coal or coke (%)
House heating fuel used in apartments - Wood (%)
House heating fuel used in apartments - Solar energy (%)
House heating fuel used in apartments - Other fuel (%)
House heating fuel used in apartments - No fuel used (%)
Armed forces status - In Armed Forces (%)
Armed forces status - Civilian (%)
Armed forces status - Civilian - Veteran (%)
Armed forces status - Civilian - Nonveteran (%)
Fatal accidents locations in years 2005-2021
Fatal accidents locations in 2005
Fatal accidents locations in 2006
Fatal accidents locations in 2007
Fatal accidents locations in 2008
Fatal accidents locations in 2009
Fatal accidents locations in 2010
Fatal accidents locations in 2011
Fatal accidents locations in 2012
Fatal accidents locations in 2013
Fatal accidents locations in 2014
Fatal accidents locations in 2015
Fatal accidents locations in 2016
Fatal accidents locations in 2017
Fatal accidents locations in 2018
Fatal accidents locations in 2019
Fatal accidents locations in 2020
Fatal accidents locations in 2021
Alcohol use - People drinking some alcohol every month (%)
Alcohol use - People not drinking at all (%)
Alcohol use - Average days/month drinking alcohol
Alcohol use - Average drinks/week
Alcohol use - Average days/year people drink much
Audiometry - Average condition of hearing (%)
Audiometry - People that can hear a whisper from across a quiet room (%)
Audiometry - People that can hear normal voice from across a quiet room (%)
Audiometry - Ears ringing, roaring, buzzing (%)
Audiometry - Had a job exposure to loud noise (%)
Audiometry - Had off-work exposure to loud noise (%)
Blood Pressure & Cholesterol - Has high blood pressure (%)
Blood Pressure & Cholesterol - Checking blood pressure at home (%)
Blood Pressure & Cholesterol - Frequently checking blood cholesterol (%)
Blood Pressure & Cholesterol - Has high cholesterol level (%)
Consumer Behavior - Money monthly spent on food at supermarket/grocery store
Consumer Behavior - Money monthly spent on food at other stores
Consumer Behavior - Money monthly spent on eating out
Consumer Behavior - Money monthly spent on carryout/delivered foods
Consumer Behavior - Income spent on food at supermarket/grocery store (%)
Consumer Behavior - Income spent on food at other stores (%)
Consumer Behavior - Income spent on eating out (%)
Consumer Behavior - Income spent on carryout/delivered foods (%)
Current Health Status - General health condition (%)
Current Health Status - Blood donors (%)
Current Health Status - Has blood ever tested for HIV virus (%)
Current Health Status - Left-handed people (%)
Dermatology - People using sunscreen (%)
Diabetes - Diabetics (%)
Diabetes - Had a blood test for high blood sugar (%)
Diabetes - People taking insulin (%)
Diet Behavior & Nutrition - Diet health (%)
Diet Behavior & Nutrition - Milk product consumption (# of products/month)
Diet Behavior & Nutrition - Meals not home prepared (#/week)
Diet Behavior & Nutrition - Meals from fast food or pizza place (#/week)
Diet Behavior & Nutrition - Ready-to-eat foods (#/month)
Diet Behavior & Nutrition - Frozen meals/pizza (#/month)
Drug Use - People that ever used marijuana or hashish (%)
Drug Use - Ever used hard drugs (%)
Drug Use - Ever used any form of cocaine (%)
Drug Use - Ever used heroin (%)
Drug Use - Ever used methamphetamine (%)
Health Insurance - People covered by health insurance (%)
Kidney Conditions-Urology - Avg. # of times urinating at night
Medical Conditions - People with asthma (%)
Medical Conditions - People with anemia (%)
Medical Conditions - People with psoriasis (%)
Medical Conditions - People with overweight (%)
Medical Conditions - Elderly people having difficulties in thinking or remembering (%)
Medical Conditions - People who ever received blood transfusion (%)
Medical Conditions - People having trouble seeing even with glass/contacts (%)
Medical Conditions - People with arthritis (%)
Medical Conditions - People with gout (%)
Medical Conditions - People with congestive heart failure (%)
Medical Conditions - People with coronary heart disease (%)
Medical Conditions - People with angina pectoris (%)
Medical Conditions - People who ever had heart attack (%)
Medical Conditions - People who ever had stroke (%)
Medical Conditions - People with emphysema (%)
Medical Conditions - People with thyroid problem (%)
Medical Conditions - People with chronic bronchitis (%)
Medical Conditions - People with any liver condition (%)
Medical Conditions - People who ever had cancer or malignancy (%)
Mental Health - People who have little interest in doing things (%)
Mental Health - People feeling down, depressed, or hopeless (%)
Mental Health - People who have trouble sleeping or sleeping too much (%)
Mental Health - People feeling tired or having little energy (%)
Mental Health - People with poor appetite or overeating (%)
Mental Health - People feeling bad about themself (%)
Mental Health - People who have trouble concentrating on things (%)
Mental Health - People moving or speaking slowly or too fast (%)
Mental Health - People having thoughts they would be better off dead (%)
Oral Health - Average years since last visit a dentist
Oral Health - People embarrassed because of mouth (%)
Oral Health - People with gum disease (%)
Oral Health - General health of teeth and gums (%)
Oral Health - Average days a week using dental floss/device
Oral Health - Average days a week using mouthwash for dental problem
Oral Health - Average number of teeth
Pesticide Use - Households using pesticides to control insects (%)
Pesticide Use - Households using pesticides to kill weeds (%)
Physical Activity - People doing vigorous-intensity work activities (%)
Physical Activity - People doing moderate-intensity work activities (%)
Physical Activity - People walking or bicycling (%)
Physical Activity - People doing vigorous-intensity recreational activities (%)
Physical Activity - People doing moderate-intensity recreational activities (%)
Physical Activity - Average hours a day doing sedentary activities
Physical Activity - Average hours a day watching TV or videos
Physical Activity - Average hours a day using computer
Physical Functioning - People having limitations keeping them from working (%)
Physical Functioning - People limited in amount of work they can do (%)
Physical Functioning - People that need special equipment to walk (%)
Physical Functioning - People experiencing confusion/memory problems (%)
Physical Functioning - People requiring special healthcare equipment (%)
Prescription Medications - Average number of prescription medicines taking
Preventive Aspirin Use - Adults 40+ taking low-dose aspirin (%)
Reproductive Health - Vaginal deliveries (%)
Reproductive Health - Cesarean deliveries (%)
Reproductive Health - Deliveries resulted in a live birth (%)
Reproductive Health - Pregnancies resulted in a delivery (%)
Reproductive Health - Women breastfeeding newborns (%)
Reproductive Health - Women that had a hysterectomy (%)
Reproductive Health - Women that had both ovaries removed (%)
Reproductive Health - Women that have ever taken birth control pills (%)
Reproductive Health - Women taking birth control pills (%)
Reproductive Health - Women that have ever used Depo-Provera or injectables (%)
Reproductive Health - Women that have ever used female hormones (%)
Sexual Behavior - People 18+ that ever had sex (vaginal, anal, or oral) (%)
Sexual Behavior - Males 18+ that ever had vaginal sex with a woman (%)
Sexual Behavior - Males 18+ that ever performed oral sex on a woman (%)
Sexual Behavior - Males 18+ that ever had anal sex with a woman (%)
Sexual Behavior - Males 18+ that ever had any sex with a man (%)
Sexual Behavior - Females 18+ that ever had vaginal sex with a man (%)
Sexual Behavior - Females 18+ that ever performed oral sex on a man (%)
Sexual Behavior - Females 18+ that ever had anal sex with a man (%)
Sexual Behavior - Females 18+ that ever had any kind of sex with a woman (%)
Sexual Behavior - Average age people first had sex
Sexual Behavior - Average number of female sex partners in lifetime (males 18+)
Sexual Behavior - Average number of female vaginal sex partners in lifetime (males 18+)
Sexual Behavior - Average age people first performed oral sex on a woman (18+)
Sexual Behavior - Average number of woman performed oral sex on in lifetime (18+)
Sexual Behavior - Average number of male sex partners in lifetime (males 18+)
Sexual Behavior - Average number of male anal sex partners in lifetime (males 18+)
Sexual Behavior - Average age people first performed oral sex on a man (18+)
Sexual Behavior - Average number of male oral sex partners in lifetime (18+)
Sexual Behavior - People using protection when performing oral sex (%)
Sexual Behavior - Average number of times people have vaginal or anal sex a year
Sexual Behavior - People having sex without condom (%)
Sexual Behavior - Average number of male sex partners in lifetime (females 18+)
Sexual Behavior - Average number of male vaginal sex partners in lifetime (females 18+)
Sexual Behavior - Average number of female sex partners in lifetime (females 18+)
Sexual Behavior - Circumcised males 18+ (%)
Sleep Disorders - Average hours sleeping at night
Sleep Disorders - People that has trouble sleeping (%)
Smoking-Cigarette Use - People smoking cigarettes (%)
Taste & Smell - People 40+ having problems with smell (%)
Taste & Smell - People 40+ having problems with taste (%)
Taste & Smell - People 40+ that ever had wisdom teeth removed (%)
Taste & Smell - People 40+ that ever had tonsils teeth removed (%)
Taste & Smell - People 40+ that ever had a loss of consciousness because of a head injury (%)
Taste & Smell - People 40+ that ever had a broken nose or other serious injury to face or skull (%)
Taste & Smell - People 40+ that ever had two or more sinus infections (%)
Weight - Average height (inches)
Weight - Average weight (pounds)
Weight - Average BMI
Weight - People that are obese (%)
Weight - People that ever were obese (%)
Weight - People trying to lose weight (%)
Urban population: 13,579
Rural population: 963
Estimated median house/condo value in 2022: $100,770
45804:
$100,770Ohio:
$204,100
Median resident age: This zip code:
40.2 yearsOhio median age:
39.9 years
Average household size: This zip code:
2.3 peopleOhio:
2.4 people
Averages for the 2020 tax year for zip code 45804, filed in 2021:
Average Adjusted Gross Income (AGI) in 2020: $36,535 (Individual Income Tax Returns) Here:
$36,535State:
$67,288
Salary/wage: $31,125 (reported on 85.4% of returns )Here:
$31,125State:
$55,628
(% of AGI for various income ranges: 1080.4% for AGIs below $25k , 3370.3% for AGIs $25k-50k , 5812.5% for AGIs $50k-75k , 8606.8% for AGIs $75k-100k , 13863.0% for AGIs $100k-200k ) Taxable interest for individuals: $612 (reported on 14.0% of returns )This zip code:
$612Ohio:
$1,518
(% of AGI for various income ranges: 5.5% for AGIs below $25k , 7.2% for AGIs $25k-50k , 14.6% for AGIs $50k-75k , 28.0% for AGIs $75k-100k , 67.0% for AGIs $100k-200k ) Ordinary dividends: $2,656 (reported on 8.5% of returns )(% of AGI for various income ranges: 9.4% for AGIs below $25k , 13.1% for AGIs $25k-50k , 27.3% for AGIs $50k-75k , 122.0% for AGIs $75k-100k , 267.0% for AGIs $100k-200k ) Net capital gain/loss in AGI: +$5,451 (reported on 6.7% of returns )Here:
+$5,451State:
+$18,919
(% of AGI for various income ranges: 2.7% for AGIs below $25k , 9.4% for AGIs $25k-50k , 41.5% for AGIs $50k-75k , 201.6% for AGIs $75k-100k , 682.5% for AGIs $100k-200k ) Profit/loss from business: +$7,725 (reported on 9.2% of returns )Here:
+$7,725State:
+$13,744
(% of AGI for various income ranges: 56.4% for AGIs below $25k , 27.4% for AGIs $25k-50k , 116.6% for AGIs $50k-75k , 200.0% for AGIs $75k-100k , 738.5% for AGIs $100k-200k ) Taxable individual retirement arrangement distribution: $14,689 (reported on 5.7% of returns )45804:
$14,689Ohio:
$18,876
(% of AGI for various income ranges: 26.8% for AGIs below $25k , 61.5% for AGIs $25k-50k , 203.4% for AGIs $50k-75k , 275.2% for AGIs $75k-100k , 907.5% for AGIs $100k-200k ) Total itemized deductions: $26,138 (reported on 1.2% of returns )Here:
$26,138State:
$33,869
(% of AGI for various income ranges: 25.5% for AGIs below $25k , 124.4% for AGIs $50k-75k , 357.0% for AGIs $100k-200k ) Charity contributions: $8,940 (reported on 0.8% of returns )(% of AGI for various income ranges: 3.4% for AGIs below $25k , 144.4% for AGIs $75k-100k ) Taxes paid: $3,912 (reported on 1.2% of returns )(% of AGI for various income ranges: 1.9% for AGIs below $25k , 17.1% for AGIs $50k-75k , 82.5% for AGIs $100k-200k ) Earned income credit: $2,631 (reported on 30.0% of returns )(% of AGI for various income ranges: 141.3% for AGIs below $25k , 88.1% for AGIs $25k-50k ) Percentage of individuals using paid preparers for their 2020 taxes: 95.0%(% for various income ranges: 94.4% for AGIs below $25k , 96.0% for AGIs $25k-50k , 94.6% for AGIs $50k-75k , 94.3% for AGIs $75k-100k , 96.7% for AGIs $100k-200k , 100.0% for AGIs over 200k )
Averages for the 2012 tax year for zip code 45804, filed in 2013:
Average Adjusted Gross Income (AGI) in 2012: $29,837 (Individual Income Tax Returns) Here:
$29,837State:
$54,926
Salary/wage: $26,090 (reported on 86.3% of returns )Here:
$26,090State:
$45,869
(% of AGI for various income ranges: 77.7% for AGIs below $25k , 79.1% for AGIs $25k-50k , 77.2% for AGIs $50k-75k , 73.5% for AGIs $75k-100k , 65.0% for AGIs $100k-200k ) Taxable interest for individuals: $822 (reported on 16.2% of returns )This zip code:
$822Ohio:
$1,297
(% of AGI for various income ranges: 0.5% for AGIs below $25k , 0.4% for AGIs $25k-50k , 0.5% for AGIs $50k-75k , 0.5% for AGIs $75k-100k , 0.2% for AGIs $100k-200k ) Ordinary dividends: $2,267 (reported on 10.4% of returns )(% of AGI for various income ranges: 0.6% for AGIs below $25k , 0.7% for AGIs $25k-50k , 0.7% for AGIs $50k-75k , 1.3% for AGIs $75k-100k , 1.0% for AGIs $100k-200k ) Net capital gain/loss in AGI: +$2,543 (reported on 6.9% of returns )Here:
+$2,543State:
+$11,232
(% of AGI for various income ranges: 0.2% for AGIs $25k-50k , 0.1% for AGIs $50k-75k , 0.6% for AGIs $75k-100k , 2.9% for AGIs $100k-200k ) Profit/loss from business: +$8,227 (reported on 10.1% of returns )Here:
+$8,227State:
+$12,773
(% of AGI for various income ranges: 5.3% for AGIs below $25k , 1.3% for AGIs $25k-50k , 2.2% for AGIs $50k-75k , 0.7% for AGIs $75k-100k , 3.7% for AGIs $100k-200k ) Taxable individual retirement arrangement distribution: $10,650 (reported on 6.9% of returns )45804:
$10,650Ohio:
$14,511
(% of AGI for various income ranges: 1.5% for AGIs below $25k , 2.0% for AGIs $25k-50k , 2.4% for AGIs $50k-75k , 4.3% for AGIs $75k-100k , 3.5% for AGIs $100k-200k ) Total itemized deductions: $15,835 (21% of AGI, reported on 9.8% of returns )Here:
$15,835State:
$21,278
Here:
20.9% of AGIState:
18.8% of AGI
(% of AGI for various income ranges: 2.3% for AGIs below $25k , 3.7% for AGIs $25k-50k , 5.7% for AGIs $50k-75k , 8.1% for AGIs $75k-100k , 9.5% for AGIs $100k-200k ) Charity contributions: $4,420 (reported on 6.9% of returns )(% of AGI for various income ranges: 0.3% for AGIs below $25k , 0.6% for AGIs $25k-50k , 1.1% for AGIs $50k-75k , 1.9% for AGIs $75k-100k , 2.2% for AGIs $100k-200k ) Taxes paid: $4,761 (reported on 9.6% of returns )(% of AGI for various income ranges: 0.2% for AGIs below $25k , 0.8% for AGIs $25k-50k , 1.4% for AGIs $50k-75k , 2.3% for AGIs $75k-100k , 4.4% for AGIs $100k-200k ) Earned income credit: $2,569 (reported on 36.1% of returns )(% of AGI for various income ranges: 11.1% for AGIs below $25k , 1.4% for AGIs $25k-50k ) Percentage of individuals using paid preparers for their 2012 taxes: 47.9%(% for various income ranges: 42.4% for AGIs below $25k , 51.3% for AGIs $25k-50k , 61.0% for AGIs $50k-75k , 61.5% for AGIs $75k-100k , 70.0% for AGIs $100k-200k )
Averages for the 2004 tax year for zip code 45804, filed in 2005:
Average Adjusted Gross Income (AGI) in 2004: $27,212 (Individual Income Tax Returns) Here:
$27,212State:
$44,480
Salary/wage: $24,422 (reported on 88.4% of returns )Here:
$24,422State:
$39,198
(% of AGI for various income ranges: 88.4% for AGIs below $10k , 79.7% for AGIs $10k-25k , 81.3% for AGIs $25k-50k , 82.9% for AGIs $50k-75k , 81.5% for AGIs $75k-100k , 60.9% for AGIs over 100k ) Taxable interest for individuals: $1,063 (reported on 26.7% of returns )This zip code:
$1,063Ohio:
$1,532
(% of AGI for various income ranges: 1.6% for AGIs below $10k , 1.3% for AGIs $10k-25k , 0.9% for AGIs $25k-50k , 1.0% for AGIs $50k-75k , 0.8% for AGIs $75k-100k , 1.0% for AGIs over 100k ) Taxable dividends: $1,932 (reported on 12.9% of returns )(% of AGI for various income ranges: 0.8% for AGIs below $10k , 0.5% for AGIs $10k-25k , 0.5% for AGIs $25k-50k , 0.8% for AGIs $50k-75k , 1.2% for AGIs $75k-100k , 2.8% for AGIs over 100k ) Net capital gain/loss: +$3,903 (reported on 8.4% of returns )Here:
+$3,903State:
+$8,582
(% of AGI for various income ranges: -0.7% for AGIs below $10k , 0.0% for AGIs $10k-25k , 0.4% for AGIs $25k-50k , 0.7% for AGIs $50k-75k , 1.8% for AGIs $75k-100k , 6.9% for AGIs over 100k ) Profit/loss from business: +$6,029 (reported on 8.4% of returns )Here:
+$6,029State:
+$10,813
(% of AGI for various income ranges: 3.3% for AGIs below $10k , 2.2% for AGIs $10k-25k , 2.0% for AGIs $25k-50k , 1.1% for AGIs $50k-75k , 1.5% for AGIs $75k-100k , 2.2% for AGIs over 100k ) IRA payment deduction: $2,099 (reported on 1.5% of returns )(% of AGI for various income ranges: 0.1% for AGIs $10k-25k , 0.1% for AGIs $25k-50k , 0.1% for AGIs $50k-75k , 0.3% for AGIs $75k-100k ) Total itemized deductions: $13,948 (21% of AGI, reported on 12.9% of returns )Here:
$13,948State:
$17,503
Here:
21.4% of AGIState:
20.8% of AGI
(% of AGI for various income ranges: 2.2% for AGIs below $10k , 2.6% for AGIs $10k-25k , 5.0% for AGIs $25k-50k , 7.7% for AGIs $50k-75k , 11.3% for AGIs $75k-100k , 14.5% for AGIs over 100k ) Charity contributions deductions: $3,169 (5% of AGI, reported on 10.5% of returns )Here:
4.5% of AGIState:
3.4% of AGI
(% of AGI for various income ranges: 0.2% for AGIs below $10k , 0.3% for AGIs $10k-25k , 0.9% for AGIs $25k-50k , 1.4% for AGIs $50k-75k , 2.4% for AGIs $75k-100k , 2.8% for AGIs over 100k ) Total tax: $3,476 (reported on 61.5% of returns )(% of AGI for various income ranges: 1.5% for AGIs below $10k , 3.1% for AGIs $10k-25k , 6.5% for AGIs $25k-50k , 9.9% for AGIs $50k-75k , 11.0% for AGIs $75k-100k , 16.6% for AGIs over 100k ) Earned income credit: $1,879 (reported on 31.2% of returns )Percentage of individuals using paid preparers for their 2004 taxes: 62.0%(% for various income ranges: 54.7% for AGIs below $10k , 65.9% for AGIs $10k-25k , 64.5% for AGIs $25k-50k , 60.9% for AGIs $50k-75k , 62.2% for AGIs $75k-100k , 73.0% for AGIs over 100k )
Estimated median household income in 2022: This zip code:
$40,749Ohio:
$65,720
Nearest zip codes: 45801 ,
45806 ,
45805 ,
45888 ,
45854 ,
45820 .
Lima Zip Code Map
Percentage of family households: This zip code:
39.9%Ohio:
43.3%
Percentage of households with unmarried partners: This zip code:
10.5%Ohio:
44.6%
Likely homosexual households (counted as self-reported same-sex unmarried-partner households)
Lesbian couples: 0.0% of all households Gay men: 0.2% of all households
Household received Food Stamps/SNAP in the past 12 months: 1,705Household did not receive Food Stamps/SNAP in the past 12 months: 4,450
Women who had a birth in the past 12 months: 141 (26 now married , 110 unmarried) Women who did not have a birth in the past 12 months: 3,040 (960 now married , 2,080 unmarried)
Housing units in zip code 45804 with a mortgage: 1,463 (105
second mortgage , 104
both second mortgage and home equity loan )
Houses without a mortgage: 86
Median monthly owner costs for units with a mortgage: $872
Median monthly owner costs for units without a mortgage: $434
Residents with income below the poverty level in 2022:
This zip code:
25.3%Whole state:
13.4%
Residents with income below 50% of the poverty level in 2022:
This zip code:
12.4%Whole state:
7.0%
Median number of rooms in houses and condos: Median number of rooms in apartments:
Year house built (houses)
17 2020 or later375 2010 to 2019490 2000 to 2009326 1990 to 1999430 1980 to 19891,078 1970 to 1979811 1960 to 1969907 1950 to 1959424 1940 to 19492,298 1939 or earlier
Zip code 45804 household income distribution in 2022 493 Less than $10,000534 $10,000 to $14,999275 $15,000 to $19,999399 $20,000 to $24,999440 $25,000 to $29,999502 $30,000 to $34,999348 $35,000 to $39,999499 $40,000 to $44,999167 $45,000 to $49,999409 $50,000 to $59,999622 $60,000 to $74,999445 $75,000 to $99,999398 $100,000 to $124,999296 $125,000 to $149,999193 $150,000 to $199,999126 $200,000 or moreEstimate of home value of owner-occupied houses/condos in 2022 in zip code 45804 120 Less than $10,00039 $10,000 to $14,99937 $15,000 to $19,999165 $20,000 to $24,999278 $25,000 to $29,999118 $30,000 to $34,99991 $35,000 to $39,999135 $40,000 to $49,999170 $50,000 to $59,999220 $60,000 to $69,999129 $70,000 to $79,99977 $80,000 to $89,999123 $90,000 to $99,999271 $100,000 to $124,999171 $125,000 to $149,999317 $150,000 to $174,999297 $175,000 to $199,999129 $200,000 to $249,99996 $250,000 to $299,999147 $300,000 to $399,99936 $500,000 to $749,999Rent paid by renters in 2022 in zip code 45804 60 Less than $1007 $100 to $1498 $150 to $19965 $200 to $249124 $250 to $29974 $300 to $349119 $350 to $399117 $400 to $449303 $450 to $499316 $500 to $549310 $550 to $599201 $600 to $649179 $650 to $699174 $700 to $74983 $750 to $799191 $800 to $89920 $900 to $99923 $1,000 to $1,24922 $1,250 to $1,499113 No cash rent
Median gross rent in 2022: $784.
Estimated median house (or condo) value in 2022 for: White Non-Hispanic householders: $125,225Black or African American householders: $85,371American Indian or Alaska Native householders: $50,950Asian householders: $28,306Some other race householders: $147,191Two or more races householders: $101,901Hispanic or Latino householders: $142,888Estimated median house or condo value in 2022: $100,770
45804:
$100,770Ohio:
$204,100
Lower value quartile - upper value quartile: $42,636 - $183,213
Mean price in 2022: Detached houses: $130,358Here:
$130,358State:
$254,366
Townhouses or other attached units: $84,271Here:
$84,271State:
$225,733
In 2-unit structures: $764,331Here:
$764,331State:
$144,384
In 3-to-4-unit structures: $123,706Here:
$123,706State:
$203,002
Mobile homes: $17,912Here:
$17,912State:
$62,719
Housing units in structures:
One, detached: 5,129One, attached: 237Two: 3343 or 4: 3445 to 9: 3410 to 19: 2520 to 49: 20150 or more: 296Mobile homes: 579Unemployment : 6.3%
Means of transportation to work in zip code 45804 76.1% 4,329 Drove a car alone14.9% 850 Carpooled0.9% 53 Bus or trolley bus1.8% 100 Walked0.5% 30 Other means3.3% 187 Worked at homeTravel time to work (commute) in zip code 45804 96 Less than 5 minutes885 5 to 9 minutes1,432 10 to 14 minutes1,275 15 to 19 minutes576 20 to 24 minutes137 25 to 29 minutes446 30 to 34 minutes35 35 to 39 minutes109 40 to 44 minutes236 45 to 59 minutes67 60 to 89 minutes50 90 or more minutes
Percentage of zip code residents living and working in this county: 82.7%
Household type by relationship:
Households: 14,543
Male householders: 2,463 (1,045 living alone ), Female householders: 3,673 (1,422 living alone )1,598 spouses (1,574 opposite-sex spouses ), 669 unmarried partners , (662 opposite-sex unmarried partners ), 4,209 children (3,888 natural , 96 adopted , 223 stepchildren ), 368 grandchildren , 134 brothers or sisters , 85 parents , 90 foster children , 265 other relatives , 703 non-relatives In group quarters: 254 (-1 institutionalized population )
Size of family households: 1,316 2-persons , 732 3-persons , 463 4-persons , 437 5-persons , 117 6-persons , 58 7-or-more-persons
Size of nonfamily households: 2,468 1-person , 381 2-persons , 127 3-persons , 1 5-persons , 55 6-persons
1,079 married couples with children. single-parent households (255 men , 1,666 women ).
98.0% of residents of 45804 zip code speak English at home. of residents speak Spanish at home (73% very well, 15% well, 12% not well ).of residents speak other Indo-European language at home (25% very well, 75% well ).
Foreign born population: 76 (0.5%)
(72.0%
of them are naturalized citizens )
This zip code:
0.5%Whole state:
5.0%
32% France 31% Haiti 21% St. Vincent and the Grenadines 19% Honduras 8% Malaysia 4% Greece 22% English 15% German 15% American 7% Irish 3% African 2% European 1% Italian
Year of entry for the foreign-born population
0 2010 or later 21 2000 to 2009 0 1990 to 1999 80 Before 1990
There are
258 Other Medical Specialists in Zip Code 45804.
Facilities with environmental interests located in this zip code:
ACCUBUILT INC (2550 CENTRAL POINT PARKWAY in LIMA, OH)
AIR MAJOR (AIRS/AFS) CRITERIA AND HAZARDOUS AIR POLLUTANT INVENTORY (Inventory of air pollution sources) STATE MASTER (Ohio general info) - RCRA-OH0001002781, HAZARDOUS WASTE PROGRAM, AIR MAJOR, TRIS-45804SSSPR2550C, TRI REPORTER HAZARDOUS WASTE BIENNIAL REPORTER (Resource Conservation and Recovery Act (tracking hazardous waste)) Large Quantity Generators, more that 1000 kg of hazardous waste/month (Resource Conservation and Recovery Act (tracking hazardous waste)) - notification TRI REPORTER (Tracking of toxic chemicals releasing facilities) Business SIC classification: MOTOR VEHICLES AND PASSENGER CAR BODIESBusiness NAICS classification: MOTOR VEHICLE BODY MANUFACTURING.Organizations: SUPERIOR COACHES OF OHIO INC (CONTACT/OWNER)
Alternative names: ACCUBUILT(S&S SUPERIOR), S & S / SUPERIOR OF OHIO INC.
BOC GROUP INC (1150 SOUTH METCALF STREET in LIMA, OH)
AIR MINOR (AIRS/AFS) STATE MASTER (Ohio general info) - AIR MAJOR Business SIC classification: INDUSTRIAL GASES
BAUMGARTNER TRUCKING (ST RT 309 W 3200 HARDING HWY in LIMA, OH)
STATE MASTER (Ohio general info) - EPCRA, RCRA-OH0000998146, HAZARDOUS WASTE PROGRAM Small Quantity Generators, between 100 kg and 1000 kg of hazardous waste/month (Resource Conservation and Recovery Act (tracking hazardous waste)) - notification Organizations: GREG WANNAMACHER (CONTACT/OWNER)
BP OIL CO (1703 HARDING HWY in LIMA, OH)
STATE MASTER (Ohio general info) - RCRA-OHD987014438, HAZARDOUS WASTE PROGRAM, AIR MAJOR, -02-5541-168-3, EPCRA Conditionally Exempt Small Quantity Generators, less than 100 kg/month of hazardous waste (Resource Conservation and Recovery Act (tracking hazardous waste)) - notification Business SIC classification: GASOLINE SERVICE STATIONSOrganizations: BP OIL COMPANY (CONTACT/OWNER)
CENTIMARK CORP (1098 E EUREKA ST in LIMA, OH)
STATE MASTER (Ohio general info) - RCRA-OHR000022699, HAZARDOUS WASTE PROGRAM Small Quantity Generators, between 100 kg and 1000 kg of hazardous waste/month (Resource Conservation and Recovery Act (tracking hazardous waste)) - notification Organizations: ED DUNLAP (CONTACT/OWNER)
AIRCO INDUSTRIAL GASES (1235 HANTHORN RD in LIMA, OH)
COMPLIANCE ACTIVITY (Tracking inspections of insecticide, fungicide, and rodenticide, and toxic substances) STATE MASTER (Ohio general info) - SDWIS-0243212, DRINKING WATER PROGRAM Alternative names: BOC GASOS
BENDER AND LOUDON MOTOR FREIGHT INC (1400 S DIXIE HWY in LIMA, OH)
STATE MASTER (Ohio general info) - RCRA-OHD000772814, HAZARDOUS WASTE PROGRAM TRANSPORTER (Resource Conservation and Recovery Act (tracking hazardous waste))
BP OIL LIMA DISTRIBUTION CENTER (1000 HANTHORN RD in LIMA, OH)
(Resource Conservation and Recovery Act (tracking hazardous waste)) Organizations: WRIGHT DISTRIBUTION CENTERS (CONTACT/OWNER)
ABC AUTO BODY CENTRE (1798 S DIXIE in LIMA, OH)
Small Quantity Generators, between 100 kg and 1000 kg of hazardous waste/month (Resource Conservation and Recovery Act (tracking hazardous waste)) - notification Organizations: WEAKLAND JERRY (CONTACT/OWNER)
BOC GASES (1900 FORT AMANDA ROAD in LIMA, OH)
COMPLIANCE ACTIVITY (Tracking inspections of insecticide, fungicide, and rodenticide, and toxic substances)
CHEMSTATION OF NORTHWESTERN OHIO (3255 ST JOHNS RD in LIMA, OH)
COMPLIANCE ACTIVITY (Tracking inspections of insecticide, fungicide, and rodenticide, and toxic substances)
Housing units lacking complete plumbing facilities: 7.3%
Housing units lacking complete kitchen facilities: 6.6%
78.5% Utility gas 19.3% Electricity 1.4% Bottled, tank, or LP gas 0.6% No fuel used
Population in 1990: 19,289.
Place of birth for U.S.-born residents:
This state: 11,719Northeast: 383Midwest: 749South: 1,342West: 203
56% of the 45804 zip code residents lived in the same house 5 years ago.
Out of people who lived in different houses, 75% lived in this county.
Out of people who lived in different counties, 50% lived in Ohio.
87% of the 45804 zip code residents lived in the same house 1 year ago.
Out of people who lived in different houses, 59% moved from this county.
Out of people who lived in different houses, 27% moved from different county within same state.
Out of people who lived in different houses, 11% moved from different state.
Private vs. public school enrollment:
Students in private schools in grades 1 to 8 (elementary and middle school): 167
Students in private schools in grades 9 to 12 (high school): 86
Students in private undergraduate colleges: 234
Occupation by median earnings in the past 12 months ($)
90,724 Architecture and engineering occupations 68,112 Business and financial operations occupations 63,051 Transportation occupations 61,826 Computer and mathematical occupations 60,374 Health diagnosing and treating practitioners and other technical occupations 47,539 Management occupations
Companies with federal contracts located in this zip code (LIMA, OH):
SHAWNEE TOWNSHIP FIRE DEPARTME (2526 FORT AMANDA ROAD) in 3 contracts from 2004 to 2005
$41,500 with Defense Logistics Agency for Fire Protection Services. Signed on 2005-07-22. Completion date: 2006-09-30.
, same as above. Signed on 2004-08-03. Completion date: 2005-09-30.
, same as above. Signed on 2004-08-03. Completion date: 2005-09-30.
SRECO FLEXIBLE INC (3434 S DIXIE HWY; small business)
$44,900 with Air Force for Waste Disposal Equipment. Signed on 2000-06-29. Completion date: 2000-08-03.
ROEDER FENCE & SUPPLY COMPANY (607 S SHAWNEE ST; small business)
$2,974 with Army for Fencing, Fences, Gates and Components. Signed on 2002-12-03. Completion date: 2002-12-20.
LIMA MEMORIAL HOSPITAL (1001 BELLEFONTAINE AVENUE)
$2,678 with Army for Hospital and Surgical Clothing and Related Special Purpose Items. Signed on 2006-07-10. Completion date: 2007-07-10.
WASTE MANAGEMENT (1550 E 4TH ST) in 2 contracts in 2003
$1,032 with Army for Trash/Garbage Collection Services - Including Portable Sanitation Services. Signed on 2003-02-20. Completion date: 2004-03-31.
, same as above. Signed on 2003-02-20. Completion date: 2004-03-31.
Top industries in this zip code by the number of employees in 2005:
Health Care and Social Assistance: General Medical and Surgical Hospitals (over 1000 employees: 1 establishment)Accommodation and Food Services: Full-Service Restaurants (100-249: 2, 50-99: 3, 20-49: 1, 10-19: 2, 5-9: 5, 1-4: 2)Accommodation and Food Services: Limited-Service Restaurants (50-99: 2, 20-49: 12, 10-19: 3, 5-9: 2, 1-4: 5)Administrative and Support and Waste Management and Remediation Services: Temporary Help Services (250-499: 1, 20-49: 3)Health Care and Social Assistance: Nursing Care Facilities (100-249: 2, 50-99: 1, 1-4: 1)Health Care and Social Assistance: Offices of Physicians (except Mental Health Specialists) (50-99: 2, 20-49: 2, 10-19: 9, 5-9: 4, 1-4: 8)
People in group quarters in 2010:
139 people in nursing facilities/skilled-nursing facilities
88 people in college/university student housing
62 people in other noninstitutional facilities
16 people in correctional residential facilities
15 people in residential treatment centers for adults
3 people in group homes intended for adults
People in group quarters in 2000:
193 people in nursing homes
51 people in halfway houses
13 people in other group homes
5 people in homes for the mentally retarded
Home Mortgage Disclosure Act Aggregated Statistics For Year 2009(Based on 8 full and 10 partial tracts) A) FHA, FSA/RHS & VA B) Conventional C) Refinancings D) Home Improvement Loans E) Loans on Dwellings For 5+ Families F) Non-occupant Loans on G) Loans On Manufactured Number Average Value Number Average Value Number Average Value Number Average Value Number Average Value Number Average Value Number Average Value
LOANS ORIGINATED 35 $84,931 50 $93,849 319 $94,142 10 $43,814 4 $505,770 37 $48,545 5 $75,496 APPLICATIONS APPROVED, NOT ACCEPTED 3 $77,393 9 $114,757 68 $84,282 7 $25,721 0 $0 1 $32,160 3 $58,530 APPLICATIONS DENIED 8 $80,625 23 $52,602 148 $79,444 20 $32,462 0 $0 11 $27,088 2 $56,525 APPLICATIONS WITHDRAWN 2 $71,220 1 $216,350 54 $88,637 0 $0 0 $0 1 $129,050 0 $0 FILES CLOSED FOR INCOMPLETENESS 1 $119,580 0 $0 14 $70,669 2 $39,815 0 $0 2 $39,815 0 $0
Aggregated Statistics For Year 2008(Based on 8 full and 10 partial tracts) A) FHA, FSA/RHS & VA B) Conventional C) Refinancings D) Home Improvement Loans E) Loans on Dwellings For 5+ Families F) Non-occupant Loans on G) Loans On Manufactured Number Average Value Number Average Value Number Average Value Number Average Value Number Average Value Number Average Value Number Average Value
LOANS ORIGINATED 42 $75,693 78 $98,434 202 $83,499 26 $30,522 1 $455,050 68 $59,697 9 $46,859 APPLICATIONS APPROVED, NOT ACCEPTED 1 $96,570 14 $65,737 47 $71,519 12 $42,522 0 $0 6 $46,373 2 $35,145 APPLICATIONS DENIED 14 $68,431 30 $53,771 172 $69,541 58 $24,943 0 $0 18 $56,991 5 $44,660 APPLICATIONS WITHDRAWN 3 $107,953 8 $93,849 66 $74,587 6 $39,392 0 $0 8 $40,235 0 $0 FILES CLOSED FOR INCOMPLETENESS 0 $0 0 $0 8 $80,750 1 $82,330 0 $0 0 $0 0 $0
Aggregated Statistics For Year 2007(Based on 8 full and 10 partial tracts) A) FHA, FSA/RHS & VA B) Conventional C) Refinancings D) Home Improvement Loans E) Loans on Dwellings For 5+ Families F) Non-occupant Loans on G) Loans On Manufactured Number Average Value Number Average Value Number Average Value Number Average Value Number Average Value Number Average Value Number Average Value
LOANS ORIGINATED 24 $82,670 162 $79,739 316 $75,288 67 $32,785 1 $467,000 103 $58,937 11 $68,853 APPLICATIONS APPROVED, NOT ACCEPTED 3 $56,370 27 $105,101 56 $81,240 23 $25,372 0 $0 13 $47,951 1 $40,520 APPLICATIONS DENIED 25 $66,534 57 $66,446 402 $68,721 106 $31,399 0 $0 49 $59,776 6 $53,590 APPLICATIONS WITHDRAWN 10 $71,776 19 $63,281 106 $80,269 10 $66,104 0 $0 17 $36,714 0 $0 FILES CLOSED FOR INCOMPLETENESS 4 $59,168 6 $63,645 16 $84,464 0 $0 0 $0 0 $0 0 $0
Aggregated Statistics For Year 2006(Based on 8 full and 10 partial tracts) A) FHA, FSA/RHS & VA B) Conventional C) Refinancings D) Home Improvement Loans E) Loans on Dwellings For 5+ Families F) Non-occupant Loans on G) Loans On Manufactured Number Average Value Number Average Value Number Average Value Number Average Value Number Average Value Number Average Value Number Average Value
LOANS ORIGINATED 19 $100,551 259 $77,767 352 $65,744 67 $34,110 6 $941,912 123 $43,281 20 $59,310 APPLICATIONS APPROVED, NOT ACCEPTED 1 $83,210 49 $64,617 83 $60,109 12 $28,236 0 $0 15 $62,143 3 $40,930 APPLICATIONS DENIED 1 $76,800 132 $57,948 436 $71,846 154 $65,693 0 $0 65 $41,653 15 $60,969 APPLICATIONS WITHDRAWN 0 $0 37 $90,572 173 $79,236 14 $44,516 0 $0 13 $60,215 0 $0 FILES CLOSED FOR INCOMPLETENESS 0 $0 8 $63,128 52 $78,205 0 $0 0 $0 2 $59,725 0 $0
Aggregated Statistics For Year 2005(Based on 8 full and 10 partial tracts) A) FHA, FSA/RHS & VA B) Conventional C) Refinancings D) Home Improvement Loans E) Loans on Dwellings For 5+ Families F) Non-occupant Loans on G) Loans On Manufactured Number Average Value Number Average Value Number Average Value Number Average Value Number Average Value Number Average Value Number Average Value
LOANS ORIGINATED 9 $86,411 322 $64,859 422 $63,399 83 $28,960 3 $124,773 243 $39,966 8 $36,154 APPLICATIONS APPROVED, NOT ACCEPTED 0 $0 48 $58,843 118 $73,196 21 $34,006 0 $0 23 $49,731 2 $89,855 APPLICATIONS DENIED 3 $49,667 158 $57,370 655 $63,902 157 $28,390 0 $0 78 $40,930 17 $48,542 APPLICATIONS WITHDRAWN 2 $68,710 103 $71,502 254 $85,916 38 $109,861 0 $0 21 $61,398 2 $72,510 FILES CLOSED FOR INCOMPLETENESS 0 $0 16 $77,268 40 $94,750 3 $43,350 0 $0 9 $148,108 0 $0
Aggregated Statistics For Year 2004(Based on 8 full and 10 partial tracts) A) FHA, FSA/RHS & VA B) Conventional C) Refinancings D) Home Improvement Loans E) Loans on Dwellings For 5+ Families F) Non-occupant Loans on G) Loans On Manufactured Number Average Value Number Average Value Number Average Value Number Average Value Number Average Value Number Average Value Number Average Value
LOANS ORIGINATED 21 $76,524 304 $72,363 473 $70,420 97 $39,719 3 $6,216,087 175 $46,457 7 $51,159 APPLICATIONS APPROVED, NOT ACCEPTED 2 $71,460 47 $70,750 143 $61,898 19 $57,964 0 $0 24 $46,499 7 $53,029 APPLICATIONS DENIED 7 $58,940 178 $52,819 619 $64,136 100 $25,797 0 $0 89 $42,740 20 $46,970 APPLICATIONS WITHDRAWN 1 $95,060 35 $81,165 246 $76,382 12 $47,106 0 $0 12 $50,498 3 $81,547 FILES CLOSED FOR INCOMPLETENESS 3 $38,620 4 $77,715 40 $75,870 0 $0 0 $0 3 $52,690 0 $0
Aggregated Statistics For Year 2003(Based on 8 full and 10 partial tracts) A) FHA, FSA/RHS & VA B) Conventional C) Refinancings D) Home Improvement Loans E) Loans on Dwellings For 5+ Families F) Non-occupant Loans on Number Average Value Number Average Value Number Average Value Number Average Value Number Average Value Number Average Value
LOANS ORIGINATED 20 $76,364 237 $60,681 760 $68,698 74 $18,157 2 $304,500 175 $37,570 APPLICATIONS APPROVED, NOT ACCEPTED 1 $92,380 32 $75,679 160 $63,818 13 $17,208 0 $0 12 $37,680 APPLICATIONS DENIED 5 $61,426 164 $43,800 579 $55,287 111 $18,193 0 $0 93 $32,848 APPLICATIONS WITHDRAWN 0 $0 28 $60,394 295 $64,140 20 $16,078 0 $0 36 $34,571 FILES CLOSED FOR INCOMPLETENESS 0 $0 6 $71,237 68 $58,386 4 $27,352 0 $0 5 $42,432
Aggregated Statistics For Year 2002(Based on 8 full and 10 partial tracts) A) FHA, FSA/RHS & VA B) Conventional C) Refinancings D) Home Improvement Loans E) Loans on Dwellings For 5+ Families F) Non-occupant Loans on Number Average Value Number Average Value Number Average Value Number Average Value Number Average Value Number Average Value
LOANS ORIGINATED 9 $79,113 231 $62,409 721 $65,474 51 $15,286 1 $88,860 180 $38,069 APPLICATIONS APPROVED, NOT ACCEPTED 0 $0 37 $49,341 175 $65,618 11 $17,270 0 $0 12 $30,602 APPLICATIONS DENIED 5 $65,820 105 $40,744 659 $54,840 66 $10,974 0 $0 61 $35,918 APPLICATIONS WITHDRAWN 3 $109,980 41 $56,938 299 $61,862 7 $9,314 0 $0 13 $32,612 FILES CLOSED FOR INCOMPLETENESS 0 $0 9 $74,212 46 $61,400 4 $39,825 0 $0 3 $44,550
Aggregated Statistics For Year 2001(Based on 8 full and 10 partial tracts) A) FHA, FSA/RHS & VA B) Conventional C) Refinancings D) Home Improvement Loans E) Loans on Dwellings For 5+ Families F) Non-occupant Loans on Number Average Value Number Average Value Number Average Value Number Average Value Number Average Value Number Average Value
LOANS ORIGINATED 19 $67,036 227 $57,665 614 $65,759 47 $12,871 10 $366,022 122 $37,816 APPLICATIONS APPROVED, NOT ACCEPTED 3 $64,997 58 $45,148 160 $57,312 12 $22,910 0 $0 15 $33,937 APPLICATIONS DENIED 4 $92,930 197 $38,355 648 $50,544 97 $12,690 0 $0 72 $34,307 APPLICATIONS WITHDRAWN 2 $25,975 27 $40,513 313 $53,581 23 $19,373 0 $0 51 $35,396 FILES CLOSED FOR INCOMPLETENESS 0 $0 14 $48,268 45 $51,186 2 $11,990 0 $0 4 $32,405
Aggregated Statistics For Year 2000(Based on 8 full and 10 partial tracts) A) FHA, FSA/RHS & VA B) Conventional C) Refinancings D) Home Improvement Loans E) Loans on Dwellings For 5+ Families F) Non-occupant Loans on Number Average Value Number Average Value Number Average Value Number Average Value Number Average Value Number Average Value
LOANS ORIGINATED 35 $54,861 335 $52,513 429 $42,878 99 $12,597 3 $328,593 195 $33,284 APPLICATIONS APPROVED, NOT ACCEPTED 2 $49,725 55 $44,331 149 $45,441 47 $15,136 0 $0 15 $27,624 APPLICATIONS DENIED 8 $47,039 233 $40,185 513 $42,282 200 $16,546 0 $0 110 $38,454 APPLICATIONS WITHDRAWN 2 $55,910 52 $39,520 231 $43,908 21 $24,073 0 $0 25 $35,729 FILES CLOSED FOR INCOMPLETENESS 0 $0 1 $68,500 41 $41,002 3 $5,000 0 $0 4 $32,415
Aggregated Statistics For Year 1999(Based on 7 full and 5 partial tracts) A) FHA, FSA/RHS & VA B) Conventional C) Refinancings D) Home Improvement Loans E) Loans on Dwellings For 5+ Families F) Non-occupant Loans on Number Average Value Number Average Value Number Average Value Number Average Value Number Average Value Number Average Value
LOANS ORIGINATED 20 $56,878 192 $47,265 340 $42,170 76 $12,700 2 $444,020 129 $31,200 APPLICATIONS APPROVED, NOT ACCEPTED 1 $48,410 41 $39,091 186 $41,458 37 $15,661 0 $0 26 $31,339 APPLICATIONS DENIED 3 $50,487 118 $52,605 367 $40,208 166 $10,711 0 $0 58 $27,168 APPLICATIONS WITHDRAWN 2 $67,695 42 $40,439 173 $41,760 15 $26,531 0 $0 33 $28,934 FILES CLOSED FOR INCOMPLETENESS 0 $0 5 $48,228 38 $40,219 1 $17,430 0 $0 3 $20,317
Private Mortgage Insurance Companies Aggregated Statistics For Year 2009(Based on 6 full and 10 partial tracts) A) Conventional B) Refinancings C) Non-occupant Loans on Number Average Value Number Average Value Number Average Value
LOANS ORIGINATED 14 $116,244 22 $108,753 0 $0 APPLICATIONS APPROVED, NOT ACCEPTED 4 $130,855 12 $96,603 0 $0 APPLICATIONS DENIED 7 $68,981 4 $139,340 1 $32,160 APPLICATIONS WITHDRAWN 1 $63,470 1 $131,940 0 $0 FILES CLOSED FOR INCOMPLETENESS 0 $0 1 $94,370 0 $0
Aggregated Statistics For Year 2008(Based on 8 full and 10 partial tracts) A) Conventional B) Refinancings C) Non-occupant Loans on D) Loans On Manufactured Number Average Value Number Average Value Number Average Value Number Average Value
LOANS ORIGINATED 40 $72,749 18 $125,616 6 $40,883 1 $111,220 APPLICATIONS APPROVED, NOT ACCEPTED 8 $58,952 8 $113,108 3 $15,633 1 $34,730 APPLICATIONS DENIED 2 $54,405 1 $92,920 0 $0 0 $0 APPLICATIONS WITHDRAWN 1 $97,570 5 $43,664 0 $0 0 $0 FILES CLOSED FOR INCOMPLETENESS 1 $56,060 2 $87,790 1 $56,060 0 $0
Aggregated Statistics For Year 2007(Based on 8 full and 10 partial tracts) A) Conventional B) Refinancings C) Non-occupant Loans on Number Average Value Number Average Value Number Average Value
LOANS ORIGINATED 89 $79,540 37 $87,773 12 $40,104 APPLICATIONS APPROVED, NOT ACCEPTED 21 $62,713 16 $71,498 6 $37,438 APPLICATIONS DENIED 4 $67,520 2 $92,470 3 $48,900 APPLICATIONS WITHDRAWN 7 $80,603 4 $66,785 1 $20,580 FILES CLOSED FOR INCOMPLETENESS 0 $0 0 $0 0 $0
Aggregated Statistics For Year 2006(Based on 8 full and 10 partial tracts) A) Conventional B) Refinancings C) Non-occupant Loans on D) Loans On Manufactured Number Average Value Number Average Value Number Average Value Number Average Value
LOANS ORIGINATED 88 $74,639 11 $123,534 12 $32,266 1 $64,040 APPLICATIONS APPROVED, NOT ACCEPTED 15 $77,655 9 $85,988 3 $45,780 0 $0 APPLICATIONS DENIED 1 $90,790 0 $0 0 $0 0 $0 APPLICATIONS WITHDRAWN 2 $198,740 3 $111,143 0 $0 0 $0 FILES CLOSED FOR INCOMPLETENESS 0 $0 0 $0 0 $0 0 $0
Aggregated Statistics For Year 2005(Based on 8 full and 10 partial tracts) A) Conventional B) Refinancings C) Non-occupant Loans on Number Average Value Number Average Value Number Average Value
LOANS ORIGINATED 79 $69,520 22 $99,758 24 $39,971 APPLICATIONS APPROVED, NOT ACCEPTED 21 $82,496 13 $85,587 4 $50,248 APPLICATIONS DENIED 3 $64,683 0 $0 2 $52,950 APPLICATIONS WITHDRAWN 5 $63,732 0 $0 2 $63,510 FILES CLOSED FOR INCOMPLETENESS 1 $45,020 0 $0 0 $0
Aggregated Statistics For Year 2004(Based on 8 full and 10 partial tracts) A) Conventional B) Refinancings C) Non-occupant Loans on Number Average Value Number Average Value Number Average Value
LOANS ORIGINATED 70 $69,457 33 $95,148 26 $32,577 APPLICATIONS APPROVED, NOT ACCEPTED 14 $168,494 11 $104,682 0 $0 APPLICATIONS DENIED 0 $0 4 $63,968 2 $49,590 APPLICATIONS WITHDRAWN 1 $88,120 4 $44,792 2 $34,840 FILES CLOSED FOR INCOMPLETENESS 2 $110,215 0 $0 0 $0
Aggregated Statistics For Year 2003(Based on 8 full and 10 partial tracts) A) Conventional B) Refinancings C) Non-occupant Loans on Number Average Value Number Average Value Number Average Value
LOANS ORIGINATED 55 $69,230 53 $85,148 15 $38,065 APPLICATIONS APPROVED, NOT ACCEPTED 8 $52,664 30 $78,572 0 $0 APPLICATIONS DENIED 2 $38,180 3 $64,227 2 $47,955 APPLICATIONS WITHDRAWN 2 $76,510 0 $0 0 $0 FILES CLOSED FOR INCOMPLETENESS 2 $35,880 1 $52,100 2 $35,880
Aggregated Statistics For Year 2002(Based on 8 full and 10 partial tracts) A) Conventional B) Refinancings C) Non-occupant Loans on Number Average Value Number Average Value Number Average Value
LOANS ORIGINATED 60 $68,157 71 $71,196 22 $35,721 APPLICATIONS APPROVED, NOT ACCEPTED 7 $93,816 15 $91,581 2 $12,955 APPLICATIONS DENIED 1 $76,200 1 $40,000 1 $40,000 APPLICATIONS WITHDRAWN 1 $85,360 8 $72,766 0 $0 FILES CLOSED FOR INCOMPLETENESS 1 $18,650 3 $66,910 0 $0
Aggregated Statistics For Year 2001(Based on 8 full and 10 partial tracts) A) Conventional B) Refinancings C) Non-occupant Loans on Number Average Value Number Average Value Number Average Value
LOANS ORIGINATED 61 $71,775 50 $83,717 11 $38,461 APPLICATIONS APPROVED, NOT ACCEPTED 18 $55,599 18 $68,771 8 $40,811 APPLICATIONS DENIED 1 $22,000 3 $73,217 0 $0 APPLICATIONS WITHDRAWN 2 $43,500 0 $0 0 $0 FILES CLOSED FOR INCOMPLETENESS 2 $40,810 0 $0 2 $40,810
Aggregated Statistics For Year 2000(Based on 8 full and 10 partial tracts) A) Conventional B) Refinancings C) Non-occupant Loans on Number Average Value Number Average Value Number Average Value
LOANS ORIGINATED 75 $65,149 49 $50,677 41 $38,890 APPLICATIONS APPROVED, NOT ACCEPTED 7 $55,947 2 $71,770 3 $29,317 APPLICATIONS DENIED 2 $64,260 3 $55,197 2 $32,500 APPLICATIONS WITHDRAWN 1 $99,570 0 $0 0 $0 FILES CLOSED FOR INCOMPLETENESS 1 $36,860 0 $0 0 $0
Aggregated Statistics For Year 1999(Based on 6 full and 5 partial tracts) A) Conventional B) Refinancings C) Non-occupant Loans on Number Average Value Number Average Value Number Average Value
LOANS ORIGINATED 34 $63,451 18 $64,520 7 $28,270 APPLICATIONS APPROVED, NOT ACCEPTED 3 $43,657 1 $112,870 0 $0 APPLICATIONS DENIED 1 $43,000 1 $98,500 0 $0 APPLICATIONS WITHDRAWN 1 $39,310 1 $97,920 0 $0 FILES CLOSED FOR INCOMPLETENESS 1 $155,580 0 $0 0 $0
2002 - 2018 National Fire Incident Reporting System (NFIRS) incidents See full 2006 National Fire Incident Reporting System statistics for zip code 45804, Ohio
Most common first names in zip code 45804 among deceased individuals Name Count Lived (average)
Mary 215 77.6 years Robert 167 71.1 years William 153 72.3 years John 147 72.3 years James 121 70.9 years Charles 109 73.6 years Helen 84 79.5 years George 77 74.9 years Ruth 76 79.0 years Margaret 66 78.0 years
Most common last names in zip code 45804 among deceased individuals Last name Count Lived (average)
Smith 115 73.8 years Miller 78 75.6 years Johnson 63 69.2 years Brown 58 72.4 years Jones 52 73.0 years Williams 44 68.4 years Davis 38 76.2 years Thompson 35 76.8 years Thomas 34 76.2 years Jackson 29 76.6 years
Businesses in zip code 45804
Name Count Name Count
AT&T 1 Motel 6 1 Advance Auto Parts 1 New Balance 1 Applebee's 1 Olive Garden 1 Arby's 1 Payless 1 AutoZone 1 Pizza Hut 1 Burger King 1 RadioShack 1 CVS 1 Red Lobster 1 FedEx 1 Rite Aid 1 Ford 1 Sam's Club 1 GNC 1 Sprint Nextel 1 Goodwill 1 Subway 2 H&R Block 1 T-Mobile 1 Hilton 1 Taco Bell 1 Holiday Inn 1 Travelodge 1 Howard Johnson 1 U-Haul 3 Kmart 1 UPS 4 Little Caesars Pizza 1 Walgreens 1 Marriott 1 Walmart 1 Mazda 1 Wendy's 1 McDonald's 2


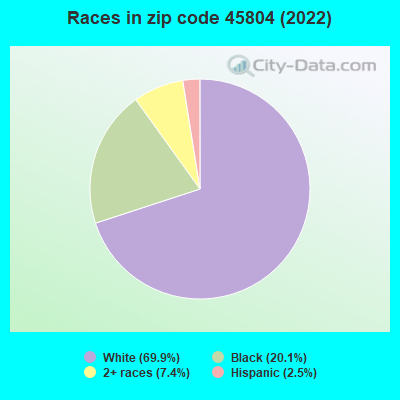


 Nearest zip codes: 45801, 45806, 45805, 45888, 45854, 45820.
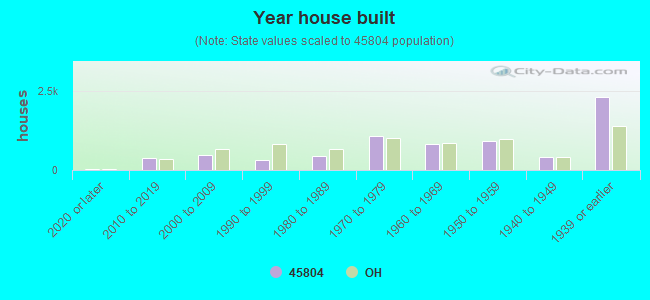

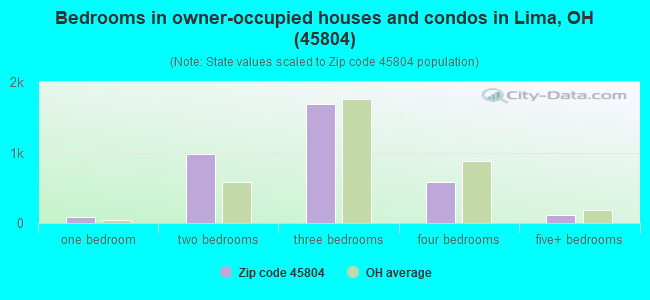
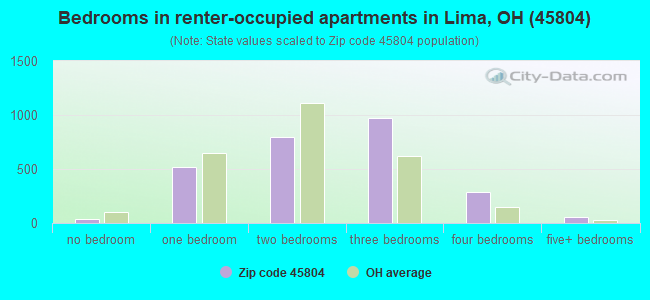
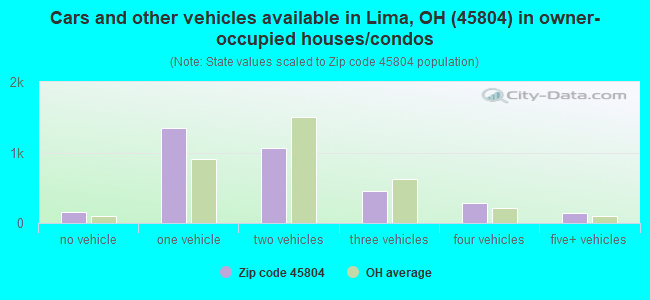
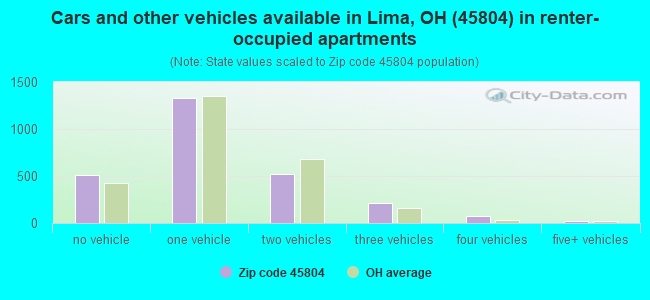


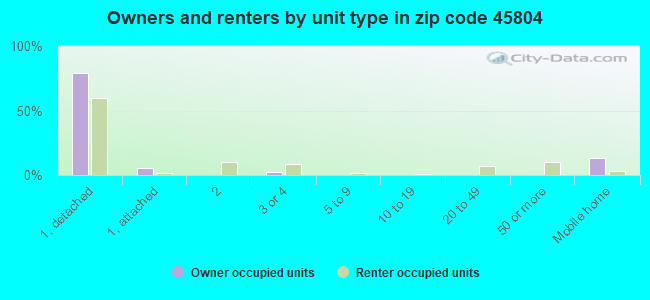
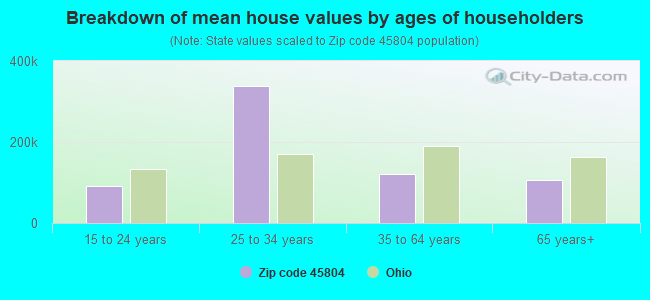


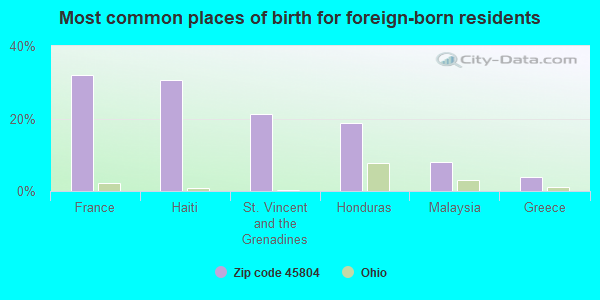
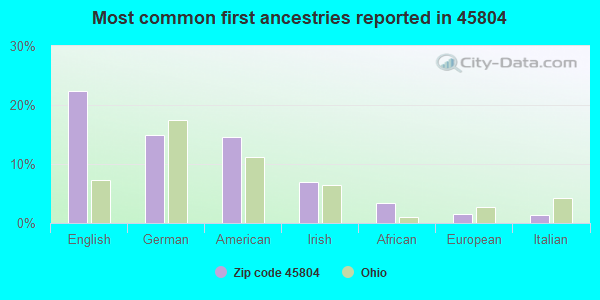
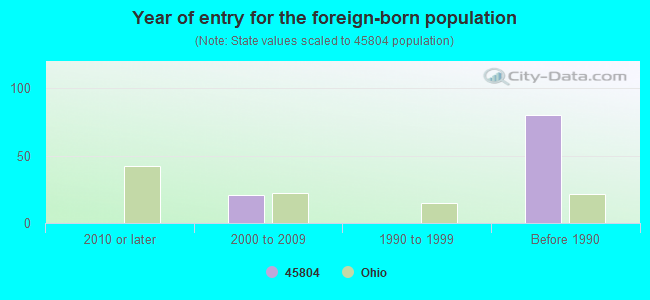


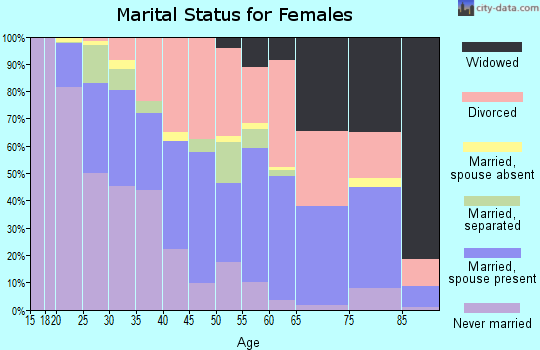
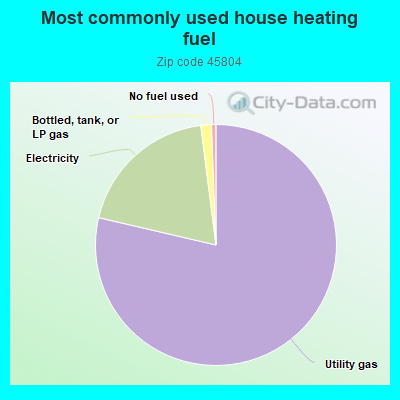
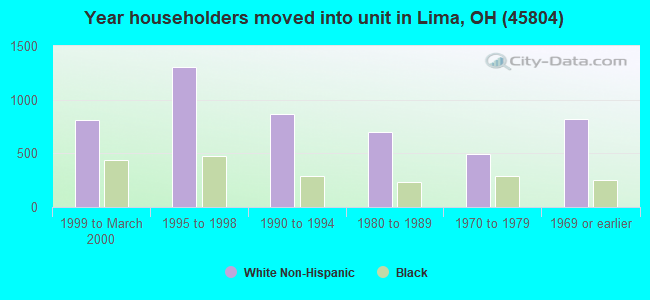
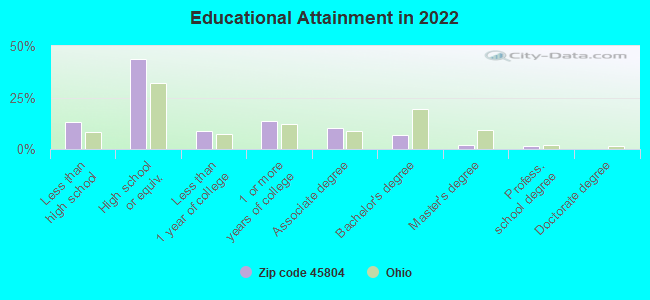
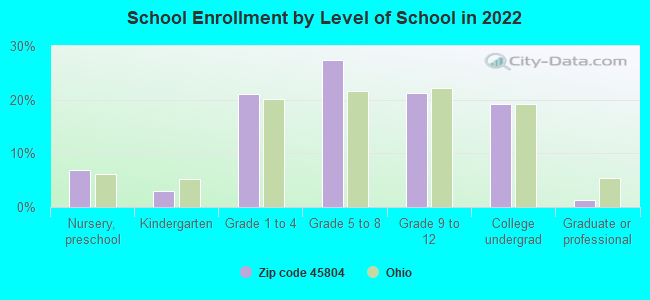
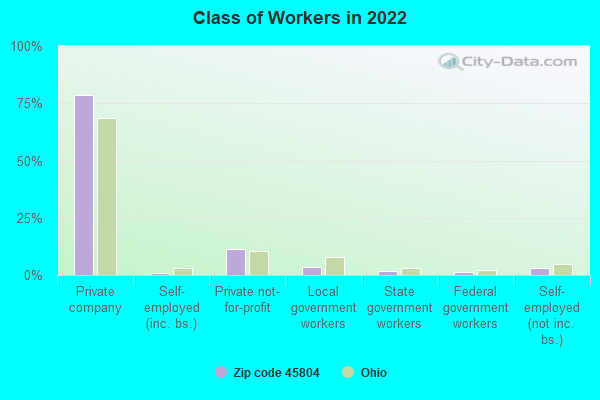
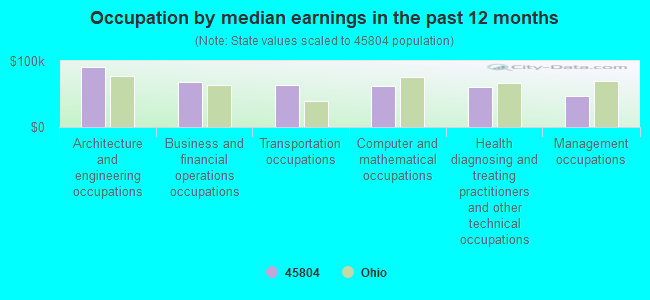
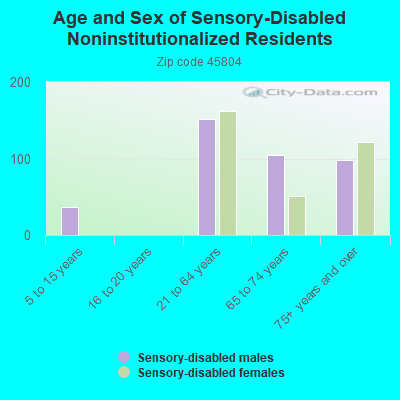
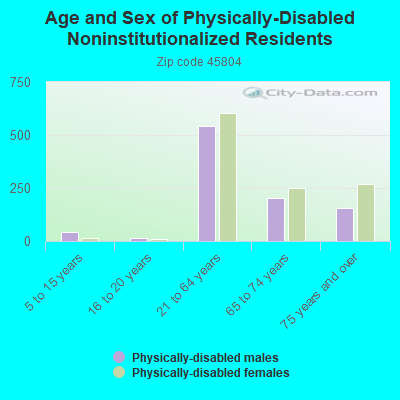
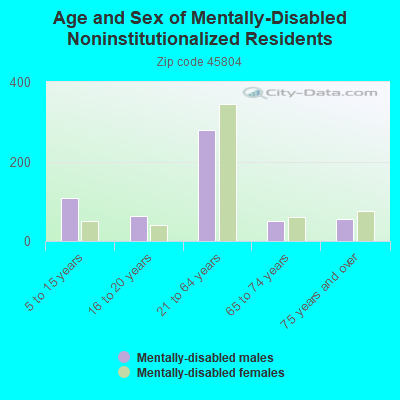
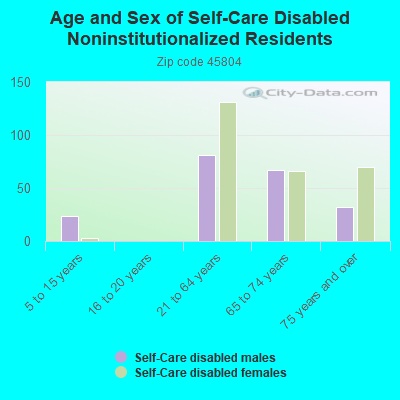
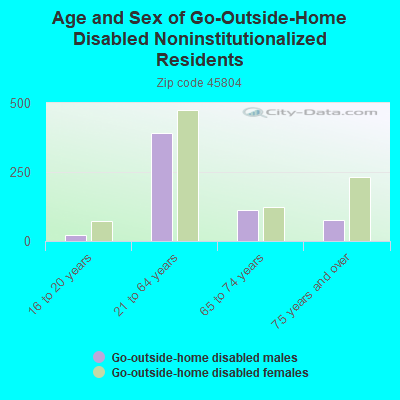
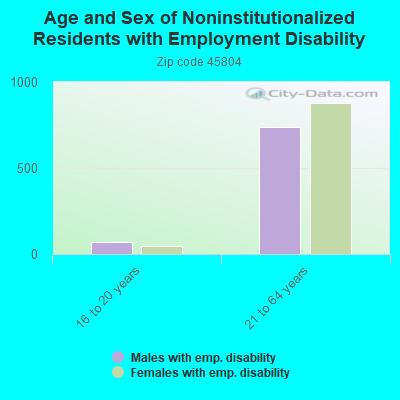
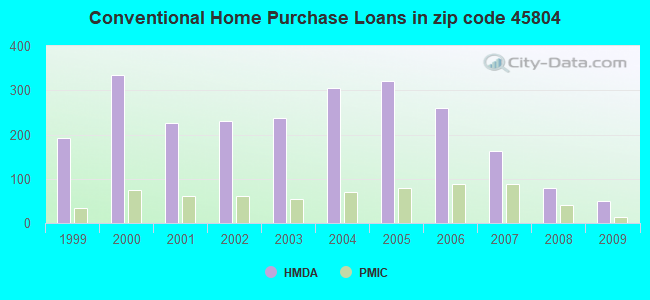
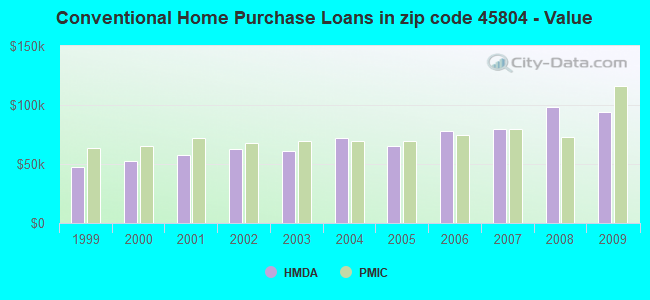
 According to the data from the years 2002 - 2018 the average number of fire incidents per year is 196. The highest number of fire incidents - 307 took place in 2008, and the least - 111 in 2016. The data has a declining trend.
 When looking into fire subcategories, the most incidents belonged to: Structure Fires (42.3%), and Outside Fires (35.8%).