Estimated zip code population in 2022: 24,639 Zip code population in 2010: 22,514 Zip code population in 2000: 23,285
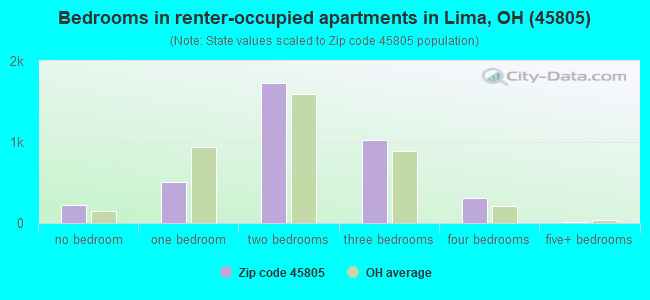
Houses and condos: 10,596 Renter-occupied apartments: 3,831
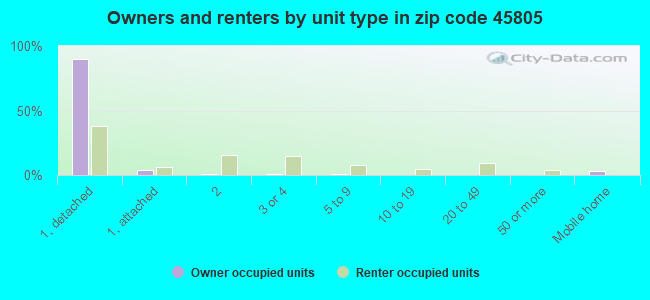
% of renters here:
38%
State:
33%
March 2022 cost of living index in zip code 45805: 90.3 (less than average, U.S. average is 100)
Land area: 15.1 sq. mi. Water area: 0.1 sq. mi.
Population density: 1,637 people per square mile
(low).
OSM Map
General Map
Google Map
MSN Map
OSM Map
General Map
Google Map
MSN Map
OSM Map
General Map
Google Map
MSN Map
OSM Map
General Map
Google Map
MSN Map
Please wait while loading the map...
Real estate property taxes paid for housing units in 2022:
This zip code:
1.1% ($1,841)
Ohio:
1.3% ($2,639)
Median real estate property taxes paid for housing units with mortgages in 2022: $1,945 (1.1%) Median real estate property taxes paid for housing units with no mortgage in 2022: $1,687 (1.2%)
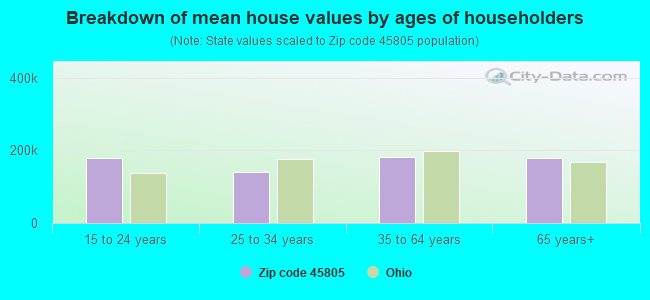
Estimated median house/condo value in 2022: $162,567
45805:
$162,567
Ohio:
$204,100
According to our research of Ohio and other state lists, there were 40 registered sex offenders living in 45805 zip code as of April 27, 2024. The ratio of all residents to sex offenders in zip code 45805 is 601 to 1. The ratio of registered sex offenders to all residents in this zip code is near the state average.
Median resident age:
This zip code:
35.4 years
Ohio median age:
39.9 years
Average household size:
This zip code:
2.4 people
Ohio:
2.4 people
Averages for the 2020 tax year for zip code 45805, filed in 2021:
Average Adjusted Gross Income (AGI) in 2020: $62,410 (Individual Income Tax Returns)
Here:
$62,410
State:
$67,288
Salary/wage: $49,088 (reported on 82.6% of returns)
Here:
$49,088
State:
$55,628
(% of AGI for various income ranges: 1145.6% for AGIs below $25k, 3356.9% for AGIs $25k-50k, 6050.8% for AGIs $50k-75k, 8894.4% for AGIs $75k-100k, 14793.7% for AGIs $100k-200k, 79666.4% for AGIs over 200k)
Taxable interest for individuals: $1,724 (reported on 22.7% of returns)
This zip code:
$1,724
Ohio:
$1,518
(% of AGI for various income ranges: 11.0% for AGIs below $25k, 12.8% for AGIs $25k-50k, 26.1% for AGIs $50k-75k, 62.9% for AGIs $75k-100k, 75.1% for AGIs $100k-200k, 2209.1% for AGIs over 200k)
Ordinary dividends: $9,008 (reported on 17.5% of returns)
Here:
$9,008
State:
$7,167
(% of AGI for various income ranges: 17.6% for AGIs below $25k, 31.1% for AGIs $25k-50k, 92.1% for AGIs $50k-75k, 170.9% for AGIs $75k-100k, 370.8% for AGIs $100k-200k, 10336.4% for AGIs over 200k)
Net capital gain/loss in AGI: +$18,249 (reported on 15.0% of returns)
Here:
+$18,249
State:
+$18,919
(% of AGI for various income ranges: 6.2% for AGIs below $25k, 24.6% for AGIs $25k-50k, 87.9% for AGIs $50k-75k, 147.4% for AGIs $75k-100k, 514.2% for AGIs $100k-200k, 21825.5% for AGIs over 200k)
Profit/loss from business: +$15,410 (reported on 11.2% of returns)
Here:
+$15,410
State:
+$13,744
(% of AGI for various income ranges: 46.8% for AGIs below $25k, 74.3% for AGIs $25k-50k, 144.9% for AGIs $50k-75k, 298.8% for AGIs $75k-100k, 596.1% for AGIs $100k-200k, 7010.9% for AGIs over 200k)
Taxable individual retirement arrangement distribution: $20,833 (reported on 10.4% of returns)
45805:
$20,833
Ohio:
$18,876
(% of AGI for various income ranges: 41.4% for AGIs below $25k, 102.5% for AGIs $25k-50k, 239.2% for AGIs $50k-75k, 543.0% for AGIs $75k-100k, 1091.4% for AGIs $100k-200k, 5208.2% for AGIs over 200k)
Self-employed (Keogh) retirement plans: $25,925 (reported on 0.4% of returns)
45805:
$25,925
Ohio:
$24,898
(% of AGI for various income ranges: 942.7% for AGIs over 200k)
Total itemized deductions: $39,867 (reported on 4.0% of returns)
Here:
$39,867
State:
$33,869
(% of AGI for various income ranges: 21.9% for AGIs below $25k, 52.3% for AGIs $25k-50k, 113.4% for AGIs $50k-75k, 239.8% for AGIs $75k-100k, 487.5% for AGIs $100k-200k, 8346.4% for AGIs over 200k)
Charity contributions: $20,747 (reported on 3.4% of returns)
Here:
$20,747
State:
$14,577
(% of AGI for various income ranges: 10.7% for AGIs $25k-50k, 23.0% for AGIs $50k-75k, 70.8% for AGIs $75k-100k, 147.2% for AGIs $100k-200k, 5207.3% for AGIs over 200k)
Taxes paid: $6,723 (reported on 3.9% of returns)
45805:
$6,723
State:
$7,681
(% of AGI for various income ranges: 1.5% for AGIs below $25k, 4.8% for AGIs $25k-50k, 16.8% for AGIs $50k-75k, 51.4% for AGIs $75k-100k, 122.5% for AGIs $100k-200k, 1183.6% for AGIs over 200k)
Earned income credit: $2,344 (reported on 17.1% of returns)
Here:
$2,344
State:
$2,304
(% of AGI for various income ranges: 95.4% for AGIs below $25k, 62.0% for AGIs $25k-50k, 1.3% for AGIs $50k-75k)
Percentage of individuals using paid preparers for their 2020 taxes: 95.0%
Here:
95%
State:
94%
(% for various income ranges: 94.8% for AGIs below $25k, 95.2% for AGIs $25k-50k, 95.4% for AGIs $50k-75k, 93.9% for AGIs $75k-100k, 95.9% for AGIs $100k-200k, 94.6% for AGIs over 200k)
Averages for the 2012 tax year for zip code 45805, filed in 2013:
Average Adjusted Gross Income (AGI) in 2012: $58,383 (Individual Income Tax Returns)
Here:
$58,383
State:
$54,926
Salary/wage: $44,171 (reported on 84.7% of returns)
Here:
$44,171
State:
$45,869
(% of AGI for various income ranges: 74.5% for AGIs below $25k, 74.5% for AGIs $25k-50k, 73.7% for AGIs $50k-75k, 75.1% for AGIs $75k-100k, 70.5% for AGIs $100k-200k, 44.7% for AGIs over 200k)
Taxable interest for individuals: $1,549 (reported on 29.0% of returns)
This zip code:
$1,549
Ohio:
$1,297
(% of AGI for various income ranges: 1.1% for AGIs below $25k, 0.7% for AGIs $25k-50k, 0.7% for AGIs $50k-75k, 0.6% for AGIs $75k-100k, 0.5% for AGIs $100k-200k, 0.9% for AGIs over 200k)
Ordinary dividends: $10,042 (reported on 21.1% of returns)
Here:
$10,042
State:
$5,821
(% of AGI for various income ranges: 1.5% for AGIs below $25k, 1.1% for AGIs $25k-50k, 1.4% for AGIs $50k-75k, 1.6% for AGIs $75k-100k, 3.2% for AGIs $100k-200k, 7.4% for AGIs over 200k)
Net capital gain/loss in AGI: +$18,756 (reported on 15.1% of returns)
Here:
+$18,756
State:
+$11,232
(% of AGI for various income ranges: 0.2% for AGIs $25k-50k, 0.4% for AGIs $50k-75k, 0.7% for AGIs $75k-100k, 1.4% for AGIs $100k-200k, 13.7% for AGIs over 200k)
Profit/loss from business: +$14,118 (reported on 11.6% of returns)
Here:
+$14,118
State:
+$12,773
(% of AGI for various income ranges: 4.5% for AGIs below $25k, 1.9% for AGIs $25k-50k, 1.5% for AGIs $50k-75k, 1.9% for AGIs $75k-100k, 4.3% for AGIs $100k-200k, 2.9% for AGIs over 200k)
Taxable individual retirement arrangement distribution: $17,023 (reported on 12.0% of returns)
45805:
$17,023
Ohio:
$14,511
(% of AGI for various income ranges: 3.0% for AGIs below $25k, 2.8% for AGIs $25k-50k, 3.3% for AGIs $50k-75k, 3.2% for AGIs $75k-100k, 4.6% for AGIs $100k-200k, 3.6% for AGIs over 200k)
Self-employment retirement plans: $17,180 (reported on 0.5% of returns)
45805:
$17,180
Ohio:
$20,257
(% of AGI for various income ranges: 0.8% for AGIs $100k-200k)
Total itemized deductions: $22,675 (15% of AGI, reported on 23.6% of returns)
Here:
$22,675
State:
$21,278
Here:
15.4% of AGI
State:
18.8% of AGI
(% of AGI for various income ranges: 4.4% for AGIs below $25k, 6.0% for AGIs $25k-50k, 8.7% for AGIs $50k-75k, 9.6% for AGIs $75k-100k, 12.3% for AGIs $100k-200k, 10.3% for AGIs over 200k)
Charity contributions: $5,837 (reported on 19.0% of returns)
Here:
$5,837
State:
$3,943
(% of AGI for various income ranges: 0.5% for AGIs below $25k, 1.1% for AGIs $25k-50k, 1.8% for AGIs $50k-75k, 1.9% for AGIs $75k-100k, 2.3% for AGIs $100k-200k, 2.5% for AGIs over 200k)
Taxes paid: $9,813 (reported on 23.5% of returns)
45805:
$9,813
State:
$9,568
(% of AGI for various income ranges: 0.8% for AGIs below $25k, 1.5% for AGIs $25k-50k, 2.6% for AGIs $50k-75k, 3.2% for AGIs $75k-100k, 5.3% for AGIs $100k-200k, 6.1% for AGIs over 200k)
Earned income credit: $2,169 (reported on 20.1% of returns)
Here:
$2,169
State:
$2,285
(% of AGI for various income ranges: 6.8% for AGIs below $25k, 1.0% for AGIs $25k-50k)
Percentage of individuals using paid preparers for their 2012 taxes: 52.1%
Here:
52%
State:
51%
(% for various income ranges: 43.3% for AGIs below $25k, 53.6% for AGIs $25k-50k, 58.3% for AGIs $50k-75k, 60.2% for AGIs $75k-100k, 64.6% for AGIs $100k-200k, 82.4% for AGIs over 200k)
Averages for the 2004 tax year for zip code 45805, filed in 2005:
Average Adjusted Gross Income (AGI) in 2004: $50,844 (Individual Income Tax Returns)
Here:
$50,844
State:
$44,480
Salary/wage: $40,733 (reported on 83.9% of returns)
Here:
$40,733
State:
$39,198
(% of AGI for various income ranges: 101.5% for AGIs below $10k, 70.8% for AGIs $10k-25k, 77.7% for AGIs $25k-50k, 77.9% for AGIs $50k-75k, 79.6% for AGIs $75k-100k, 52.8% for AGIs over 100k)
Taxable interest for individuals: $2,212 (reported on 45.5% of returns)
This zip code:
$2,212
Ohio:
$1,532
(% of AGI for various income ranges: 5.0% for AGIs below $10k, 3.2% for AGIs $10k-25k, 1.7% for AGIs $25k-50k, 1.2% for AGIs $50k-75k, 1.7% for AGIs $75k-100k, 2.1% for AGIs over 100k)
Taxable dividends: $5,104 (reported on 27.4% of returns)
Here:
$5,104
State:
$3,496
(% of AGI for various income ranges: 4.1% for AGIs below $10k, 1.9% for AGIs $10k-25k, 1.2% for AGIs $25k-50k, 1.5% for AGIs $50k-75k, 1.8% for AGIs $75k-100k, 4.3% for AGIs over 100k)
Net capital gain/loss: +$11,014 (reported on 20.5% of returns)
Here:
+$11,014
State:
+$8,582
(% of AGI for various income ranges: -0.7% for AGIs below $10k, 0.3% for AGIs $10k-25k, 0.6% for AGIs $25k-50k, 1.0% for AGIs $50k-75k, 1.4% for AGIs $75k-100k, 9.4% for AGIs over 100k)
Profit/loss from business: +$16,891 (reported on 11.4% of returns)
Here:
+$16,891
State:
+$10,813
(% of AGI for various income ranges: -0.9% for AGIs below $10k, 3.5% for AGIs $10k-25k, 1.8% for AGIs $25k-50k, 2.5% for AGIs $50k-75k, 2.2% for AGIs $75k-100k, 5.8% for AGIs over 100k)
IRA payment deduction: $3,054 (reported on 1.9% of returns)
45805:
$3,054
Ohio:
$2,794
(% of AGI for various income ranges: 0.2% for AGIs $10k-25k, 0.2% for AGIs $25k-50k, 0.2% for AGIs $50k-75k, 0.1% for AGIs $75k-100k, 0.1% for AGIs over 100k)
Self-employed pension: $13,824 (reported on 0.8% of returns)
Here:
$13,824
Ohio:
$13,981
(% of AGI for various income ranges: 0.1% for AGIs $10k-25k, 0.1% for AGIs $50k-75k, 0.1% for AGIs $75k-100k, 0.4% for AGIs over 100k)
Total itemized deductions: $19,189 (17% of AGI, reported on 30.0% of returns)
Here:
$19,189
State:
$17,503
Here:
17.4% of AGI
State:
20.8% of AGI
(% of AGI for various income ranges: 8.8% for AGIs below $10k, 6.4% for AGIs $10k-25k, 8.5% for AGIs $25k-50k, 11.3% for AGIs $50k-75k, 14.1% for AGIs $75k-100k, 12.8% for AGIs over 100k)
Charity contributions deductions: $4,680 (4% of AGI, reported on 25.6% of returns)
Here:
$4,680
State:
$3,087
Here:
4.0% of AGI
State:
3.4% of AGI
(% of AGI for various income ranges: 0.5% for AGIs below $10k, 0.8% for AGIs $10k-25k, 1.4% for AGIs $25k-50k, 2.0% for AGIs $50k-75k, 2.5% for AGIs $75k-100k, 3.2% for AGIs over 100k)
Total tax: $9,298 (reported on 75.6% of returns)
45805:
$9,298
State:
$6,781
(% of AGI for various income ranges: 2.0% for AGIs below $10k, 4.1% for AGIs $10k-25k, 7.2% for AGIs $25k-50k, 9.7% for AGIs $50k-75k, 10.6% for AGIs $75k-100k, 21.6% for AGIs over 100k)
Earned income credit: $1,697 (reported on 13.9% of returns)
Here:
$1,697
State:
$1,696
Percentage of individuals using paid preparers for their 2004 taxes: 58.9%
Here:
59%
State:
55%
(% for various income ranges: 46.6% for AGIs below $10k, 59.4% for AGIs $10k-25k, 61.0% for AGIs $25k-50k, 63.5% for AGIs $50k-75k, 61.3% for AGIs $75k-100k, 71.8% for AGIs over 100k)
Likely homosexual households (counted as self-reported same-sex unmarried-partner households)
Lesbian couples: 0.0% of all households
Gay men: 0.1% of all households
Household received Food Stamps/SNAP in the past 12 months: 1,120 Household did not receive Food Stamps/SNAP in the past 12 months: 8,901
Women who had a birth in the past 12 months: 386 (148 now married, 232 unmarried) Women who did not have a birth in the past 12 months: 5,213 (1,929 now married, 3,284 unmarried)
Housing units in zip code 45805 with a mortgage: 3,802 (354 second mortgage, 335 both second mortgage and home equity loan) Houses without a mortgage: 227
Median monthly owner costs for units with a mortgage: $1,168 Median monthly owner costs for units without a mortgage: $524
Residents with income below the poverty level in 2022:
This zip code:
10.7%
Whole state:
13.4%
Residents with income below 50% of the poverty level in 2022:
This zip code:
6.4%
Whole state:
7.0%
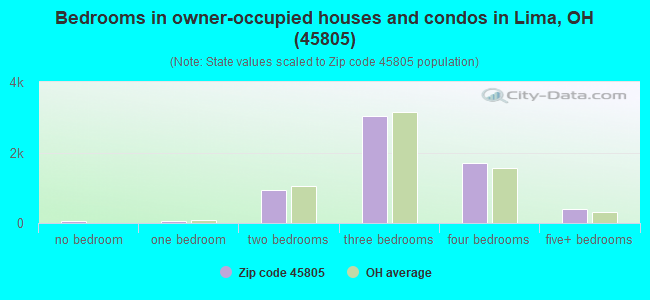
Median number of rooms in houses and condos:
Here:
6.7
State:
6.7
Median number of rooms in apartments:
Here:
5.0
State:
4.4
Notable locations in this zip code not listed on our city pages
Notable locations in zip code 45805: Shawnee Country Club (A), Lima Wastewater Treatment Plant (B), Lima Fire Department Station 4 (C), Shawnee Township Fire Department (D), American Township Fire Department Station 2 (E). Display/hide their locations on the map
Churches in zip code 45805 include: Market Street Presbyterian Church (A), Calvary United Church of Christ (B), First Baptist Church (C), First Church of Christ Scientist (D), High Street United Methodist Church (E), Peace Lutheran Church (F), Saint Charles Catholic Church (G), Saint Paul African Methodist Episcopal Church (H), Sharon Park United Methodist Church (I). Display/hide their locations on the map
2,629 married couples with children.
1,961 single-parent households (650 men, 1,311 women).
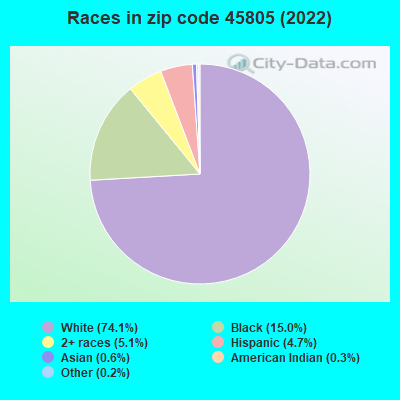
96.1% of residents of 45805 zip code speak English at home.
1.9% of residents speak Spanish at home (88% very well, 8% well, 4% not well).
0.9% of residents speak other Indo-European language at home (92% very well, 8% well).
0.6% of residents speak Asian or Pacific Island language at home (48% very well, 4% well, 48% not well).
0.3% of residents speak other language at home (100% very well).
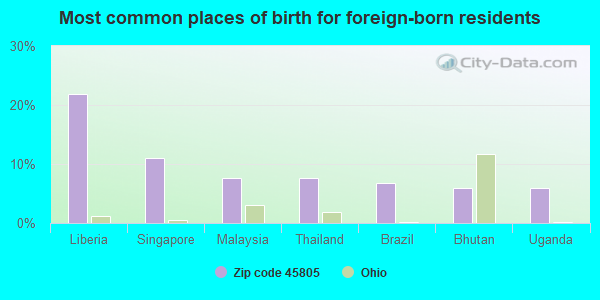
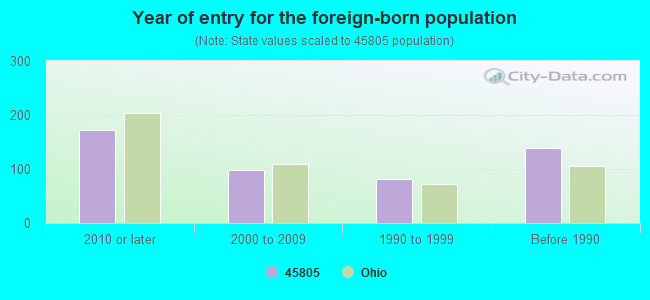
Foreign born population: 372 (1.5%) (69.8% of them are naturalized citizens)
Major facilities with environmental interests located in this zip code:
BP AMOCO CHEMICAL COMPANY (1900 FORT AMANDA ROAD in LIMA, OH)
AIR MAJOR (AIRS/AFS) - ICIS-, ENFORCEMENT/COMPLIANCE ACTIVITY, ICIS-05-2003-0349, (Integrated Compliance Information System) - ICIS-05-1985-0307, FORMAL ENFORCEMENT ACTION, ICIS-05-2002-1009, ICIS-05-2004-9001, ENFORCEMENT/COMPLIANCE ACTIVITY, ICIS-05-1995-0229, (Integrated Compliance Information System) - ICIS-05-1985-0307, FORMAL ENFORCEMENT ACTION, ICIS-05-2002-1009, ICIS-05-2004-9001, ENFORCEMENT/COMPLIANCE ACTIVITY, ICIS-05-1995-0229, COMPLIANCE ACTIVITY (Tracking inspections of insecticide, fungicide, and rodenticide, and toxic substances) - ICIS-05-2002-1009, FORMAL ENFORCEMENT ACTION CRITERIA AND HAZARDOUS AIR POLLUTANT INVENTORY (Inventory of air pollution sources) STATE MASTER (Ohio general info) - RCRA-OHD042157644, HAZARDOUS WASTE PROGRAM, AIR MAJOR, EPCRA, TRIS-45805BPCHMFORTA, TRI REPORTER National Pollutant Discharge Elimination System MAJOR (Tracking pollutant discharge elimination systems) - permit AIR MAJOR ("Best Available" air pollution technologies tracking) HAZARDOUS WASTE BIENNIAL REPORTER (Resource Conservation and Recovery Act (tracking hazardous waste)) Large Quantity Generators, more that 1000 kg of hazardous waste/month (Resource Conservation and Recovery Act (tracking hazardous waste)) - notification TSD (Resource Conservation and Recovery Act (tracking hazardous waste)) - notification TRI REPORTER (Tracking of toxic chemicals releasing facilities) Business SIC classification: INDUSTRIAL INORGANIC CHEMICALS; PLASTICS MATERIALS, SYNTHETIC RESINS, AND NONVULCANIZABLE ELASTOMERS; INDUSTRIAL ORGANIC CHEMICALS; NITROGENOUS FERTILIZERS Business NAICS classification: ALL OTHER BASIC ORGANIC CHEMICAL MANUFACTURING.; PLASTICS MATERIAL AND RESIN MANUFACTURING.; PLASTICS MATERIAL AND RESIN MANUFACTURING. Organizations: INNOVENE USA LLC (CONTACT/OPERATOR)
, PCS NITROGEN OHIO, L.P. (CONTACT/OWNER)
, BP AMERICA INC (CONTACT/OWNER)
Alternative names: B P CHEMICALS, BP CHEMICALS INC, INEOS USA LLC, LIMA CHEMICALS COMPLEX, LIMA CHEMICALS COMPLEX, PCS NITROGEN OHIO, L.P.
ADVANTAGE CLEANERS INC (702 N CABLE RD in LIMA, OH)
STATE MASTER (Ohio general info) - AIR MAJOR Conditionally Exempt Small Quantity Generators, less than 100 kg/month of hazardous waste (Resource Conservation and Recovery Act (tracking hazardous waste)) - notification Business SIC classification: DRYCLEANING PLANTS, EXCEPT RUG CLEANING Organizations: TIMOTHY SUEVER (CONTACT/OWNER)
Alternative names: ADVANTAGE DRY CLEANERS
AMI TOM BUICK INC (2525 ALLENTOWN RD in LIMA, OH)
STATE MASTER (Ohio general info) - RCRA-OHD018110734, HAZARDOUS WASTE PROGRAM Small Quantity Generators, between 100 kg and 1000 kg of hazardous waste/month (Resource Conservation and Recovery Act (tracking hazardous waste)) - notification Organizations: AML TOM (CONTACT/OWNER)
, UNKNOWN (CONTACT/OWNER)
ALLOWAY ENVIRONMENTAL TESTING LABORATORY (1101 N COLE ST in LIMA, OH)
STATE MASTER (Ohio general info) - RCRA-OHD987037629, HAZARDOUS WASTE PROGRAM Conditionally Exempt Small Quantity Generators, less than 100 kg/month of hazardous waste (Resource Conservation and Recovery Act (tracking hazardous waste)) - notification Organizations: HOFFMAN JOHN R (CONTACT/OWNER)
AMERICAN COIN LAUNDRY (2575 SHARON PLACE in LIMA, OH)
STATE MASTER (Ohio general info) - AIR MAJOR, RCRA-OHR000007815, HAZARDOUS WASTE PROGRAM Conditionally Exempt Small Quantity Generators, less than 100 kg/month of hazardous waste (Resource Conservation and Recovery Act (tracking hazardous waste)) - notification Business SIC classification: DRYCLEANING PLANTS, EXCEPT RUG CLEANING Organizations: ED DAVIS JR (CONTACT/OWNER)
BP OIL CO (2075 ALLENTOWN RD in LIMA, OH)
STATE MASTER (Ohio general info) - RCRA-OHD987014453, HAZARDOUS WASTE PROGRAM, AIR MAJOR, -02-5541-168-5, EPCRA Conditionally Exempt Small Quantity Generators, less than 100 kg/month of hazardous waste (Resource Conservation and Recovery Act (tracking hazardous waste)) - notification Organizations: BP OIL COMPANY (CONTACT/OWNER)
BP OIL CO (3295 ELIDA in LIMA, OH)
STATE MASTER (Ohio general info) - RCRA-OHD987015054, HAZARDOUS WASTE PROGRAM, AIR MAJOR, -02-5541-168-1, EPCRA Conditionally Exempt Small Quantity Generators, less than 100 kg/month of hazardous waste (Resource Conservation and Recovery Act (tracking hazardous waste)) - notification Organizations: BP OIL COMPANY (CONTACT/OWNER)
BP OIL CO SITE 07487 (2505 ELIDA RD in LIMA, OH)
(Resource Conservation and Recovery Act (tracking hazardous waste)) Organizations: BP OIL COMPANY (CONTACT/OWNER)
AMAZON ENVIRONMENTAL INC (815 SHAWNEE RD in LIMA, OH)
(Resource Conservation and Recovery Act (tracking hazardous waste)) Organizations: LORRAINE SEGALA (CONTACT/OWNER)
BP OIL CO (2307 W ELM AND CABLE in LIMA, OH)
(Resource Conservation and Recovery Act (tracking hazardous waste)) Organizations: BP OIL COMPANY (CONTACT/OWNER)
Housing units lacking complete plumbing facilities: 1.6% Housing units lacking complete kitchen facilities: 2.0%
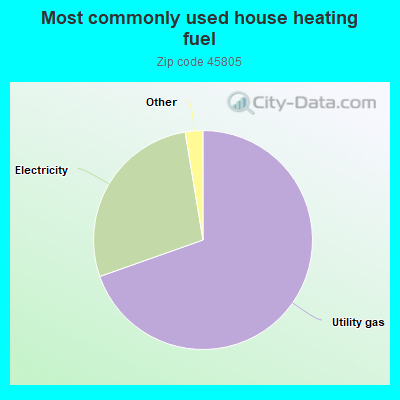
69.6%Utility gas
27.8%Electricity
0.8%Bottled, tank, or LP gas
0.7%Fuel oil, kerosene, etc.
0.7%Wood
Population in 1990: 23,080. Population change in the 1990s: +205 (+0.9%).
Place of birth for U.S.-born residents:
This state: 19,262
Northeast: 774
Midwest: 1,759
South: 1,683
West: 635
56% of the 45805 zip code residents lived in the same house 5 years ago. Out of people who lived in different houses, 62% lived in this county. Out of people who lived in different counties, 50% lived in Ohio.
87% of the 45805 zip code residents lived in the same house 1 year ago. Out of people who lived in different houses, 63% moved from this county. Out of people who lived in different houses, 17% moved from different county within same state. Out of people who lived in different houses, 10% moved from different state. Out of people who lived in different houses, 7% moved from abroad.
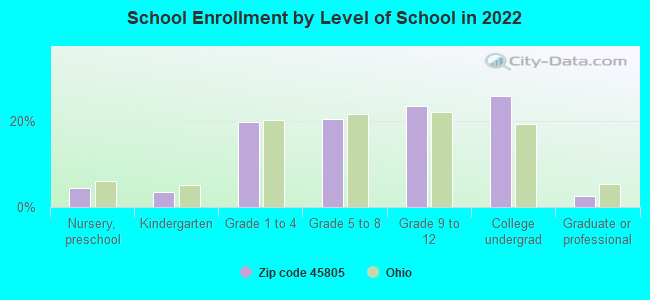
Private vs. public school enrollment:
Students in private schools in grades 1 to 8 (elementary and middle school): 508
Here:
19.9%
Ohio:
16.0%
Students in private schools in grades 9 to 12 (high school): 249
Here:
16.8%
Ohio:
13.1%
Students in private undergraduate colleges: 773
Here:
47.5%
Ohio:
22.3%
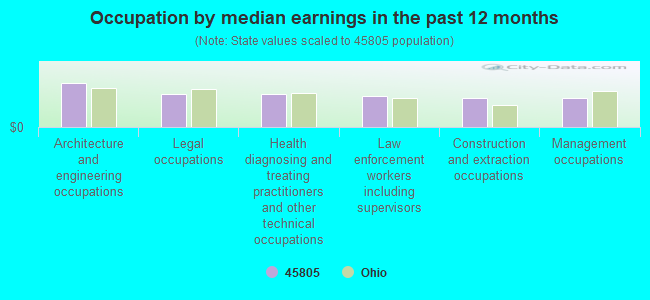
Occupation by median earnings in the past 12 months ($)
100,987Architecture and engineering occupations
74,837Legal occupations
74,782Health diagnosing and treating practitioners and other technical occupations
72,136Law enforcement workers including supervisors
66,843Construction and extraction occupations
66,062Management occupations
Companies with federal contracts located in this zip code:
TITANIUM ENG & MFG (1509 FAIRFIELD DR in LIMA, OH; small business)
$4,746 with Defense Logistics Agency for Vehicular Cab, Body, and Frame Structural Components. Signed on 2005-06-10. Completion date: 2005-10-08.
Top industries in this zip code by the number of employees in 2005:
2002 - 2018 National Fire Incident Reporting System (NFIRS) incidents
According to the data from the years 2002 - 2018 the average number of fires per year is 83. The highest number of reported fire incidents - 103 took place in 2007, and the least - 66 in 2011. The data has a declining trend.
When looking into fire subcategories, the most incidents belonged to: Structure Fires (42.9%), and Outside Fires (37.4%).
Fire incident types reported to NFIRS in Zip Code 45805

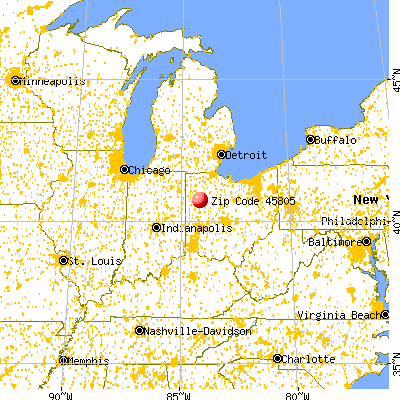


 Nearest zip codes: 45806, 45807, 45804, 45809, 45820, 45801.
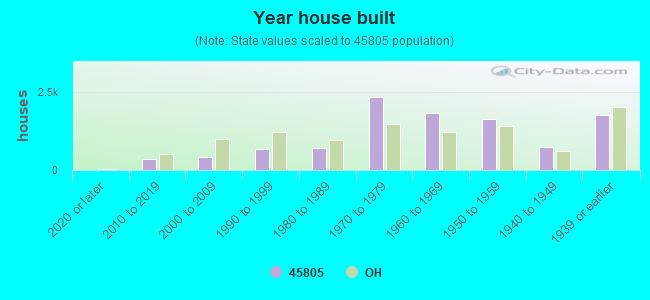


 According to the data from the years 2002 - 2018 the average number of fires per year is 83. The highest number of reported fire incidents - 103 took place in 2007, and the least - 66 in 2011. The data has a declining trend.
 When looking into fire subcategories, the most incidents belonged to: Structure Fires (42.9%), and Outside Fires (37.4%).