Estimated zip code population in 2022: 16,514 Zip code population in 2010: 14,755 Zip code population in 2000: 15,143
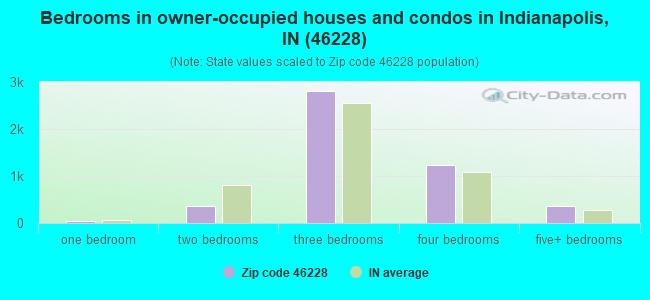
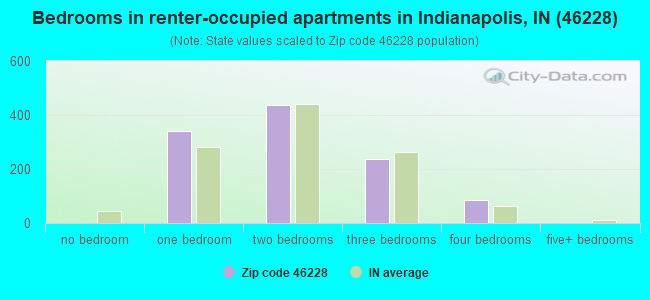
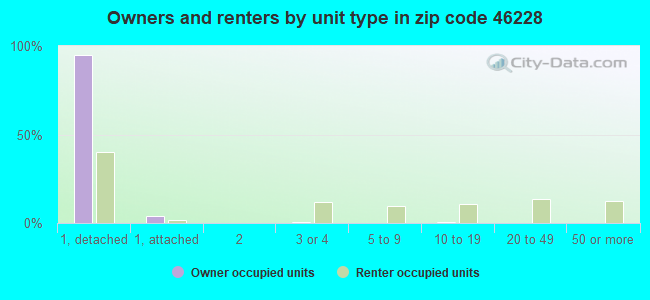
Houses and condos: 6,139 Renter-occupied apartments: 1,090
% of renters here:
18%
State:
29%
March 2022 cost of living index in zip code 46228: 87.9 (less than average, U.S. average is 100)
Land area: 8.0 sq. mi. Water area: 0.0 sq. mi.
Population density: 2,063 people per square mile
(low).
OSM Map
General Map
Google Map
MSN Map
OSM Map
General Map
Google Map
MSN Map
OSM Map
General Map
Google Map
MSN Map
OSM Map
General Map
Google Map
MSN Map
Please wait while loading the map...
Real estate property taxes paid for housing units in 2022:
This zip code:
0.8% ($1,874)
Indiana:
0.7% ($1,467)
Median real estate property taxes paid for housing units with mortgages in 2022: $1,798 (0.7%) Median real estate property taxes paid for housing units with no mortgage in 2022: $2,008 (0.8%)
Business Search- 14 Million verified businesses
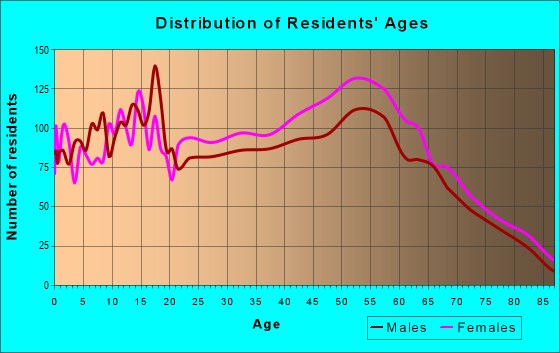
Males: 8,348
(50.6%)
Females: 8,166
(49.4%)
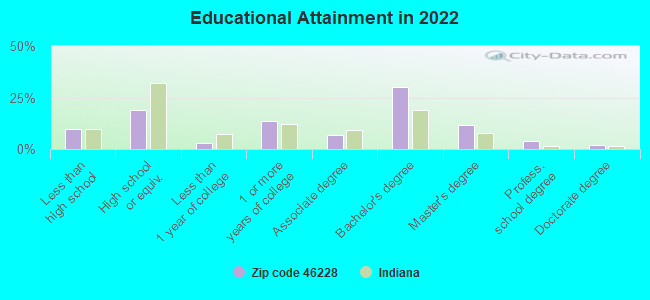
For population 25 years and over in 46228:
High school or higher: 91.5%
Bachelor's degree or higher: 48.4%
Graduate or professional degree: 17.7%
Unemployed: 4.0%
Mean travel time to work (commute): 23.6 minutes
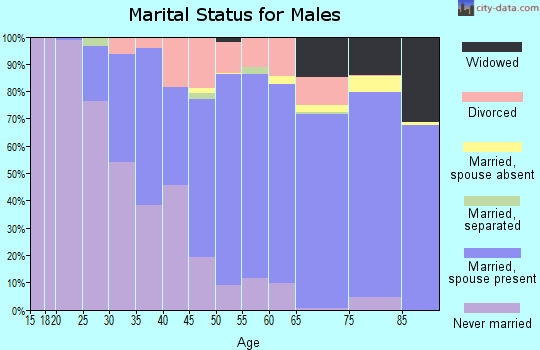
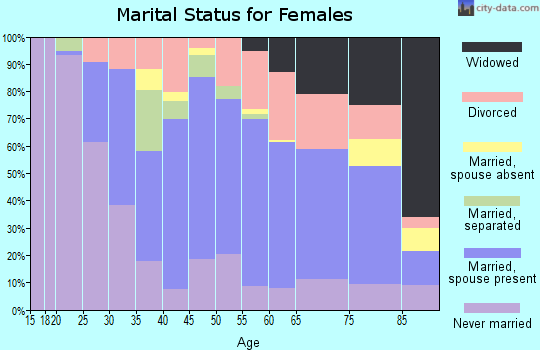
For population 15 years and over in 46228:
Never married: 38.3%
Now married: 42.9%
Separated: 1.1%
Widowed: 5.6%
Divorced: 12.1%
Zip code 46228 compared to state average:
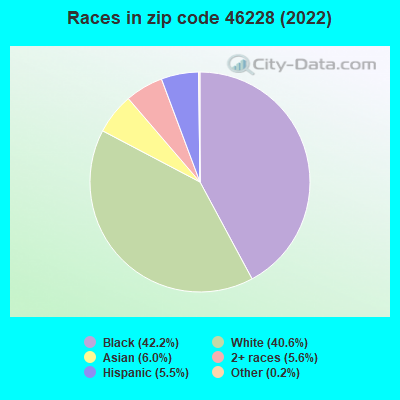
Black race population percentage significantly above state average.
Foreign-born population percentage significantly above state average.
Renting percentage below state average.
Length of stay since moving in significantly above state average.
Percentage of population with a bachelor's degree or higher above state average.
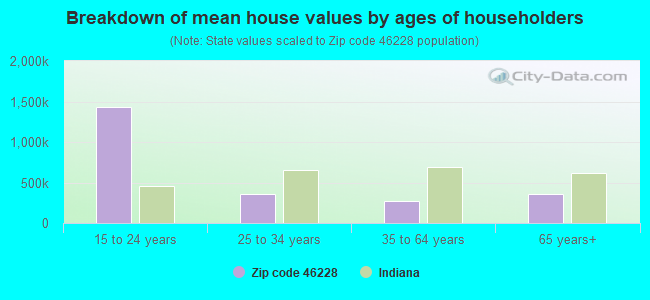
Estimated median house/condo value in 2022: $249,281
46228:
$249,281
Indiana:
$208,700
Median resident age:
This zip code:
37.8 years
Indiana median age:
38.2 years
Average household size:
This zip code:
2.8 people
Indiana:
2.4 people
Averages for the 2020 tax year for zip code 46228, filed in 2021:
Average Adjusted Gross Income (AGI) in 2020: $71,747 (Individual Income Tax Returns)
Here:
$71,747
State:
$64,978
Salary/wage: $60,344 (reported on 82.2% of returns)
Here:
$60,344
State:
$55,245
(% of AGI for various income ranges: 1116.9% for AGIs below $25k, 3787.8% for AGIs $25k-50k, 6693.3% for AGIs $50k-75k, 10028.4% for AGIs $75k-100k, 19239.4% for AGIs $100k-200k, 91773.6% for AGIs over 200k)
Taxable interest for individuals: $1,297 (reported on 25.6% of returns)
This zip code:
$1,297
Indiana:
$1,351
(% of AGI for various income ranges: 6.2% for AGIs below $25k, 8.9% for AGIs $25k-50k, 16.2% for AGIs $50k-75k, 44.5% for AGIs $75k-100k, 96.9% for AGIs $100k-200k, 1383.6% for AGIs over 200k)
Ordinary dividends: $10,224 (reported on 17.2% of returns)
Here:
$10,224
State:
$5,827
(% of AGI for various income ranges: 12.6% for AGIs below $25k, 24.6% for AGIs $25k-50k, 64.4% for AGIs $50k-75k, 116.7% for AGIs $75k-100k, 579.4% for AGIs $100k-200k, 8413.6% for AGIs over 200k)
Net capital gain/loss in AGI: +$23,004 (reported on 14.8% of returns)
Here:
+$23,004
State:
+$17,730
(% of AGI for various income ranges: 5.2% for AGIs below $25k, 18.6% for AGIs $25k-50k, 92.1% for AGIs $50k-75k, 151.4% for AGIs $75k-100k, 589.4% for AGIs $100k-200k, 20370.0% for AGIs over 200k)
Profit/loss from business: +$8,936 (reported on 18.3% of returns)
Here:
+$8,936
State:
+$12,144
(% of AGI for various income ranges: 118.1% for AGIs below $25k, 141.9% for AGIs $25k-50k, 129.4% for AGIs $50k-75k, 156.9% for AGIs $75k-100k, 729.3% for AGIs $100k-200k, 2478.2% for AGIs over 200k)
Taxable individual retirement arrangement distribution: $25,043 (reported on 9.1% of returns)
46228:
$25,043
Indiana:
$18,302
(% of AGI for various income ranges: 40.3% for AGIs below $25k, 84.8% for AGIs $25k-50k, 189.3% for AGIs $50k-75k, 354.5% for AGIs $75k-100k, 1082.2% for AGIs $100k-200k, 6352.7% for AGIs over 200k)
Self-employed (Keogh) retirement plans: $32,267 (reported on 0.4% of returns)
46228:
$32,267
Indiana:
$27,160
(% of AGI for various income ranges: 880.0% for AGIs over 200k)
Total itemized deductions: $35,557 (reported on 9.3% of returns)
Here:
$35,557
State:
$35,601
(% of AGI for various income ranges: 50.1% for AGIs below $25k, 150.3% for AGIs $25k-50k, 331.2% for AGIs $50k-75k, 476.3% for AGIs $75k-100k, 1174.6% for AGIs $100k-200k, 10393.6% for AGIs over 200k)
Charity contributions: $18,694 (reported on 8.0% of returns)
Here:
$18,694
State:
$15,596
(% of AGI for various income ranges: 3.4% for AGIs below $25k, 49.3% for AGIs $25k-50k, 108.2% for AGIs $50k-75k, 152.0% for AGIs $75k-100k, 437.2% for AGIs $100k-200k, 6490.9% for AGIs over 200k)
Taxes paid: $7,079 (reported on 9.3% of returns)
46228:
$7,079
State:
$7,542
(% of AGI for various income ranges: 4.4% for AGIs below $25k, 24.2% for AGIs $25k-50k, 77.7% for AGIs $50k-75k, 136.3% for AGIs $75k-100k, 335.9% for AGIs $100k-200k, 1460.9% for AGIs over 200k)
Earned income credit: $2,243 (reported on 15.5% of returns)
Here:
$2,243
State:
$2,298
(% of AGI for various income ranges: 88.6% for AGIs below $25k, 68.5% for AGIs $25k-50k)
Percentage of individuals using paid preparers for their 2020 taxes: 90.9%
Here:
91%
State:
94%
(% for various income ranges: 90.7% for AGIs below $25k, 91.7% for AGIs $25k-50k, 90.5% for AGIs $50k-75k, 89.6% for AGIs $75k-100k, 90.6% for AGIs $100k-200k, 91.9% for AGIs over 200k)
Averages for the 2012 tax year for zip code 46228, filed in 2013:
Average Adjusted Gross Income (AGI) in 2012: $67,166 (Individual Income Tax Returns)
Here:
$67,166
State:
$52,932
Salary/wage: $51,683 (reported on 84.4% of returns)
Here:
$51,683
State:
$45,173
(% of AGI for various income ranges: 73.1% for AGIs below $25k, 80.1% for AGIs $25k-50k, 77.2% for AGIs $50k-75k, 74.9% for AGIs $75k-100k, 74.9% for AGIs $100k-200k, 41.3% for AGIs over 200k)
Taxable interest for individuals: $1,946 (reported on 29.5% of returns)
This zip code:
$1,946
Indiana:
$1,311
(% of AGI for various income ranges: 0.5% for AGIs below $25k, 0.4% for AGIs $25k-50k, 0.5% for AGIs $50k-75k, 0.4% for AGIs $75k-100k, 0.6% for AGIs $100k-200k, 1.6% for AGIs over 200k)
Ordinary dividends: $10,263 (reported on 20.0% of returns)
Here:
$10,263
State:
$4,690
(% of AGI for various income ranges: 1.4% for AGIs below $25k, 0.8% for AGIs $25k-50k, 1.5% for AGIs $50k-75k, 1.3% for AGIs $75k-100k, 1.9% for AGIs $100k-200k, 6.5% for AGIs over 200k)
Net capital gain/loss in AGI: +$30,557 (reported on 14.9% of returns)
Here:
+$30,557
State:
+$10,406
(% of AGI for various income ranges: 0.8% for AGIs $75k-100k, 0.8% for AGIs $100k-200k, 20.2% for AGIs over 200k)
Profit/loss from business: +$9,954 (reported on 16.6% of returns)
Here:
+$9,954
State:
+$11,105
(% of AGI for various income ranges: 8.0% for AGIs below $25k, 1.9% for AGIs $25k-50k, 1.6% for AGIs $50k-75k, 1.6% for AGIs $75k-100k, 1.8% for AGIs $100k-200k, 2.7% for AGIs over 200k)
Taxable individual retirement arrangement distribution: $19,122 (reported on 10.7% of returns)
46228:
$19,122
Indiana:
$13,841
(% of AGI for various income ranges: 2.3% for AGIs below $25k, 2.3% for AGIs $25k-50k, 2.9% for AGIs $50k-75k, 4.0% for AGIs $75k-100k, 4.0% for AGIs $100k-200k, 2.6% for AGIs over 200k)
Self-employment retirement plans: $23,857 (reported on 0.9% of returns)
46228:
$23,857
Indiana:
$21,482
Total itemized deductions: $24,096 (19% of AGI, reported on 39.1% of returns)
Here:
$24,096
State:
$20,913
Here:
19.5% of AGI
State:
18.2% of AGI
(% of AGI for various income ranges: 10.1% for AGIs below $25k, 12.0% for AGIs $25k-50k, 14.2% for AGIs $50k-75k, 14.2% for AGIs $75k-100k, 14.6% for AGIs $100k-200k, 15.1% for AGIs over 200k)
Charity contributions: $7,695 (reported on 33.4% of returns)
Here:
$7,695
State:
$4,697
(% of AGI for various income ranges: 1.2% for AGIs below $25k, 2.1% for AGIs $25k-50k, 2.7% for AGIs $50k-75k, 3.2% for AGIs $75k-100k, 3.5% for AGIs $100k-200k, 6.0% for AGIs over 200k)
Taxes paid: $8,217 (reported on 39.0% of returns)
46228:
$8,217
State:
$7,456
(% of AGI for various income ranges: 1.6% for AGIs below $25k, 2.7% for AGIs $25k-50k, 4.0% for AGIs $50k-75k, 4.6% for AGIs $75k-100k, 5.9% for AGIs $100k-200k, 5.8% for AGIs over 200k)
Earned income credit: $2,217 (reported on 17.8% of returns)
Here:
$2,217
State:
$2,265
(% of AGI for various income ranges: 6.7% for AGIs below $25k, 1.1% for AGIs $25k-50k)
Percentage of individuals using paid preparers for their 2012 taxes: 43.7%
Here:
44%
State:
53%
(% for various income ranges: 40.1% for AGIs below $25k, 41.1% for AGIs $25k-50k, 45.5% for AGIs $50k-75k, 46.6% for AGIs $75k-100k, 46.1% for AGIs $100k-200k, 75.0% for AGIs over 200k)
Averages for the 2004 tax year for zip code 46228, filed in 2005:
Average Adjusted Gross Income (AGI) in 2004: $63,805 (Individual Income Tax Returns)
Here:
$63,805
State:
$44,790
Salary/wage: $50,610 (reported on 85.5% of returns)
Here:
$50,610
State:
$39,615
(% of AGI for various income ranges: 73.9% for AGIs $10k-25k, 77.9% for AGIs $25k-50k, 80.8% for AGIs $50k-75k, 82.8% for AGIs $75k-100k, 54.5% for AGIs over 100k)
Taxable interest for individuals: $2,366 (reported on 45.3% of returns)
This zip code:
$2,366
Indiana:
$1,535
(% of AGI for various income ranges: 1.6% for AGIs $10k-25k, 1.1% for AGIs $25k-50k, 1.0% for AGIs $50k-75k, 0.9% for AGIs $75k-100k, 2.2% for AGIs over 100k)
Taxable dividends: $7,531 (reported on 28.3% of returns)
Here:
$7,531
State:
$2,998
(% of AGI for various income ranges: 1.7% for AGIs $10k-25k, 1.4% for AGIs $25k-50k, 1.1% for AGIs $50k-75k, 1.2% for AGIs $75k-100k, 5.0% for AGIs over 100k)
Net capital gain/loss: +$15,038 (reported on 20.9% of returns)
Here:
+$15,038
State:
+$8,619
(% of AGI for various income ranges: 0.5% for AGIs $10k-25k, 0.5% for AGIs $25k-50k, 1.1% for AGIs $50k-75k, 0.5% for AGIs $75k-100k, 8.6% for AGIs over 100k)
Profit/loss from business: +$13,206 (reported on 15.6% of returns)
Here:
+$13,206
State:
+$10,071
(% of AGI for various income ranges: 5.0% for AGIs $10k-25k, 2.3% for AGIs $25k-50k, 2.8% for AGIs $50k-75k, 3.4% for AGIs $75k-100k, 3.5% for AGIs over 100k)
Profit/loss from farming: +$1,100 (reported on 0.1% of returns)
Here:
+$1,100
State:
-$2,212
IRA payment deduction: $2,381 (reported on 2.5% of returns)
46228:
$2,381
Indiana:
$2,840
(% of AGI for various income ranges: 0.2% for AGIs $10k-25k, 0.2% for AGIs $25k-50k, 0.1% for AGIs $50k-75k, 0.1% for AGIs $75k-100k, 0.0% for AGIs over 100k)
Self-employed pension: $27,753 (reported on 1.1% of returns)
Here:
$27,753
Indiana:
$15,305
Total itemized deductions: $19,976 (19% of AGI, reported on 49.4% of returns)
Here:
$19,976
State:
$17,065
Here:
19.0% of AGI
State:
19.5% of AGI
(% of AGI for various income ranges: 15.0% for AGIs $10k-25k, 17.4% for AGIs $25k-50k, 18.1% for AGIs $50k-75k, 17.8% for AGIs $75k-100k, 13.3% for AGIs over 100k)
Charity contributions deductions: $5,639 (5% of AGI, reported on 44.4% of returns)
Here:
$5,639
State:
$3,550
Here:
5.1% of AGI
State:
3.8% of AGI
(% of AGI for various income ranges: 2.1% for AGIs $10k-25k, 3.0% for AGIs $25k-50k, 3.5% for AGIs $50k-75k, 3.7% for AGIs $75k-100k, 4.5% for AGIs over 100k)
Total tax: $11,712 (reported on 77.1% of returns)
46228:
$11,712
State:
$6,914
(% of AGI for various income ranges: 4.1% for AGIs $10k-25k, 6.8% for AGIs $25k-50k, 9.5% for AGIs $50k-75k, 10.6% for AGIs $75k-100k, 19.2% for AGIs over 100k)
Earned income credit: $1,711 (reported on 12.3% of returns)
Here:
$1,711
State:
$1,685
Percentage of individuals using paid preparers for their 2004 taxes: 50.4%
Here:
50%
State:
59%
(% for various income ranges: 43.2% for AGIs below $10k, 54.3% for AGIs $10k-25k, 48.5% for AGIs $25k-50k, 49.4% for AGIs $50k-75k, 50.7% for AGIs $75k-100k, 58.8% for AGIs over 100k)
Likely homosexual households (counted as self-reported same-sex unmarried-partner households)
Lesbian couples: 0.1% of all households
Gay men: 0.2% of all households
Household received Food Stamps/SNAP in the past 12 months: 447 Household did not receive Food Stamps/SNAP in the past 12 months: 5,438
Women who had a birth in the past 12 months: 200 (216 now married, 0 unmarried) Women who did not have a birth in the past 12 months: 3,216 (1,229 now married, 1,984 unmarried)
Housing units in zip code 46228 with a mortgage: 3,197 (266 second mortgage, 12 home equity loan, 203 both second mortgage and home equity loan) Houses without a mortgage: 69
Median monthly owner costs for units with a mortgage: $1,357 Median monthly owner costs for units without a mortgage: $628
Residents with income below the poverty level in 2022:
This zip code:
12.4%
Whole state:
12.6%
Residents with income below 50% of the poverty level in 2022:
This zip code:
7.2%
Whole state:
6.3%
Median number of rooms in houses and condos:
Here:
7.2
State:
6.6
Median number of rooms in apartments:
Here:
4.2
State:
4.3
Notable locations in this zip code not listed on our city pages
Notable locations in zip code 46228: Highland Country Club (A), Broadmoor Country Club (B), Saddlebrook Golf Course (C), Indianapolis Fire Department - Emergency Medical Services Station 12 (D), Washington Township Fire Station 222 (E). Display/hide their locations on the map
Churches in zip code 46228 include: University United Methodist Church (A), Memorial United Methodist Church (B), Kingdom Hall (C), Kessler Krest Independent Baptist Church (D). Display/hide their locations on the map
In group quarters: 83 (-1 institutionalized population)
Size of family households: 1,556 2-persons, 752 3-persons, 632 4-persons, 512 5-persons, 123 6-persons, 109 7-or-more-persons
Size of nonfamily households: 1,760 1-person, 414 2-persons, 28 3-persons
1,851 married couples with children.
723 single-parent households (227 men, 496 women).
83.4% of residents of 46228 zip code speak English at home.
4.1% of residents speak Spanish at home (66% very well, 12% well, 19% not well, 3% not at all).
5.9% of residents speak other Indo-European language at home (70% very well, 12% well, 17% not well).
4.9% of residents speak Asian or Pacific Island language at home (42% very well, 14% well, 28% not well, 16% not at all).
1.8% of residents speak other language at home (77% very well, 23% well).
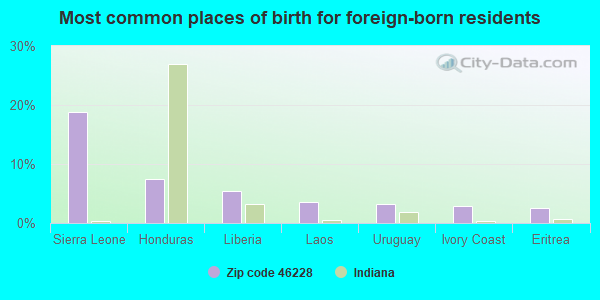
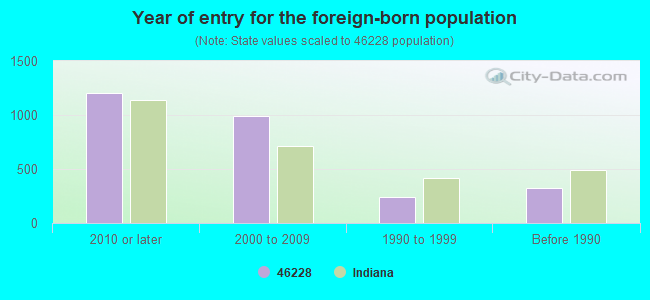
Foreign born population: 2,148 (13.0%) (51.7% of them are naturalized citizens)
This zip code:
13.0%
Whole state:
6.1%
19%Sierra Leone
7%Honduras
5%Liberia
4%Laos
3%Uruguay
3%Ivory Coast
3%Eritrea
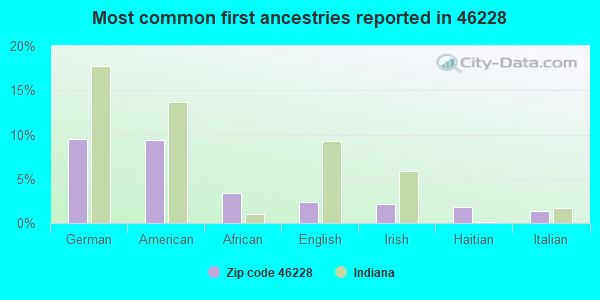
10%German
9%American
3%African
2%English
2%Irish
2%Haitian
1%Italian
Year of entry for the foreign-born population
1,2012010 or later
9892000 to 2009
2401990 to 1999
320Before 1990
Facilities with environmental interests located in this zip code:
APEX VENTILATING CO INC (2216 W 60TH ST in INDIANAPOLIS, IN)
STATE MASTER (Indiana facility tracking) - UST-9448, UNDERGROUND STORAGE TANK PROGRAM, LUST-199503537, LEAKING STORAGE TANK (Resource Conservation and Recovery Act (tracking hazardous waste)) Organizations: APEX INDUSTRIES INC (CONTACT/OPERATOR)
Alternative names: APEX INDUSTRIES INC
Housing units lacking complete kitchen facilities: 0.5%
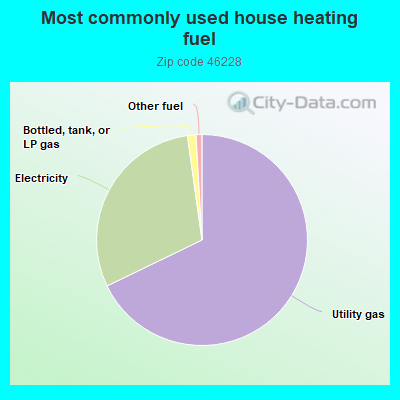
67.7%Utility gas
29.9%Electricity
1.3%Bottled, tank, or LP gas
0.9%Other fuel
Place of birth for U.S.-born residents:
This state: 9,749
Northeast: 384
Midwest: 1,631
South: 1,605
West: 555
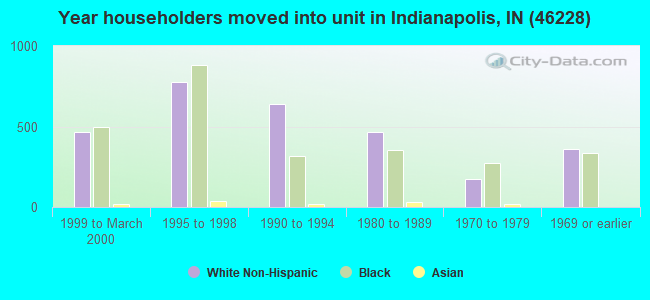
55% of the 46228 zip code residents lived in the same house 5 years ago. Out of people who lived in different houses, 73% lived in this county. Out of people who lived in different counties, 50% lived in Indiana.
89% of the 46228 zip code residents lived in the same house 1 year ago. Out of people who lived in different houses, 67% moved from this county. Out of people who lived in different houses, 21% moved from different county within same state. Out of people who lived in different houses, 10% moved from different state. Out of people who lived in different houses, 0% moved from abroad.
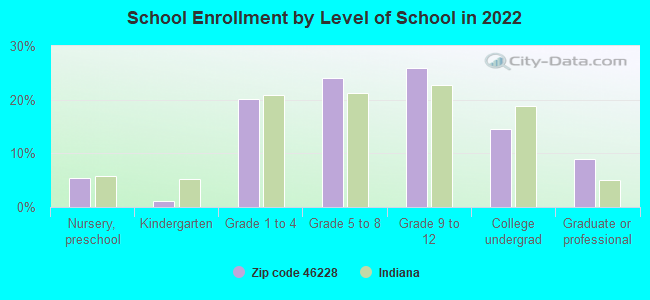
Private vs. public school enrollment:
Students in private schools in grades 1 to 8 (elementary and middle school): 625
Here:
31.9%
Indiana:
14.9%
Students in private schools in grades 9 to 12 (high school): 134
Here:
11.7%
Indiana:
11.4%
Students in private undergraduate colleges: 304
Here:
47.4%
Indiana:
22.3%
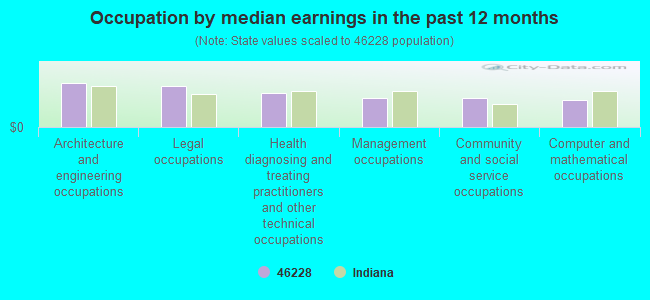
Occupation by median earnings in the past 12 months ($)
105,327Architecture and engineering occupations
97,722Legal occupations
82,305Health diagnosing and treating practitioners and other technical occupations
70,243Management occupations
70,077Community and social service occupations
64,043Computer and mathematical occupations
Companies with federal contracts located in this zip code:
G M CONSTRUCTION, INC (6002 NORTH MICHIGAN ROAD in INDIANAPOLIS, IN; small business) : $8,544,214 in 40 contractsfrom 1999 to 2003
Contracts for Construction of Structures and Facilities -- Other Airfield Structures, Construction of Structures and Facilities -- Other Administrative Facilities and Service Buildings, Maintenance, Repair or Alteration of Real Property -- Other Administrative Facilities and Service Buildings, Construction of Structures and Facilities -- Office Buildings, and moreby Army, Bureau of Prisoners/Federal Prison System Signed by year:2000: $558,388; 2001: $6,903,334; 2002: $416,502; 2003: $502,990; 2004: $0; 2005: $0; 2006: $0.
Biggest contracts:
$6,653,000 with Army for Construction of Structures and Facilities -- Other Airfield Structures. Signed on 2001-12-03. Completion date: 2004-01-16.
$194,430 with Army for Construction of Structures and Facilities -- Other Administrative Facilities and Service Buildings. Signed on 2002-09-25. Completion date: 2002-11-01.
$163,000 with Bureau of Prisoners/Federal Prison System for Maintenance, Repair or Alteration of Real Property -- Other Administrative Facilities and Service Buildings. Signed on 1999-11-15. Completion date: 2000-02-15.
$134,822 with Army for Construction of Structures and Facilities -- Other Airfield Structures. Signed on 2003-01-14. Completion date: 2004-01-16.
Top industries in this zip code by the number of employees in 2005:
Arts, Entertainment, and Recreation: Golf Courses and Country Clubs (50-99 employees: 1 establishment, 5-9 employees: 1 establishment)
Other Services (except Public Administration): Religious Organizations (10-19: 4, 5-9: 2, 1-4: 1)
Health Care and Social Assistance: Nursing Care Facilities (50-99: 1)
Construction: Commercial and Institutional Building Construction (50-99: 1)
Professional, Scientific, and Technical Services: Other Computer Related Services (50-99: 1)
Accommodation and Food Services: Limited-Service Restaurants (20-49: 1, 5-9: 1)
Health Care and Social Assistance: Child Day Care Services (20-49: 1, 1-4: 3)
Administrative and Support and Waste Management and Remediation Services: Janitorial Services (5-9: 4, 1-4: 5)
People in group quarters in 2010:
43 people in nursing facilities/skilled-nursing facilities
28 people in group homes intended for adults
8 people in residential treatment centers for adults
People in group quarters in 2000:
65 people in nursing homes
23 people in hospitals/wards and hospices for chronically ill
23 people in other hospitals or wards for chronically ill
7 people in religious group quarters
Fatal accident statistics in 2014:
Fatal accident count: 1
Vehicles involved in fatal accidents: 1
Fatal accidents caused by drunken drivers: 0
Fatalities: 1
Persons involved in fatal accidents: 1
Pedestrians involved in fatal accidents: 1
Fatal accident statistics in 2013:
Fatal accident count: 2
Vehicles involved in fatal accidents: 3
Fatal accidents caused by drunken drivers: 1
Fatalities: 2
Persons involved in fatal accidents: 3
Pedestrians involved in fatal accidents: 0
Home Mortgage Disclosure Act Aggregated Statistics For Year 2009 (Based on 4 full and 6 partial tracts)
A) FHA, FSA/RHS & VA Home Purchase Loans
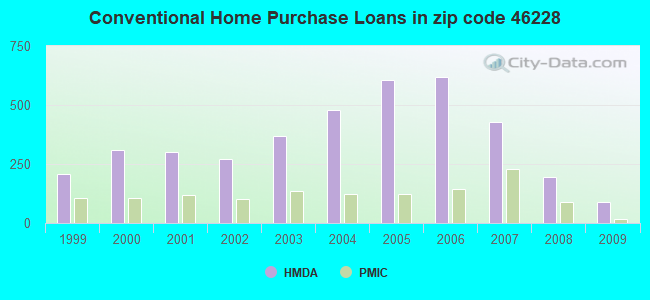
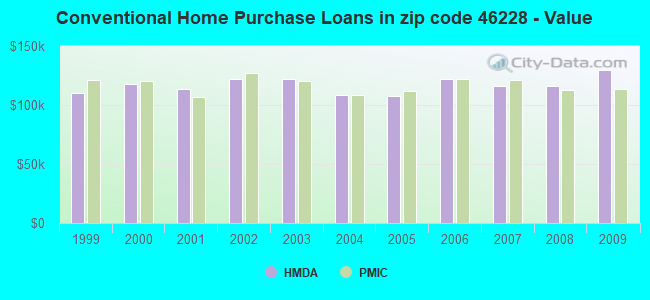
B) Conventional Home Purchase Loans
C) Refinancings
D) Home Improvement Loans
F) Non-occupant Loans on < 5 Family Dwellings (A B C & D)
G) Loans On Manufactured Home Dwelling (A B C & D)
Number
Average Value
Number
Average Value
Number
Average Value
Number
Average Value
Number
Average Value
Number
Average Value
LOANS ORIGINATED
230
$114,883
91
$130,010
648
$147,042
18
$50,576
28
$97,439
0
$0
APPLICATIONS APPROVED, NOT ACCEPTED
14
$123,063
8
$103,830
53
$131,086
5
$4,480
3
$88,657
0
$0
APPLICATIONS DENIED
52
$104,503
21
$95,795
280
$154,613
30
$30,484
7
$74,760
2
$98,305
APPLICATIONS WITHDRAWN
42
$117,191
12
$112,618
196
$134,176
4
$115,242
9
$90,280
0
$0
FILES CLOSED FOR INCOMPLETENESS
5
$85,650
3
$128,497
52
$130,097
5
$155,262
2
$151,900
0
$0
Aggregated Statistics For Year 2008 (Based on 4 full and 6 partial tracts)
A) FHA, FSA/RHS & VA Home Purchase Loans
B) Conventional Home Purchase Loans
C) Refinancings
D) Home Improvement Loans
E) Loans on Dwellings For 5+ Families
F) Non-occupant Loans on < 5 Family Dwellings (A B C & D)
G) Loans On Manufactured Home Dwelling (A B C & D)
Number
Average Value
Number
Average Value
Number
Average Value
Number
Average Value
Number
Average Value
Number
Average Value
Number
Average Value
LOANS ORIGINATED
201
$123,820
194
$116,139
357
$140,269
46
$75,684
4
$190,358
54
$86,588
0
$0
APPLICATIONS APPROVED, NOT ACCEPTED
16
$150,019
21
$124,507
58
$142,157
5
$8,600
0
$0
5
$67,494
0
$0
APPLICATIONS DENIED
62
$125,188
56
$98,933
374
$129,687
92
$24,675
0
$0
28
$87,538
0
$0
APPLICATIONS WITHDRAWN
23
$121,386
22
$118,750
136
$129,123
12
$44,300
0
$0
10
$58,241
1
$60,650
FILES CLOSED FOR INCOMPLETENESS
7
$92,597
8
$75,230
40
$177,540
7
$46,643
0
$0
5
$325,758
0
$0
Aggregated Statistics For Year 2007 (Based on 4 full and 6 partial tracts)
A) FHA, FSA/RHS & VA Home Purchase Loans
B) Conventional Home Purchase Loans
C) Refinancings
D) Home Improvement Loans
E) Loans on Dwellings For 5+ Families
F) Non-occupant Loans on < 5 Family Dwellings (A B C & D)
Number
Average Value
Number
Average Value
Number
Average Value
Number
Average Value
Number
Average Value
Number
Average Value
LOANS ORIGINATED
99
$125,719
428
$116,488
497
$156,555
50
$44,264
4
$5,247,802
87
$95,530
APPLICATIONS APPROVED, NOT ACCEPTED
6
$149,700
40
$96,530
92
$109,042
13
$61,132
0
$0
16
$80,708
APPLICATIONS DENIED
33
$130,038
132
$121,740
549
$120,715
122
$50,930
0
$0
60
$103,642
APPLICATIONS WITHDRAWN
27
$126,176
61
$125,173
171
$128,884
23
$118,177
0
$0
20
$125,247
FILES CLOSED FOR INCOMPLETENESS
1
$98,020
24
$106,040
63
$146,220
4
$12,098
0
$0
6
$124,508
Aggregated Statistics For Year 2006 (Based on 4 full and 6 partial tracts)
A) FHA, FSA/RHS & VA Home Purchase Loans
B) Conventional Home Purchase Loans
C) Refinancings
D) Home Improvement Loans
F) Non-occupant Loans on < 5 Family Dwellings (A B C & D)
G) Loans On Manufactured Home Dwelling (A B C & D)
Number
Average Value
Number
Average Value
Number
Average Value
Number
Average Value
Number
Average Value
Number
Average Value
LOANS ORIGINATED
80
$123,401
617
$122,377
532
$128,473
85
$49,465
117
$93,640
3
$41,807
APPLICATIONS APPROVED, NOT ACCEPTED
6
$131,920
102
$139,579
139
$117,115
11
$38,348
19
$103,686
0
$0
APPLICATIONS DENIED
31
$137,058
233
$121,591
599
$129,897
129
$40,801
56
$91,982
3
$57,867
APPLICATIONS WITHDRAWN
17
$149,760
145
$98,792
302
$125,673
17
$54,767
19
$74,747
1
$136,680
FILES CLOSED FOR INCOMPLETENESS
1
$150,300
31
$104,404
137
$136,548
4
$101,110
9
$112,303
0
$0
Aggregated Statistics For Year 2005 (Based on 4 full and 6 partial tracts)
A) FHA, FSA/RHS & VA Home Purchase Loans
B) Conventional Home Purchase Loans
C) Refinancings
D) Home Improvement Loans
E) Loans on Dwellings For 5+ Families
F) Non-occupant Loans on < 5 Family Dwellings (A B C & D)
G) Loans On Manufactured Home Dwelling (A B C & D)
Number
Average Value
Number
Average Value
Number
Average Value
Number
Average Value
Number
Average Value
Number
Average Value
Number
Average Value
LOANS ORIGINATED
110
$126,242
605
$107,741
734
$121,772
94
$35,280
4
$2,107,425
121
$86,727
0
$0
APPLICATIONS APPROVED, NOT ACCEPTED
9
$127,982
82
$106,648
154
$123,491
25
$21,612
0
$0
17
$126,504
2
$60,645
APPLICATIONS DENIED
31
$132,916
212
$99,240
665
$117,679
113
$30,280
0
$0
41
$97,568
4
$77,842
APPLICATIONS WITHDRAWN
17
$155,214
80
$104,412
292
$133,263
48
$136,984
1
$1,183,000
24
$107,934
1
$26,370
FILES CLOSED FOR INCOMPLETENESS
5
$129,722
31
$119,575
129
$138,230
3
$50,080
0
$0
10
$108,876
0
$0
Aggregated Statistics For Year 2004 (Based on 4 full and 6 partial tracts)
A) FHA, FSA/RHS & VA Home Purchase Loans
B) Conventional Home Purchase Loans
C) Refinancings
D) Home Improvement Loans
F) Non-occupant Loans on < 5 Family Dwellings (A B C & D)
G) Loans On Manufactured Home Dwelling (A B C & D)
Number
Average Value
Number
Average Value
Number
Average Value
Number
Average Value
Number
Average Value
Number
Average Value
LOANS ORIGINATED
89
$112,156
479
$108,692
881
$127,896
105
$47,324
122
$89,531
1
$69,880
APPLICATIONS APPROVED, NOT ACCEPTED
13
$104,126
90
$89,272
206
$118,295
20
$39,676
14
$101,737
0
$0
APPLICATIONS DENIED
34
$110,964
134
$104,994
620
$111,597
90
$41,915
30
$89,938
3
$18,607
APPLICATIONS WITHDRAWN
10
$118,715
58
$103,527
336
$124,911
17
$16,742
15
$118,406
0
$0
FILES CLOSED FOR INCOMPLETENESS
2
$97,315
19
$97,403
159
$130,803
2
$158,700
8
$105,425
0
$0
Aggregated Statistics For Year 2003 (Based on 4 full and 6 partial tracts)
A) FHA, FSA/RHS & VA Home Purchase Loans
B) Conventional Home Purchase Loans
C) Refinancings
D) Home Improvement Loans
F) Non-occupant Loans on < 5 Family Dwellings (A B C & D)
Number
Average Value
Number
Average Value
Number
Average Value
Number
Average Value
Number
Average Value
LOANS ORIGINATED
177
$107,721
370
$122,010
1,905
$124,119
86
$23,605
125
$89,623
APPLICATIONS APPROVED, NOT ACCEPTED
21
$125,714
48
$107,096
245
$105,619
12
$11,088
19
$93,134
APPLICATIONS DENIED
22
$117,380
95
$101,076
623
$108,431
63
$21,065
29
$80,685
APPLICATIONS WITHDRAWN
12
$119,317
51
$108,324
355
$117,131
9
$55,441
12
$81,479
FILES CLOSED FOR INCOMPLETENESS
7
$87,313
11
$83,216
93
$109,971
4
$18,502
8
$92,178
Aggregated Statistics For Year 2002 (Based on 4 full and 4 partial tracts)
A) FHA, FSA/RHS & VA Home Purchase Loans
B) Conventional Home Purchase Loans
C) Refinancings
D) Home Improvement Loans
F) Non-occupant Loans on < 5 Family Dwellings (A B C & D)
Number
Average Value
Number
Average Value
Number
Average Value
Number
Average Value
Number
Average Value
LOANS ORIGINATED
117
$104,592
270
$122,074
1,229
$124,922
83
$26,667
75
$85,065
APPLICATIONS APPROVED, NOT ACCEPTED
13
$91,325
41
$106,472
248
$100,427
28
$17,806
9
$98,270
APPLICATIONS DENIED
13
$93,993
58
$80,001
499
$93,350
104
$12,025
19
$71,405
APPLICATIONS WITHDRAWN
13
$114,346
22
$79,854
221
$108,731
14
$45,582
14
$119,573
FILES CLOSED FOR INCOMPLETENESS
2
$112,395
20
$101,916
122
$110,849
6
$23,120
13
$81,987
Aggregated Statistics For Year 2001 (Based on 4 full and 4 partial tracts)
A) FHA, FSA/RHS & VA Home Purchase Loans
B) Conventional Home Purchase Loans
C) Refinancings
D) Home Improvement Loans
F) Non-occupant Loans on < 5 Family Dwellings (A B C & D)
Number
Average Value
Number
Average Value
Number
Average Value
Number
Average Value
Number
Average Value
LOANS ORIGINATED
159
$112,111
299
$113,960
1,020
$118,315
99
$28,007
52
$83,224
APPLICATIONS APPROVED, NOT ACCEPTED
11
$103,573
48
$82,692
159
$82,379
28
$26,614
12
$63,264
APPLICATIONS DENIED
15
$98,547
55
$101,030
515
$95,041
109
$16,696
18
$58,533
APPLICATIONS WITHDRAWN
3
$125,247
28
$100,457
240
$111,525
14
$25,676
7
$101,230
FILES CLOSED FOR INCOMPLETENESS
2
$92,160
6
$110,252
75
$111,749
0
$0
3
$117,793
Aggregated Statistics For Year 2000 (Based on 4 full and 4 partial tracts)
A) FHA, FSA/RHS & VA Home Purchase Loans
B) Conventional Home Purchase Loans
C) Refinancings
D) Home Improvement Loans
F) Non-occupant Loans on < 5 Family Dwellings (A B C & D)
Number
Average Value
Number
Average Value
Number
Average Value
Number
Average Value
Number
Average Value
LOANS ORIGINATED
257
$113,192
309
$117,958
382
$85,126
133
$27,452
47
$87,421
APPLICATIONS APPROVED, NOT ACCEPTED
5
$103,438
40
$132,870
157
$75,504
68
$15,790
11
$60,660
APPLICATIONS DENIED
32
$106,688
96
$97,930
389
$72,514
169
$18,442
18
$79,871
APPLICATIONS WITHDRAWN
18
$104,552
29
$90,563
142
$81,350
17
$53,040
3
$28,090
FILES CLOSED FOR INCOMPLETENESS
3
$109,323
13
$112,334
67
$102,724
4
$37,595
7
$106,117
Aggregated Statistics For Year 1999 (Based on 2 full and 3 partial tracts)
A) FHA, FSA/RHS & VA Home Purchase Loans
B) Conventional Home Purchase Loans
C) Refinancings
D) Home Improvement Loans
E) Loans on Dwellings For 5+ Families
F) Non-occupant Loans on < 5 Family Dwellings (A B C & D)
2003 - 2018 National Fire Incident Reporting System (NFIRS) incidents
Based on the data from the years 2003 - 2018 the average number of fire incidents per year is 24. The highest number of fires - 48 took place in 2011, and the least - 0 in 2016. The data has an increasing trend.
When looking into fire subcategories, the most incidents belonged to: Structure Fires (67.4%), and Outside Fires (18.5%).
Fire incident types reported to NFIRS in Zip Code 46228


+$1,100
-$2,212
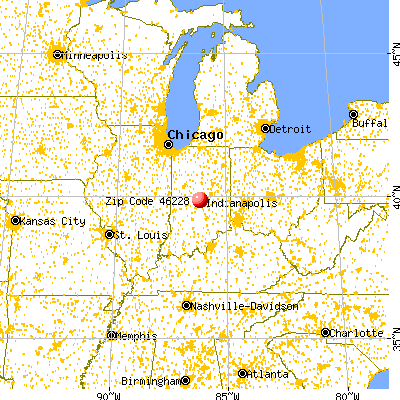
 Nearest zip codes: 46208, 46260, 46222, 46268, 46205, 46254.


 Based on the data from the years 2003 - 2018 the average number of fire incidents per year is 24. The highest number of fires - 48 took place in 2011, and the least - 0 in 2016. The data has an increasing trend.
 When looking into fire subcategories, the most incidents belonged to: Structure Fires (67.4%), and Outside Fires (18.5%).