Estimated zip code population in 2022: 4,887 Zip code population in 2010: 4,760 Zip code population in 2000: 3,981
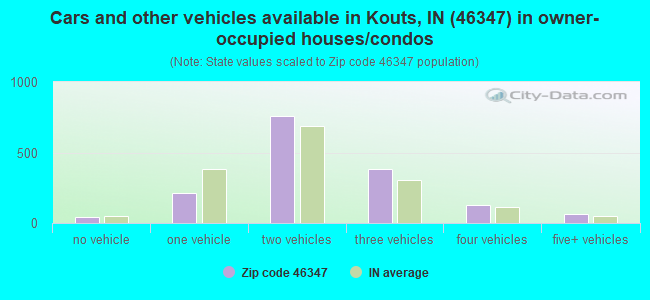
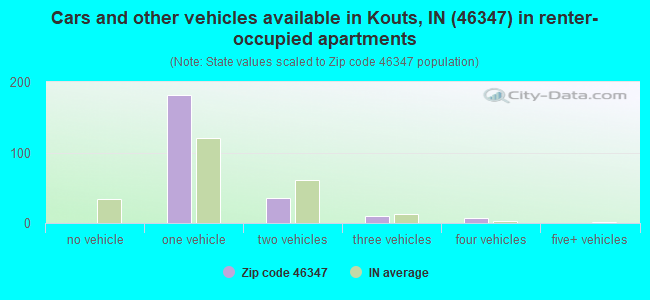
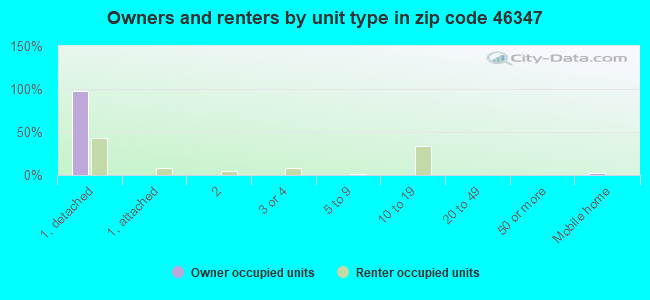
Houses and condos: 1,878 Renter-occupied apartments: 232
% of renters here:
13%
State:
29%
March 2022 cost of living index in zip code 46347: 94.0 (less than average, U.S. average is 100)
Land area: 71.6 sq. mi. Water area: 0.0 sq. mi.
Population density: 68 people per square mile
(very low).
OSM Map
General Map
Google Map
MSN Map
OSM Map
General Map
Google Map
MSN Map
OSM Map
General Map
Google Map
MSN Map
OSM Map
General Map
Google Map
MSN Map
Please wait while loading the map...
Real estate property taxes paid for housing units in 2022:
This zip code:
0.8% ($1,979)
Indiana:
0.7% ($1,467)
Median real estate property taxes paid for housing units with mortgages in 2022: $1,865 (0.8%) Median real estate property taxes paid for housing units with no mortgage in 2022: $2,350 (0.8%)
Business Search- 14 Million verified businesses
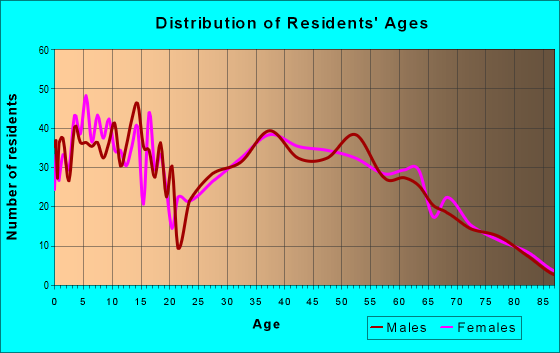
Males: 2,524
(51.6%)
Females: 2,363
(48.4%)
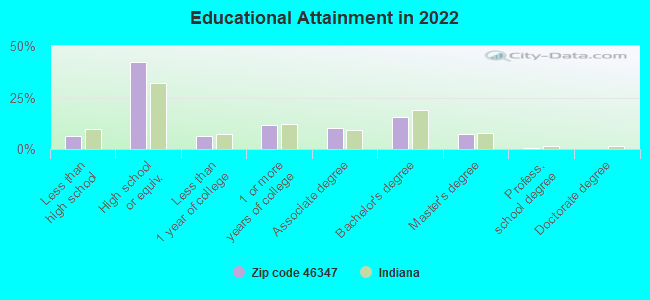
For population 25 years and over in 46347:
High school or higher: 93.3%
Bachelor's degree or higher: 23.4%
Graduate or professional degree: 8.0%
Unemployed: 2.7%
Mean travel time to work (commute): 31.3 minutes
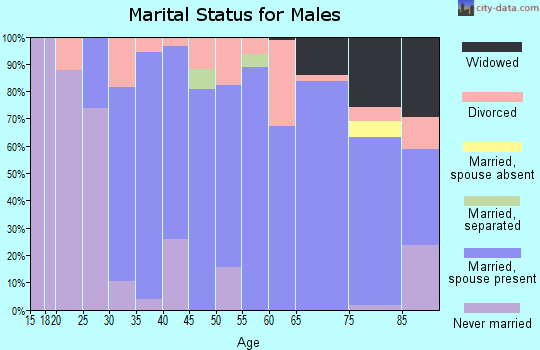
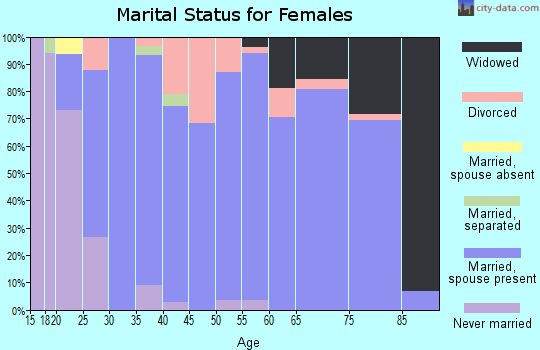
For population 15 years and over in 46347:
Never married: 26.4%
Now married: 57.8%
Separated: 0.5%
Widowed: 5.9%
Divorced: 9.5%
Zip code 46347 compared to state average:
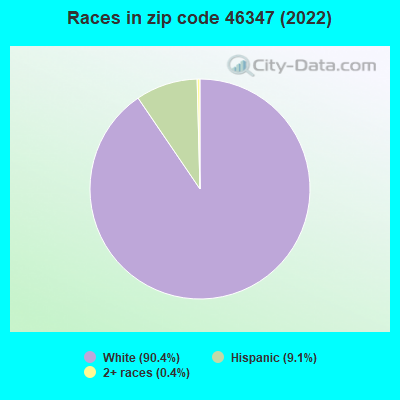
Black race population percentage significantly below state average.
Foreign-born population percentage significantly below state average.
Renting percentage significantly below state average.
Length of stay since moving in significantly above state average.
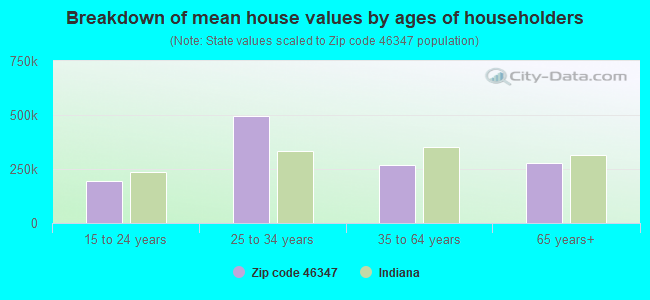
Estimated median house/condo value in 2022: $258,033
46347:
$258,033
Indiana:
$208,700
Median resident age:
This zip code:
41.5 years
Indiana median age:
38.2 years
Average household size:
This zip code:
2.7 people
Indiana:
2.4 people
Averages for the 2020 tax year for zip code 46347, filed in 2021:
Average Adjusted Gross Income (AGI) in 2020: $68,198 (Individual Income Tax Returns)
Here:
$68,198
State:
$64,978
Salary/wage: $60,989 (reported on 81.5% of returns)
Here:
$60,989
State:
$55,245
(% of AGI for various income ranges: 1059.6% for AGIs below $25k, 3462.7% for AGIs $25k-50k, 6279.6% for AGIs $50k-75k, 9011.7% for AGIs $75k-100k, 14923.6% for AGIs $100k-200k)
Taxable interest for individuals: $847 (reported on 30.2% of returns)
This zip code:
$847
Indiana:
$1,351
(% of AGI for various income ranges: 13.8% for AGIs below $25k, 18.5% for AGIs $25k-50k, 16.2% for AGIs $50k-75k, 44.3% for AGIs $75k-100k, 56.1% for AGIs $100k-200k)
Ordinary dividends: $3,686 (reported on 19.0% of returns)
Here:
$3,686
State:
$5,827
(% of AGI for various income ranges: 31.0% for AGIs below $25k, 47.3% for AGIs $25k-50k, 69.2% for AGIs $50k-75k, 118.7% for AGIs $75k-100k, 120.6% for AGIs $100k-200k)
Net capital gain/loss in AGI: +$8,602 (reported on 17.7% of returns)
Here:
+$8,602
State:
+$17,730
(% of AGI for various income ranges: 3.5% for AGIs below $25k, 17.3% for AGIs $25k-50k, 31.5% for AGIs $50k-75k, 108.3% for AGIs $75k-100k, 378.9% for AGIs $100k-200k)
Profit/loss from business: +$10,930 (reported on 11.6% of returns)
Here:
+$10,930
State:
+$12,144
(% of AGI for various income ranges: 103.5% for AGIs below $25k, 104.8% for AGIs $25k-50k, 205.8% for AGIs $50k-75k, 270.9% for AGIs $75k-100k, 263.9% for AGIs $100k-200k)
Taxable individual retirement arrangement distribution: $16,074 (reported on 11.6% of returns)
46347:
$16,074
Indiana:
$18,302
(% of AGI for various income ranges: 76.9% for AGIs below $25k, 195.8% for AGIs $25k-50k, 196.5% for AGIs $50k-75k, 407.4% for AGIs $75k-100k, 521.4% for AGIs $100k-200k)
Total itemized deductions: $28,878 (reported on 3.9% of returns)
Here:
$28,878
State:
$35,601
(% of AGI for various income ranges: 128.3% for AGIs below $25k, 299.1% for AGIs $75k-100k, 359.7% for AGIs $100k-200k)
Charity contributions: $9,100 (reported on 2.6% of returns)
Here:
$9,100
State:
$15,596
(% of AGI for various income ranges: 50.3% for AGIs $25k-50k, 105.6% for AGIs $100k-200k)
Taxes paid: $6,333 (reported on 3.9% of returns)
46347:
$6,333
State:
$7,542
(% of AGI for various income ranges: 16.5% for AGIs below $25k, 51.3% for AGIs $75k-100k, 103.6% for AGIs $100k-200k)
Earned income credit: $1,985 (reported on 8.6% of returns)
Here:
$1,985
State:
$2,298
(% of AGI for various income ranges: 50.6% for AGIs below $25k, 46.7% for AGIs $25k-50k)
Percentage of individuals using paid preparers for their 2020 taxes: 94.8%
Here:
95%
State:
94%
(% for various income ranges: 92.4% for AGIs below $25k, 95.3% for AGIs $25k-50k, 94.3% for AGIs $50k-75k, 96.9% for AGIs $75k-100k, 96.1% for AGIs $100k-200k, 100.0% for AGIs over 200k)
Averages for the 2012 tax year for zip code 46347, filed in 2013:
Average Adjusted Gross Income (AGI) in 2012: $58,036 (Individual Income Tax Returns)
Here:
$58,036
State:
$52,932
Salary/wage: $53,039 (reported on 83.3% of returns)
Here:
$53,039
State:
$45,173
(% of AGI for various income ranges: 70.1% for AGIs below $25k, 74.1% for AGIs $25k-50k, 73.5% for AGIs $50k-75k, 82.0% for AGIs $75k-100k, 84.7% for AGIs $100k-200k, 38.5% for AGIs over 200k)
Taxable interest for individuals: $1,065 (reported on 34.8% of returns)
This zip code:
$1,065
Indiana:
$1,311
(% of AGI for various income ranges: 1.3% for AGIs below $25k, 0.9% for AGIs $25k-50k, 0.6% for AGIs $50k-75k, 0.6% for AGIs $75k-100k, 0.3% for AGIs $100k-200k, 1.2% for AGIs over 200k)
Ordinary dividends: $2,240 (reported on 19.0% of returns)
Here:
$2,240
State:
$4,690
(% of AGI for various income ranges: 2.2% for AGIs below $25k, 0.9% for AGIs $25k-50k, 0.9% for AGIs $50k-75k, 0.7% for AGIs $75k-100k, 0.6% for AGIs $100k-200k)
Net capital gain/loss in AGI: +$3,300 (reported on 13.6% of returns)
Here:
+$3,300
State:
+$10,406
(% of AGI for various income ranges: 0.3% for AGIs $50k-75k, 0.6% for AGIs $75k-100k, 1.8% for AGIs $100k-200k)
Profit/loss from business: +$8,342 (reported on 11.8% of returns)
Here:
+$8,342
State:
+$11,105
(% of AGI for various income ranges: 4.2% for AGIs below $25k, 3.1% for AGIs $25k-50k, 1.6% for AGIs $50k-75k, 1.2% for AGIs $75k-100k, 1.6% for AGIs $100k-200k)
Taxable individual retirement arrangement distribution: $12,948 (reported on 12.2% of returns)
46347:
$12,948
Indiana:
$13,841
(% of AGI for various income ranges: 3.9% for AGIs below $25k, 2.7% for AGIs $25k-50k, 3.5% for AGIs $50k-75k, 2.4% for AGIs $75k-100k, 3.1% for AGIs $100k-200k)
Total itemized deductions: $17,934 (19% of AGI, reported on 34.4% of returns)
Here:
$17,934
State:
$20,913
Here:
19.0% of AGI
State:
18.2% of AGI
(% of AGI for various income ranges: 8.1% for AGIs below $25k, 9.4% for AGIs $25k-50k, 10.1% for AGIs $50k-75k, 11.2% for AGIs $75k-100k, 11.5% for AGIs $100k-200k, 10.1% for AGIs over 200k)
Charity contributions: $3,380 (reported on 25.3% of returns)
Here:
$3,380
State:
$4,697
(% of AGI for various income ranges: 0.4% for AGIs below $25k, 1.0% for AGIs $25k-50k, 1.2% for AGIs $50k-75k, 1.6% for AGIs $75k-100k, 1.7% for AGIs $100k-200k, 2.2% for AGIs over 200k)
Taxes paid: $5,800 (reported on 34.4% of returns)
46347:
$5,800
State:
$7,456
(% of AGI for various income ranges: 1.3% for AGIs below $25k, 2.0% for AGIs $25k-50k, 2.6% for AGIs $50k-75k, 3.5% for AGIs $75k-100k, 4.3% for AGIs $100k-200k, 4.9% for AGIs over 200k)
Earned income credit: $1,931 (reported on 11.8% of returns)
Here:
$1,931
State:
$2,265
(% of AGI for various income ranges: 4.4% for AGIs below $25k, 1.0% for AGIs $25k-50k)
Percentage of individuals using paid preparers for their 2012 taxes: 55.2%
Here:
55%
State:
53%
(% for various income ranges: 48.6% for AGIs below $25k, 52.4% for AGIs $25k-50k, 57.1% for AGIs $50k-75k, 61.8% for AGIs $75k-100k, 61.8% for AGIs $100k-200k, 75.0% for AGIs over 200k)
Averages for the 2004 tax year for zip code 46347, filed in 2005:
Average Adjusted Gross Income (AGI) in 2004: $47,184 (Individual Income Tax Returns)
Here:
$47,184
State:
$44,790
Salary/wage: $44,470 (reported on 85.5% of returns)
Here:
$44,470
State:
$39,615
(% of AGI for various income ranges: 118.4% for AGIs below $10k, 71.1% for AGIs $10k-25k, 80.2% for AGIs $25k-50k, 84.0% for AGIs $50k-75k, 87.2% for AGIs $75k-100k, 70.4% for AGIs over 100k)
Taxable interest for individuals: $1,024 (reported on 52.2% of returns)
This zip code:
$1,024
Indiana:
$1,535
(% of AGI for various income ranges: 6.8% for AGIs below $10k, 2.1% for AGIs $10k-25k, 1.4% for AGIs $25k-50k, 0.7% for AGIs $50k-75k, 0.7% for AGIs $75k-100k, 1.3% for AGIs over 100k)
Taxable dividends: $1,076 (reported on 22.6% of returns)
Here:
$1,076
State:
$2,998
(% of AGI for various income ranges: 2.3% for AGIs below $10k, 1.0% for AGIs $10k-25k, 0.6% for AGIs $25k-50k, 0.4% for AGIs $50k-75k, 0.4% for AGIs $75k-100k, 0.5% for AGIs over 100k)
Net capital gain/loss: +$3,851 (reported on 17.3% of returns)
Here:
+$3,851
State:
+$8,619
(% of AGI for various income ranges: 0.3% for AGIs below $10k, -0.3% for AGIs $10k-25k, 0.3% for AGIs $25k-50k, 0.8% for AGIs $50k-75k, 1.2% for AGIs $75k-100k, 3.8% for AGIs over 100k)
Profit/loss from business: +$7,935 (reported on 14.4% of returns)
Here:
+$7,935
State:
+$10,071
(% of AGI for various income ranges: -3.5% for AGIs below $10k, 4.1% for AGIs $10k-25k, 3.7% for AGIs $25k-50k, 1.9% for AGIs $50k-75k, 1.3% for AGIs $75k-100k, 3.0% for AGIs over 100k)
Profit/loss from farming: +$4,478 (reported on 3.5% of returns)
Here:
+$4,478
State:
-$2,212
(% of AGI for various income ranges: -2.1% for AGIs below $10k, 0.2% for AGIs $25k-50k, 1.1% for AGIs $50k-75k, 0.0% for AGIs $75k-100k)
IRA payment deduction: $2,857 (reported on 2.5% of returns)
46347:
$2,857
Indiana:
$2,840
Total itemized deductions: $15,209 (21% of AGI, reported on 39.0% of returns)
Here:
$15,209
State:
$17,065
Here:
21.2% of AGI
State:
19.5% of AGI
(% of AGI for various income ranges: 14.3% for AGIs below $10k, 10.6% for AGIs $10k-25k, 11.8% for AGIs $25k-50k, 13.2% for AGIs $50k-75k, 13.5% for AGIs $75k-100k, 11.9% for AGIs over 100k)
Charity contributions deductions: $2,709 (4% of AGI, reported on 33.9% of returns)
Here:
$2,709
State:
$3,550
Here:
3.7% of AGI
State:
3.8% of AGI
(% of AGI for various income ranges: 0.9% for AGIs below $10k, 1.5% for AGIs $10k-25k, 1.5% for AGIs $25k-50k, 1.7% for AGIs $50k-75k, 2.0% for AGIs $75k-100k, 2.8% for AGIs over 100k)
Total tax: $5,736 (reported on 79.7% of returns)
46347:
$5,736
State:
$6,914
(% of AGI for various income ranges: 2.6% for AGIs below $10k, 4.1% for AGIs $10k-25k, 6.7% for AGIs $25k-50k, 8.1% for AGIs $50k-75k, 10.2% for AGIs $75k-100k, 15.7% for AGIs over 100k)
Earned income credit: $1,610 (reported on 8.2% of returns)
Here:
$1,610
State:
$1,685
Percentage of individuals using paid preparers for their 2004 taxes: 61.7%
Here:
62%
State:
59%
(% for various income ranges: 52.7% for AGIs below $10k, 60.8% for AGIs $10k-25k, 62.2% for AGIs $25k-50k, 69.1% for AGIs $50k-75k, 58.6% for AGIs $75k-100k, 65.7% for AGIs over 100k)
Likely homosexual households (counted as self-reported same-sex unmarried-partner households)
Lesbian couples: 0.0% of all households
Gay men: 0.1% of all households
Household received Food Stamps/SNAP in the past 12 months: 26 Household did not receive Food Stamps/SNAP in the past 12 months: 1,788
Women who had a birth in the past 12 months: 24 (21 now married, 3 unmarried) Women who did not have a birth in the past 12 months: 997 (549 now married, 450 unmarried)
Housing units in zip code 46347 with a mortgage: 1,011 (66 second mortgage, 58 both second mortgage and home equity loan) Houses without a mortgage: 8
Median monthly owner costs for units with a mortgage: $1,400 Median monthly owner costs for units without a mortgage: $606
Residents with income below the poverty level in 2022:
This zip code:
2.9%
Whole state:
12.6%
Residents with income below 50% of the poverty level in 2022:
This zip code:
0.7%
Whole state:
6.3%
Median number of rooms in houses and condos:
Here:
6.5
State:
6.6
Median number of rooms in apartments:
Here:
3.6
State:
4.3
Notable locations in this zip code not listed on our city pages
Size of family households: 583 2-persons, 212 3-persons, 234 4-persons, 157 5-persons, 57 6-persons, 29 7-or-more-persons
Size of nonfamily households: 449 1-person, 61 2-persons, 31 3-persons
945 married couples with children.
137 single-parent households (52 men, 85 women).
98.9% of residents of 46347 zip code speak English at home.
0.3% of residents speak other Indo-European language at home (73% very well, 27% well).
Foreign born population: 18 (0.4%) (100.0% of them are naturalized citizens)
This zip code:
0.4%
Whole state:
6.1%
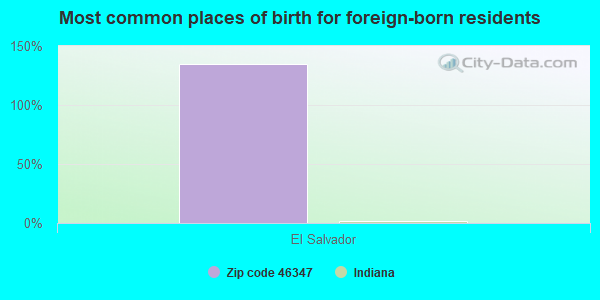
135%El Salvador
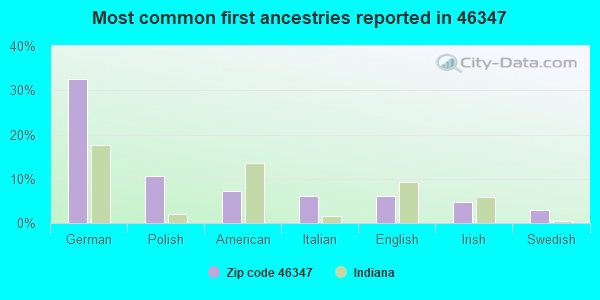
32%German
11%Polish
7%American
6%Italian
6%English
5%Irish
3%Swedish
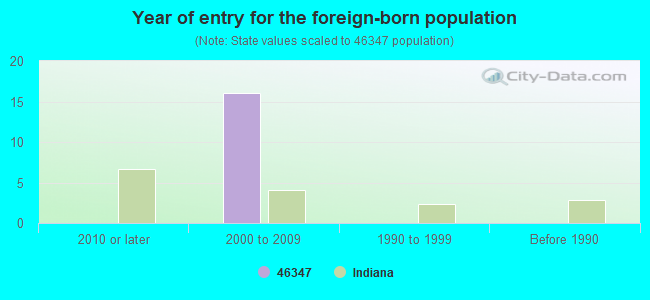
Year of entry for the foreign-born population
02010 or later
162000 to 2009
01990 to 1999
0Before 1990
Facilities with environmental interests located in this zip code:
MERIT STEEL COMPANY INCORPORATED (701 W INDIANA in KOUTS, IN)
STATE MASTER (Indiana facility tracking) - UST-11547, UNDERGROUND STORAGE TANK PROGRAM, CRTK-6049, EPCRA, LUST-198907027, LEAKING STORAGE TANK, SPILL-199011020, RELEASE ASSESSMENT National Pollutant Discharge Elimination System NON-MAJOR (Tracking pollutant discharge elimination systems) - permit Conditionally Exempt Small Quantity Generators, less than 100 kg/month of hazardous waste (Resource Conservation and Recovery Act (tracking hazardous waste)) - notification TSD (Resource Conservation and Recovery Act (tracking hazardous waste)) TRI REPORTER (Tracking of toxic chemicals releasing facilities) Business SIC classification: STEEL WIREDRAWING AND STEEL NAILS AND SPIKES Organizations: JAMEY FORD PLT MGR (CONTACT/OPERATOR)
, LEGGETT & PLATT (CONTACT/OWNER)
, LEGETT AND PLATT (CONTACT/OWNER)
MARATHON SERVICE STATION 1291 (101 E INDIANA ST in KOUTS, IN)
STATE MASTER (Indiana facility tracking) - SPILL-199001524, RELEASE ASSESSMENT, UST-4592, UNDERGROUND STORAGE TANK PROGRAM, UST-5358, CRTK-6665, EPCRA, LUST-199001524, LEAKING STORAGE TANK (Resource Conservation and Recovery Act (tracking hazardous waste)) Organizations: MARATHON OIL CO (CONTACT/OWNER)
Alternative names: MARATHON 1291 FORMER, MARATHON OIL CO UNIT 1291
AT AND T LONG LINES KOUTS IND (1 MILE S KOUTS in KOUTS, IN)
STATE MASTER (Indiana facility tracking) (Resource Conservation and Recovery Act (tracking hazardous waste))
CARGILL (BROWN ST BOX 430 in KOUTS, IN)
STATE MASTER (Indiana facility tracking) Conditionally Exempt Small Quantity Generators, less than 100 kg/month of hazardous waste (Resource Conservation and Recovery Act (tracking hazardous waste)) - notification Organizations: CARGILL INC (CONTACT/OWNER)
Housing units lacking complete plumbing facilities: 1.2% Housing units lacking complete kitchen facilities: 1.8%
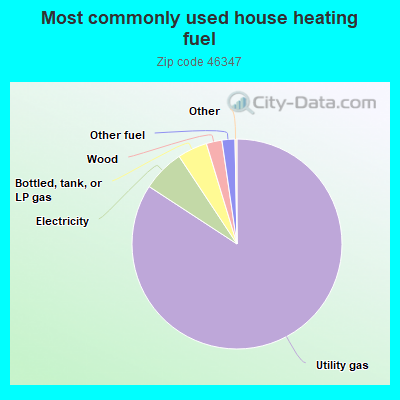
84.3%Utility gas
6.5%Electricity
4.6%Bottled, tank, or LP gas
2.4%Wood
2.0%Other fuel
Population in 1990: 3,244. Population change in the 1990s: +737 (+22.7%).
Place of birth for U.S.-born residents:
This state: 3,847
Northeast: 108
Midwest: 502
South: 263
West: 119
62% of the 46347 zip code residents lived in the same house 5 years ago. Out of people who lived in different houses, 62% lived in this county. Out of people who lived in different counties, 50% lived in Indiana.
98% of the 46347 zip code residents lived in the same house 1 year ago. Out of people who lived in different houses, 104% moved from this county. Out of people who lived in different houses, 15% moved from different county within same state. Out of people who lived in different houses, 4% moved from different state.
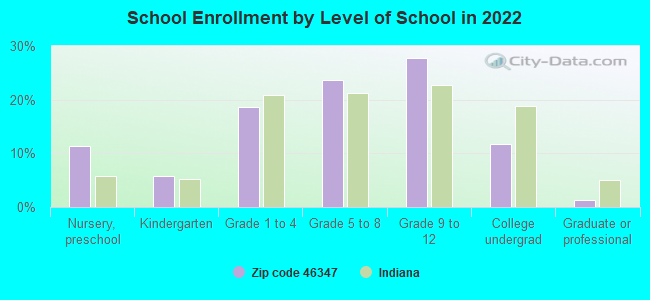
Private vs. public school enrollment:
Students in private schools in grades 1 to 8 (elementary and middle school): 19
Here:
3.8%
Indiana:
14.9%
Students in private schools in grades 9 to 12 (high school): 21
Here:
6.3%
Indiana:
11.4%
Students in private undergraduate colleges: 17
Here:
12.3%
Indiana:
22.3%
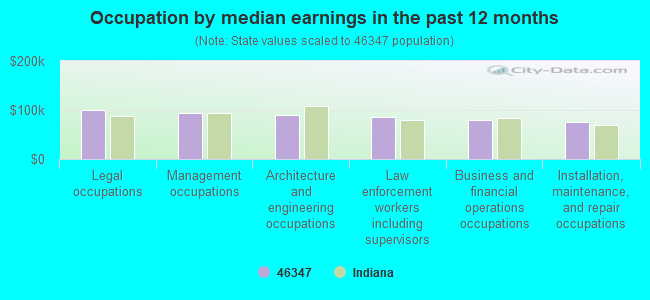
Occupation by median earnings in the past 12 months ($)
99,794Legal occupations
93,079Management occupations
89,466Architecture and engineering occupations
85,182Law enforcement workers including supervisors
79,925Business and financial operations occupations
76,298Installation, maintenance, and repair occupations
Top industries in this zip code by the number of employees in 2005:
Health Care and Social Assistance: Psychiatric and Substance Abuse Hospitals (100-249 employees: 1 establishment)
Accommodation and Food Services: Full-Service Restaurants (20-49: 1, 10-19: 2)
Other Services (except Public Administration): Religious Organizations (20-49: 1, 5-9: 2, 1-4: 2)
Construction: New Single-Family Housing Construction (except Operative Builders) (10-19: 1, 1-4: 9)
Construction: Site Preparation Contractors (10-19: 1, 5-9: 1, 1-4: 1)
Other Services (except Public Administration): Other Similar Organizations (except Business, Professional, Labor, and Political Organizations) (10-19: 1)
People in group quarters in 2000:
48 people in homes for the mentally ill
9 people in other noninstitutional group quarters
5 people in homes for the mentally retarded
Fatal accident statistics in 2011:
Fatal accident count: 2
Vehicles involved in fatal accidents: 4
Fatal accidents caused by drunken drivers: 1
Fatalities: 2
Persons involved in fatal accidents: 5
Pedestrians involved in fatal accidents: 0
Fatal accident statistics in 2010:
Fatal accident count: 1
Vehicles involved in fatal accidents: 2
Fatal accidents caused by drunken drivers: 0
Fatalities: 1
Persons involved in fatal accidents: 2
Pedestrians involved in fatal accidents: 0
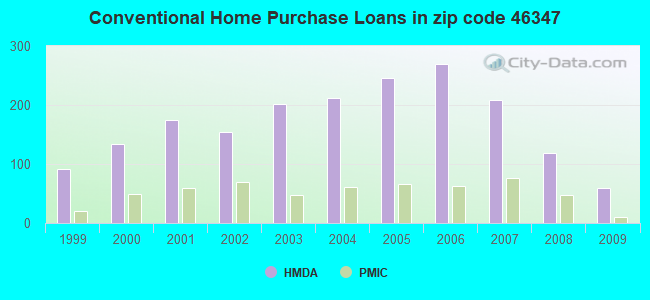
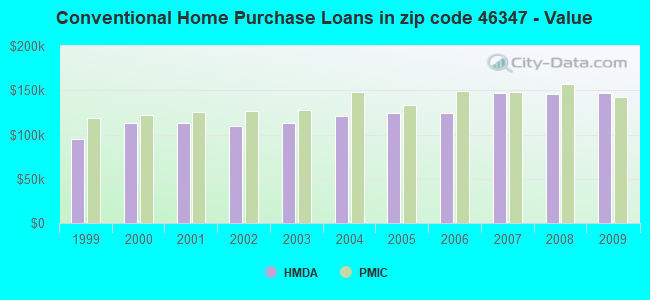
Home Mortgage Disclosure Act Aggregated Statistics For Year 2009 (Based on 2 full and 4 partial tracts)
A) FHA, FSA/RHS & VA Home Purchase Loans
B) Conventional Home Purchase Loans
C) Refinancings
D) Home Improvement Loans
F) Non-occupant Loans on < 5 Family Dwellings (A B C & D)
G) Loans On Manufactured Home Dwelling (A B C & D)
Number
Average Value
Number
Average Value
Number
Average Value
Number
Average Value
Number
Average Value
Number
Average Value
LOANS ORIGINATED
65
$155,476
59
$147,029
420
$155,272
28
$57,790
11
$92,606
8
$107,624
APPLICATIONS APPROVED, NOT ACCEPTED
1
$188,380
4
$194,342
48
$169,536
1
$126,330
0
$0
0
$0
APPLICATIONS DENIED
11
$187,511
12
$139,488
97
$160,943
15
$21,667
2
$47,275
2
$125,920
APPLICATIONS WITHDRAWN
5
$119,114
1
$249,370
44
$157,679
2
$52,240
0
$0
2
$134,440
FILES CLOSED FOR INCOMPLETENESS
1
$148,810
4
$87,482
19
$148,399
5
$88,908
2
$68,375
0
$0
Aggregated Statistics For Year 2008 (Based on 2 full and 4 partial tracts)
A) FHA, FSA/RHS & VA Home Purchase Loans
B) Conventional Home Purchase Loans
C) Refinancings
D) Home Improvement Loans
F) Non-occupant Loans on < 5 Family Dwellings (A B C & D)
G) Loans On Manufactured Home Dwelling (A B C & D)
Number
Average Value
Number
Average Value
Number
Average Value
Number
Average Value
Number
Average Value
Number
Average Value
LOANS ORIGINATED
52
$150,435
118
$145,387
230
$147,899
31
$76,555
12
$104,580
10
$110,081
APPLICATIONS APPROVED, NOT ACCEPTED
6
$158,773
15
$145,589
26
$134,714
5
$44,310
4
$117,785
2
$93,865
APPLICATIONS DENIED
16
$190,064
20
$160,892
101
$142,951
24
$83,574
5
$85,822
6
$95,947
APPLICATIONS WITHDRAWN
1
$98,280
4
$159,388
37
$156,210
3
$94,610
0
$0
0
$0
FILES CLOSED FOR INCOMPLETENESS
2
$195,725
3
$133,157
12
$128,271
0
$0
0
$0
0
$0
Aggregated Statistics For Year 2007 (Based on 2 full and 4 partial tracts)
A) FHA, FSA/RHS & VA Home Purchase Loans
B) Conventional Home Purchase Loans
C) Refinancings
D) Home Improvement Loans
E) Loans on Dwellings For 5+ Families
F) Non-occupant Loans on < 5 Family Dwellings (A B C & D)
G) Loans On Manufactured Home Dwelling (A B C & D)
Number
Average Value
Number
Average Value
Number
Average Value
Number
Average Value
Number
Average Value
Number
Average Value
Number
Average Value
LOANS ORIGINATED
30
$142,520
209
$147,112
211
$121,834
42
$56,613
2
$584,675
24
$114,301
11
$114,115
APPLICATIONS APPROVED, NOT ACCEPTED
0
$0
8
$134,138
26
$113,651
10
$55,926
0
$0
3
$52,587
0
$0
APPLICATIONS DENIED
5
$162,992
27
$146,363
132
$140,357
18
$36,809
0
$0
3
$102,783
4
$106,995
APPLICATIONS WITHDRAWN
0
$0
13
$170,641
50
$139,626
1
$65,680
0
$0
0
$0
0
$0
FILES CLOSED FOR INCOMPLETENESS
0
$0
3
$125,037
18
$131,252
2
$125,830
0
$0
1
$132,860
0
$0
Aggregated Statistics For Year 2006 (Based on 2 full and 4 partial tracts)
A) FHA, FSA/RHS & VA Home Purchase Loans
B) Conventional Home Purchase Loans
C) Refinancings
D) Home Improvement Loans
F) Non-occupant Loans on < 5 Family Dwellings (A B C & D)
G) Loans On Manufactured Home Dwelling (A B C & D)
Number
Average Value
Number
Average Value
Number
Average Value
Number
Average Value
Number
Average Value
Number
Average Value
LOANS ORIGINATED
22
$145,467
269
$124,532
247
$121,050
39
$50,393
15
$117,495
10
$79,483
APPLICATIONS APPROVED, NOT ACCEPTED
1
$54,370
24
$91,103
43
$127,377
3
$38,703
1
$130,790
0
$0
APPLICATIONS DENIED
7
$159,630
44
$116,560
118
$126,975
36
$63,097
3
$144,870
7
$137,343
APPLICATIONS WITHDRAWN
1
$142,260
15
$84,324
77
$127,848
1
$44,510
3
$78,213
0
$0
FILES CLOSED FOR INCOMPLETENESS
0
$0
7
$129,686
38
$139,858
0
$0
1
$151,740
0
$0
Aggregated Statistics For Year 2005 (Based on 2 full and 4 partial tracts)
A) FHA, FSA/RHS & VA Home Purchase Loans
B) Conventional Home Purchase Loans
C) Refinancings
D) Home Improvement Loans
F) Non-occupant Loans on < 5 Family Dwellings (A B C & D)
G) Loans On Manufactured Home Dwelling (A B C & D)
Number
Average Value
Number
Average Value
Number
Average Value
Number
Average Value
Number
Average Value
Number
Average Value
LOANS ORIGINATED
40
$144,726
245
$124,764
276
$108,986
39
$31,432
18
$108,914
4
$76,042
APPLICATIONS APPROVED, NOT ACCEPTED
0
$0
35
$107,133
54
$119,669
7
$39,757
3
$72,563
1
$45,040
APPLICATIONS DENIED
1
$81,730
39
$92,729
163
$130,495
27
$39,834
3
$92,287
5
$48,414
APPLICATIONS WITHDRAWN
1
$99,370
31
$99,613
100
$131,399
14
$121,117
5
$115,206
4
$110,788
FILES CLOSED FOR INCOMPLETENESS
2
$131,975
3
$275,040
30
$138,647
2
$34,075
0
$0
0
$0
Aggregated Statistics For Year 2004 (Based on 2 full and 4 partial tracts)
A) FHA, FSA/RHS & VA Home Purchase Loans
B) Conventional Home Purchase Loans
C) Refinancings
D) Home Improvement Loans
F) Non-occupant Loans on < 5 Family Dwellings (A B C & D)
G) Loans On Manufactured Home Dwelling (A B C & D)
Number
Average Value
Number
Average Value
Number
Average Value
Number
Average Value
Number
Average Value
Number
Average Value
LOANS ORIGINATED
39
$122,201
212
$120,611
255
$104,117
57
$35,421
21
$84,484
7
$94,873
APPLICATIONS APPROVED, NOT ACCEPTED
0
$0
26
$137,683
37
$102,198
11
$20,601
10
$56,894
1
$13,470
APPLICATIONS DENIED
2
$129,540
29
$94,821
145
$119,605
17
$25,922
6
$88,785
9
$66,159
APPLICATIONS WITHDRAWN
1
$51,780
18
$135,623
78
$121,774
4
$50,932
1
$107,450
4
$93,458
FILES CLOSED FOR INCOMPLETENESS
2
$103,980
10
$109,438
35
$126,669
5
$41,096
0
$0
0
$0
Aggregated Statistics For Year 2003 (Based on 2 full and 4 partial tracts)
A) FHA, FSA/RHS & VA Home Purchase Loans
B) Conventional Home Purchase Loans
C) Refinancings
D) Home Improvement Loans
F) Non-occupant Loans on < 5 Family Dwellings (A B C & D)
Number
Average Value
Number
Average Value
Number
Average Value
Number
Average Value
Number
Average Value
LOANS ORIGINATED
34
$114,197
202
$113,103
648
$105,200
39
$30,210
24
$73,475
APPLICATIONS APPROVED, NOT ACCEPTED
2
$91,980
17
$105,171
61
$104,988
5
$19,450
3
$63,897
APPLICATIONS DENIED
1
$66,130
15
$88,770
185
$100,239
9
$15,424
3
$68,467
APPLICATIONS WITHDRAWN
2
$101,070
13
$102,469
135
$114,248
5
$19,240
1
$64,280
FILES CLOSED FOR INCOMPLETENESS
2
$112,190
1
$123,490
19
$103,858
0
$0
0
$0
Aggregated Statistics For Year 2002 (Based on 2 full and 4 partial tracts)
A) FHA, FSA/RHS & VA Home Purchase Loans
B) Conventional Home Purchase Loans
C) Refinancings
D) Home Improvement Loans
E) Loans on Dwellings For 5+ Families
F) Non-occupant Loans on < 5 Family Dwellings (A B C & D)
Number
Average Value
Number
Average Value
Number
Average Value
Number
Average Value
Number
Average Value
Number
Average Value
LOANS ORIGINATED
41
$112,105
155
$109,052
443
$104,390
64
$22,860
2
$299,940
22
$89,000
APPLICATIONS APPROVED, NOT ACCEPTED
0
$0
8
$129,572
57
$87,804
1
$16,390
0
$0
2
$69,235
APPLICATIONS DENIED
1
$67,480
41
$66,037
96
$95,756
16
$19,862
0
$0
13
$62,747
APPLICATIONS WITHDRAWN
0
$0
10
$93,159
62
$103,686
1
$12,980
0
$0
4
$100,088
FILES CLOSED FOR INCOMPLETENESS
0
$0
3
$106,890
23
$108,977
0
$0
0
$0
0
$0
Aggregated Statistics For Year 2001 (Based on 2 full and 4 partial tracts)
A) FHA, FSA/RHS & VA Home Purchase Loans
B) Conventional Home Purchase Loans
C) Refinancings
D) Home Improvement Loans
F) Non-occupant Loans on < 5 Family Dwellings (A B C & D)
Number
Average Value
Number
Average Value
Number
Average Value
Number
Average Value
Number
Average Value
LOANS ORIGINATED
38
$105,687
175
$113,264
408
$98,946
43
$19,108
25
$83,079
APPLICATIONS APPROVED, NOT ACCEPTED
0
$0
6
$127,163
38
$85,561
2
$25,890
0
$0
APPLICATIONS DENIED
0
$0
18
$72,067
124
$97,229
10
$15,141
1
$52,800
APPLICATIONS WITHDRAWN
0
$0
8
$90,120
71
$104,460
3
$23,363
5
$78,800
FILES CLOSED FOR INCOMPLETENESS
0
$0
3
$89,340
10
$117,478
0
$0
0
$0
Aggregated Statistics For Year 2000 (Based on 2 full and 4 partial tracts)
A) FHA, FSA/RHS & VA Home Purchase Loans
B) Conventional Home Purchase Loans
C) Refinancings
D) Home Improvement Loans
E) Loans on Dwellings For 5+ Families
F) Non-occupant Loans on < 5 Family Dwellings (A B C & D)
Number
Average Value
Number
Average Value
Number
Average Value
Number
Average Value
Number
Average Value
Number
Average Value
LOANS ORIGINATED
27
$97,641
134
$112,755
132
$78,841
63
$17,728
2
$339,930
12
$90,266
APPLICATIONS APPROVED, NOT ACCEPTED
0
$0
15
$136,497
25
$72,523
16
$13,158
0
$0
3
$67,260
APPLICATIONS DENIED
5
$130,564
10
$58,772
67
$81,493
30
$20,599
0
$0
1
$52,060
APPLICATIONS WITHDRAWN
2
$98,750
13
$105,062
38
$80,400
5
$107,102
0
$0
1
$91,900
FILES CLOSED FOR INCOMPLETENESS
0
$0
0
$0
4
$95,195
2
$54,040
0
$0
0
$0
Aggregated Statistics For Year 1999 (Based on 1 full and 2 partial tracts)
A) FHA, FSA/RHS & VA Home Purchase Loans
B) Conventional Home Purchase Loans
C) Refinancings
D) Home Improvement Loans
F) Non-occupant Loans on < 5 Family Dwellings (A B C & D)
2002 - 2018 National Fire Incident Reporting System (NFIRS) incidents
According to the data from the years 2002 - 2018 the average number of fire incidents per year is 19. The highest number of fire incidents - 42 took place in 2015, and the least - 6 in 2014. The data has a growing trend.
When looking into fire subcategories, the most reports belonged to: Structure Fires (54.9%), and Outside Fires (29.0%).
Fire incident types reported to NFIRS in Zip Code 46347


+$4,478
-$2,212
(% of AGI for various income ranges: -2.1% for AGIs below $10k, 0.2% for AGIs $25k-50k, 1.1% for AGIs $50k-75k, 0.0% for AGIs $75k-100k) Nearest zip codes: 46392, 46348, 46374, 46383, 46390, 46385.


 According to the data from the years 2002 - 2018 the average number of fire incidents per year is 19. The highest number of fire incidents - 42 took place in 2015, and the least - 6 in 2014. The data has a growing trend.
 When looking into fire subcategories, the most reports belonged to: Structure Fires (54.9%), and Outside Fires (29.0%).