Estimated zip code population in 2022: 5,958 Zip code population in 2010: 5,791 Zip code population in 2000: 6,200
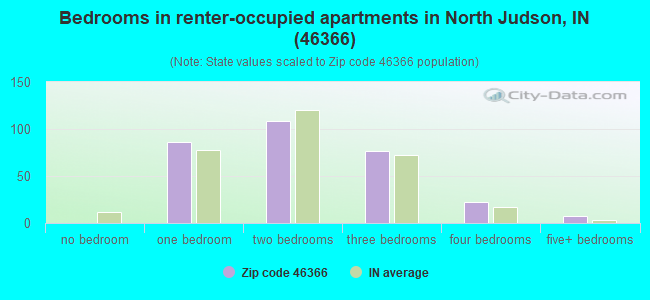
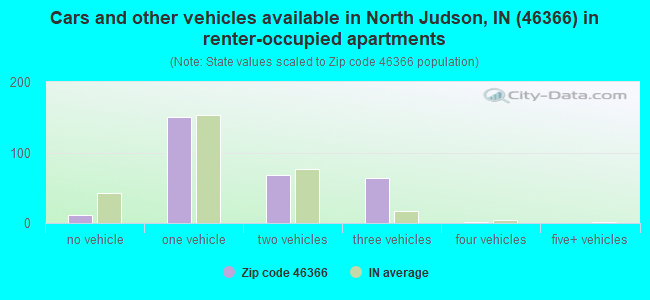
Houses and condos: 2,463 Renter-occupied apartments: 301
% of renters here:
14%
State:
29%
March 2022 cost of living index in zip code 46366: 85.2 (less than average, U.S. average is 100)
Land area: 79.5 sq. mi. Water area: 0.1 sq. mi.
Population density: 75 people per square mile
(very low).
OSM Map
General Map
Google Map
MSN Map
OSM Map
General Map
Google Map
MSN Map
OSM Map
General Map
Google Map
MSN Map
OSM Map
General Map
Google Map
MSN Map
Please wait while loading the map...
Real estate property taxes paid for housing units in 2022:
This zip code:
0.5% ($827)
Indiana:
0.7% ($1,467)
Median real estate property taxes paid for housing units with mortgages in 2022: $1,032 (0.6%) Median real estate property taxes paid for housing units with no mortgage in 2022: $736 (0.5%)
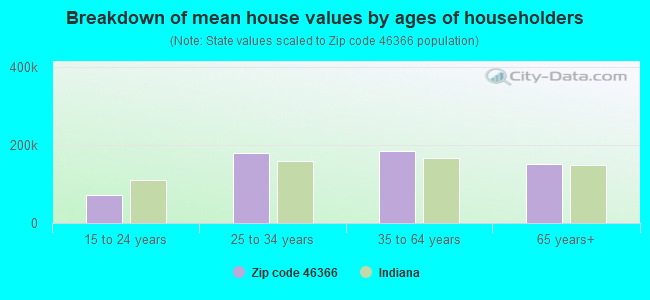
Estimated median house/condo value in 2022: $166,642
46366:
$166,642
Indiana:
$208,700
According to our research of Indiana and other state lists, there was 1 registered sex offender living in 46366 zip code as of April 27, 2024. The ratio of all residents to sex offenders in zip code 46366 is 5,508 to 1. The ratio of registered sex offenders to all residents in this zip code is much lower than the state average.
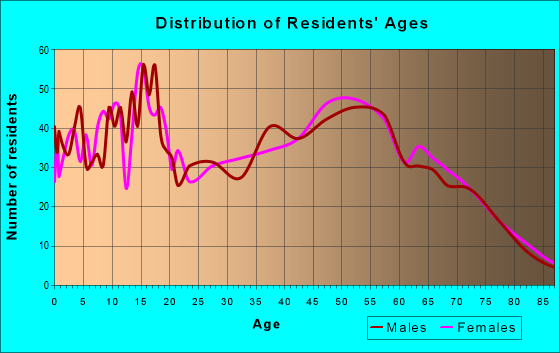
Median resident age:
This zip code:
36.5 years
Indiana median age:
38.2 years
Average household size:
This zip code:
2.8 people
Indiana:
2.4 people
Averages for the 2020 tax year for zip code 46366, filed in 2021:
Average Adjusted Gross Income (AGI) in 2020: $49,137 (Individual Income Tax Returns)
Here:
$49,137
State:
$64,978
Salary/wage: $45,294 (reported on 76.7% of returns)
Here:
$45,294
State:
$55,245
(% of AGI for various income ranges: 983.5% for AGIs below $25k, 3297.0% for AGIs $25k-50k, 6229.3% for AGIs $50k-75k, 9095.3% for AGIs $75k-100k, 14503.9% for AGIs $100k-200k)
Taxable interest for individuals: $723 (reported on 27.9% of returns)
This zip code:
$723
Indiana:
$1,351
(% of AGI for various income ranges: 20.5% for AGIs below $25k, 23.4% for AGIs $25k-50k, 29.7% for AGIs $50k-75k, 33.7% for AGIs $75k-100k, 38.3% for AGIs $100k-200k)
Ordinary dividends: $2,238 (reported on 11.1% of returns)
Here:
$2,238
State:
$5,827
(% of AGI for various income ranges: 17.7% for AGIs below $25k, 15.1% for AGIs $25k-50k, 52.7% for AGIs $50k-75k, 25.3% for AGIs $75k-100k, 137.8% for AGIs $100k-200k)
Net capital gain/loss in AGI: +$5,546 (reported on 9.9% of returns)
Here:
+$5,546
State:
+$17,730
(% of AGI for various income ranges: 8.3% for AGIs below $25k, 14.2% for AGIs $25k-50k, 43.3% for AGIs $50k-75k, 19.5% for AGIs $75k-100k, 636.7% for AGIs $100k-200k)
Profit/loss from business: +$8,687 (reported on 11.5% of returns)
Here:
+$8,687
State:
+$12,144
(% of AGI for various income ranges: 126.2% for AGIs below $25k, 150.0% for AGIs $25k-50k, 112.7% for AGIs $50k-75k, 15.8% for AGIs $75k-100k, 346.1% for AGIs $100k-200k)
Taxable individual retirement arrangement distribution: $12,722 (reported on 10.3% of returns)
46366:
$12,722
Indiana:
$18,302
(% of AGI for various income ranges: 70.5% for AGIs below $25k, 80.4% for AGIs $25k-50k, 207.7% for AGIs $50k-75k, 273.7% for AGIs $75k-100k, 782.2% for AGIs $100k-200k)
Total itemized deductions: $27,000 (reported on 2.3% of returns)
Here:
$27,000
State:
$35,601
(% of AGI for various income ranges: 234.7% for AGIs $50k-75k, 508.9% for AGIs $100k-200k)
Charity contributions: $10,800 (reported on 1.5% of returns)
Here:
$10,800
State:
$15,596
(% of AGI for various income ranges: 240.0% for AGIs $100k-200k)
Taxes paid: $6,550 (reported on 2.3% of returns)
46366:
$6,550
State:
$7,542
(% of AGI for various income ranges: 54.0% for AGIs $50k-75k, 128.3% for AGIs $100k-200k)
Earned income credit: $2,289 (reported on 17.9% of returns)
Here:
$2,289
State:
$2,298
(% of AGI for various income ranges: 106.2% for AGIs below $25k, 72.8% for AGIs $25k-50k)
Percentage of individuals using paid preparers for their 2020 taxes: 94.7%
Here:
95%
State:
94%
(% for various income ranges: 93.9% for AGIs below $25k, 94.0% for AGIs $25k-50k, 97.5% for AGIs $50k-75k, 96.3% for AGIs $75k-100k, 96.3% for AGIs $100k-200k, 66.7% for AGIs over 200k)
Averages for the 2012 tax year for zip code 46366, filed in 2013:
Average Adjusted Gross Income (AGI) in 2012: $43,896 (Individual Income Tax Returns)
Here:
$43,896
State:
$52,932
Salary/wage: $37,722 (reported on 82.5% of returns)
Here:
$37,722
State:
$45,173
(% of AGI for various income ranges: 67.2% for AGIs below $25k, 79.4% for AGIs $25k-50k, 78.6% for AGIs $50k-75k, 81.1% for AGIs $75k-100k, 87.8% for AGIs $100k-200k)
Taxable interest for individuals: $778 (reported on 28.8% of returns)
This zip code:
$778
Indiana:
$1,311
(% of AGI for various income ranges: 1.5% for AGIs below $25k, 0.4% for AGIs $25k-50k, 0.5% for AGIs $50k-75k, 0.3% for AGIs $75k-100k, 0.2% for AGIs $100k-200k, 0.6% for AGIs over 200k)
Ordinary dividends: $2,621 (reported on 11.3% of returns)
Here:
$2,621
State:
$4,690
(% of AGI for various income ranges: 1.1% for AGIs below $25k, 0.7% for AGIs $25k-50k, 0.3% for AGIs $50k-75k, 0.6% for AGIs $75k-100k, 1.2% for AGIs $100k-200k)
Net capital gain/loss in AGI: +$10,300 (reported on 8.2% of returns)
Here:
+$10,300
State:
+$10,406
(% of AGI for various income ranges: 0.3% for AGIs $50k-75k, 0.8% for AGIs $75k-100k, 7.9% for AGIs $100k-200k)
Profit/loss from business: +$6,658 (reported on 10.1% of returns)
Here:
+$6,658
State:
+$11,105
(% of AGI for various income ranges: 4.4% for AGIs below $25k, 2.2% for AGIs $25k-50k, 1.7% for AGIs $50k-75k, 0.4% for AGIs $75k-100k, 0.9% for AGIs $100k-200k)
Taxable individual retirement arrangement distribution: $10,927 (reported on 8.6% of returns)
46366:
$10,927
Indiana:
$13,841
(% of AGI for various income ranges: 2.9% for AGIs below $25k, 1.9% for AGIs $25k-50k, 2.1% for AGIs $50k-75k, 2.3% for AGIs $75k-100k, 3.0% for AGIs $100k-200k)
Total itemized deductions: $17,424 (17% of AGI, reported on 17.5% of returns)
Here:
$17,424
State:
$20,913
Here:
17.3% of AGI
State:
18.2% of AGI
(% of AGI for various income ranges: 3.7% for AGIs below $25k, 4.9% for AGIs $25k-50k, 5.9% for AGIs $50k-75k, 8.6% for AGIs $75k-100k, 10.0% for AGIs $100k-200k, 7.1% for AGIs over 200k)
Charity contributions: $3,890 (reported on 11.7% of returns)
Here:
$3,890
State:
$4,697
(% of AGI for various income ranges: 0.4% for AGIs below $25k, 0.5% for AGIs $25k-50k, 0.6% for AGIs $50k-75k, 1.3% for AGIs $75k-100k, 1.3% for AGIs $100k-200k, 2.3% for AGIs over 200k)
Taxes paid: $5,880 (reported on 17.5% of returns)
46366:
$5,880
State:
$7,456
(% of AGI for various income ranges: 0.8% for AGIs below $25k, 1.0% for AGIs $25k-50k, 1.6% for AGIs $50k-75k, 2.7% for AGIs $75k-100k, 3.9% for AGIs $100k-200k, 3.8% for AGIs over 200k)
Earned income credit: $2,073 (reported on 21.8% of returns)
Here:
$2,073
State:
$2,265
(% of AGI for various income ranges: 6.8% for AGIs below $25k, 1.2% for AGIs $25k-50k)
Percentage of individuals using paid preparers for their 2012 taxes: 59.9%
Here:
60%
State:
53%
(% for various income ranges: 56.7% for AGIs below $25k, 57.9% for AGIs $25k-50k, 64.9% for AGIs $50k-75k, 63.6% for AGIs $75k-100k, 68.4% for AGIs $100k-200k, 100.0% for AGIs over 200k)
Averages for the 2004 tax year for zip code 46366, filed in 2005:
Average Adjusted Gross Income (AGI) in 2004: $34,653 (Individual Income Tax Returns)
Here:
$34,653
State:
$44,790
Salary/wage: $31,911 (reported on 84.4% of returns)
Here:
$31,911
State:
$39,615
(% of AGI for various income ranges: 86.7% for AGIs below $10k, 74.4% for AGIs $10k-25k, 82.2% for AGIs $25k-50k, 85.0% for AGIs $50k-75k, 87.5% for AGIs $75k-100k, 52.0% for AGIs over 100k)
Taxable interest for individuals: $1,323 (reported on 37.6% of returns)
This zip code:
$1,323
Indiana:
$1,535
(% of AGI for various income ranges: 5.2% for AGIs below $10k, 2.2% for AGIs $10k-25k, 1.4% for AGIs $25k-50k, 0.9% for AGIs $50k-75k, 0.6% for AGIs $75k-100k, 1.6% for AGIs over 100k)
Taxable dividends: $1,791 (reported on 13.3% of returns)
Here:
$1,791
State:
$2,998
(% of AGI for various income ranges: 2.7% for AGIs below $10k, 1.0% for AGIs $10k-25k, 0.7% for AGIs $25k-50k, 0.5% for AGIs $50k-75k, 0.1% for AGIs $75k-100k, 0.8% for AGIs over 100k)
Net capital gain/loss: +$11,362 (reported on 9.5% of returns)
Here:
+$11,362
State:
+$8,619
(% of AGI for various income ranges: -1.0% for AGIs below $10k, 0.5% for AGIs $10k-25k, 0.9% for AGIs $25k-50k, 1.4% for AGIs $50k-75k, 1.7% for AGIs $75k-100k, 13.0% for AGIs over 100k)
Profit/loss from business: +$8,299 (reported on 11.6% of returns)
Here:
+$8,299
State:
+$10,071
(% of AGI for various income ranges: 6.4% for AGIs below $10k, 3.9% for AGIs $10k-25k, 2.8% for AGIs $25k-50k, 2.1% for AGIs $50k-75k, 1.2% for AGIs $75k-100k, 3.7% for AGIs over 100k)
IRA payment deduction: $3,550 (reported on 2.3% of returns)
46366:
$3,550
Indiana:
$2,840
(% of AGI for various income ranges: 0.8% for AGIs below $10k, 0.3% for AGIs $25k-50k, 0.2% for AGIs $50k-75k, 0.6% for AGIs $75k-100k)
Total itemized deductions: $15,044 (21% of AGI, reported on 18.3% of returns)
Here:
$15,044
State:
$17,065
Here:
21.4% of AGI
State:
19.5% of AGI
(% of AGI for various income ranges: 5.3% for AGIs $10k-25k, 6.3% for AGIs $25k-50k, 9.1% for AGIs $50k-75k, 9.7% for AGIs $75k-100k, 10.7% for AGIs over 100k)
Charity contributions deductions: $3,201 (4% of AGI, reported on 14.4% of returns)
Here:
$3,201
State:
$3,550
Here:
4.3% of AGI
State:
3.8% of AGI
(% of AGI for various income ranges: 0.6% for AGIs $10k-25k, 0.8% for AGIs $25k-50k, 1.0% for AGIs $50k-75k, 1.0% for AGIs $75k-100k, 3.7% for AGIs over 100k)
Total tax: $4,383 (reported on 68.7% of returns)
46366:
$4,383
State:
$6,914
(% of AGI for various income ranges: 2.7% for AGIs below $10k, 3.7% for AGIs $10k-25k, 5.9% for AGIs $25k-50k, 8.2% for AGIs $50k-75k, 10.8% for AGIs $75k-100k, 16.6% for AGIs over 100k)
Earned income credit: $1,671 (reported on 18.6% of returns)
Here:
$1,671
State:
$1,685
Percentage of individuals using paid preparers for their 2004 taxes: 65.5%
Here:
65%
State:
59%
(% for various income ranges: 61.3% for AGIs below $10k, 65.8% for AGIs $10k-25k, 65.4% for AGIs $25k-50k, 67.8% for AGIs $50k-75k, 67.6% for AGIs $75k-100k, 80.2% for AGIs over 100k)
Likely homosexual households (counted as self-reported same-sex unmarried-partner households)
Lesbian couples: 0.3% of all households
Gay men: 0.0% of all households
Household received Food Stamps/SNAP in the past 12 months: 230 Household did not receive Food Stamps/SNAP in the past 12 months: 1,885
Women who had a birth in the past 12 months: 121 (123 now married, 6 unmarried) Women who did not have a birth in the past 12 months: 1,302 (490 now married, 810 unmarried)
Housing units in zip code 46366 with a mortgage: 984 (130 second mortgage, 12 home equity loan, 115 both second mortgage and home equity loan) Houses without a mortgage: 39
Median monthly owner costs for units with a mortgage: $1,115 Median monthly owner costs for units without a mortgage: $420
Residents with income below the poverty level in 2022:
This zip code:
9.1%
Whole state:
12.6%
Residents with income below 50% of the poverty level in 2022:
This zip code:
4.5%
Whole state:
6.3%
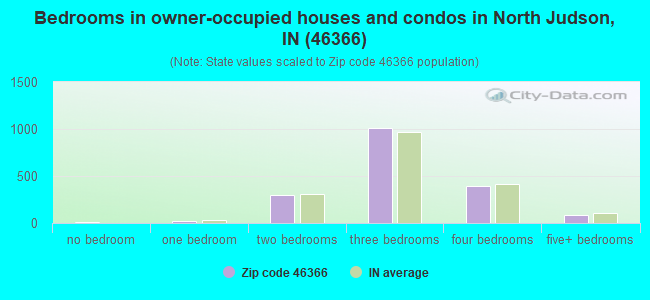
Median number of rooms in houses and condos:
Here:
6.5
State:
6.6
Median number of rooms in apartments:
Here:
4.6
State:
4.3
Notable locations in this zip code not listed on our city pages
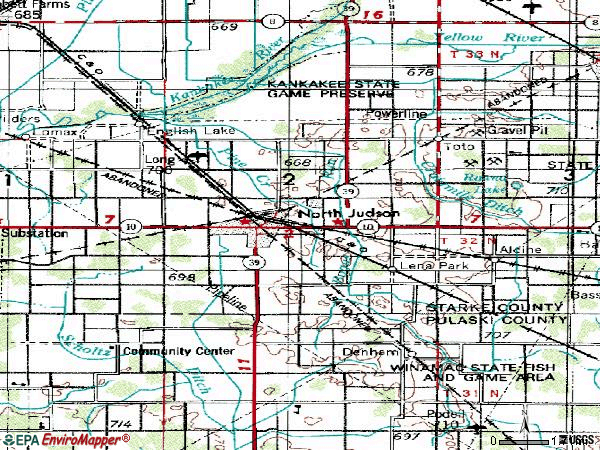
Notable locations in zip code 46366: Newcomer Farm (A), Rozhon Farm (B), Luedtke Dairy Farm (C), Blue Sea Community Building (D), North Judson Volunteer Fire Department (E). Display/hide their locations on the map
1,008 married couples with children.
232 single-parent households (31 men, 201 women).
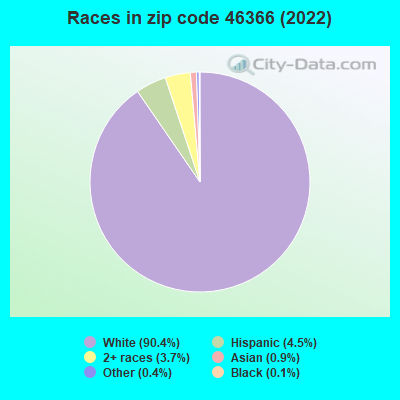
96.7% of residents of 46366 zip code speak English at home.
1.7% of residents speak Spanish at home (61% very well, 39% well).
0.7% of residents speak other Indo-European language at home (38% very well, 24% well, 38% not well).
0.2% of residents speak Asian or Pacific Island language at home (78% very well, 22% well).
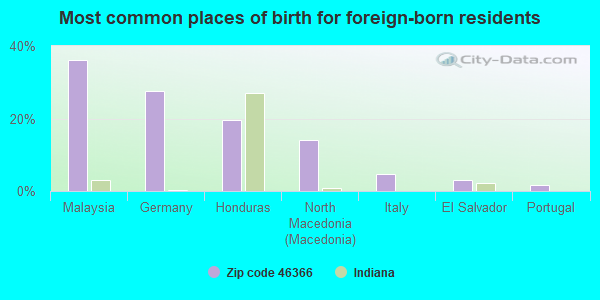
Foreign born population: 126 (2.1%) (25.9% of them are naturalized citizens)
This zip code:
2.1%
Whole state:
6.1%
36%Malaysia
28%Germany
20%Honduras
14%North Macedonia (Macedonia)
5%Italy
3%El Salvador
2%Portugal
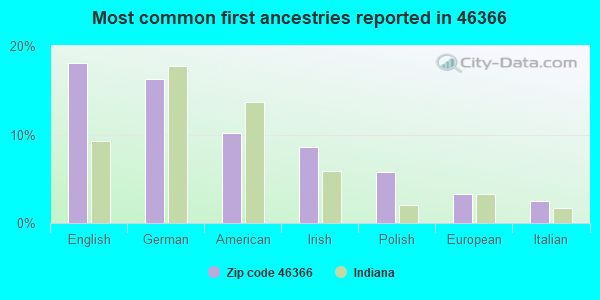
18%English
16%German
10%American
9%Irish
6%Polish
3%European
2%Italian
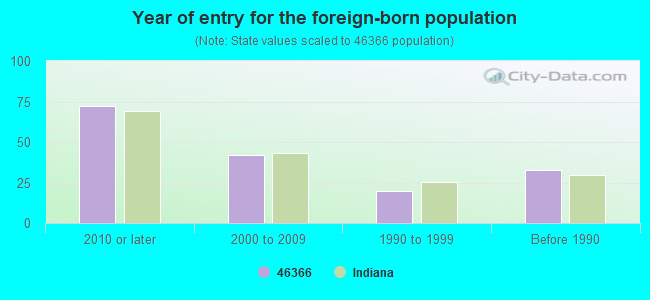
Year of entry for the foreign-born population
722010 or later
422000 to 2009
201990 to 1999
33Before 1990
Facilities with environmental interests located in this zip code:
AMERICAN OAK PRESERVING CO (601 MULBERRY ST in NORTH JUDSON, IN)
STATE MASTER (Indiana facility tracking) - CRTK-7864, EPCRA STATE MASTER (Indiana facility tracking) - CRTK-2969, EPCRA TRI REPORTER (Tracking of toxic chemicals releasing facilities) Business SIC classification: MANUFACTURING INDUSTRIES
SMOLEK FARMS (6552 N 1150 W in NORTH JUDSON, IN)
STATE MASTER (Indiana facility tracking) - SPILL-198911011, RELEASE ASSESSMENT, UST-14619, UNDERGROUND STORAGE TANK PROGRAM (Resource Conservation and Recovery Act (tracking hazardous waste)) Organizations: SMOLEK TRUCKING INC (CONTACT/OWNER)
Alternative names: SMOLEK TRUCKING INC
LIBERTY ELEMENTARY SCHOOL (809 W TALMER AVE in NORTH JUDSON, IN)
(Geographic Names Information System) (National Center for Education Statistics) - STATE ID-7851 Organizations: NORTH JUDSON-SAN PIERRE SCH CORP (SCHOOL DISTRICT)
RICHARDS OF TOTO (3060 S RANGE RD in NORTH JUDSON, IN)
(Integrated Compliance Information System) - ICIS-05-2001-0628, FORMAL ENFORCEMENT ACTION STATE MASTER (Indiana facility tracking) Business SIC classification: MISCELLANEOUS GENERAL MERCHANDISE STORES
NORTH JUDSON-SAN PIERRE HS (1 BLUEJAY DR in NORTH JUDSON, IN)
(National Center for Education Statistics) - STATE ID-7849 Organizations: NORTH JUDSON-SAN PIERRE SCH CORP (SCHOOL DISTRICT)
NORTH JUDSON-SAN PIERRE MDL SCH (950 CAMPBELL DR in NORTH JUDSON, IN)
(National Center for Education Statistics) - STATE ID-7854 Organizations: NORTH JUDSON-SAN PIERRE SCH CORP (SCHOOL DISTRICT)
NORTH JUDSON MUNICIPAL WWTP (900 N ELM ST in NORTH JUDSON, IN)
STATE MASTER (Indiana facility tracking) National Pollutant Discharge Elimination System NON-MAJOR (Tracking pollutant discharge elimination systems) - permit Business SIC classification: SEWERAGE SYSTEMS Organizations: DANIEL ANDERSON 16638 CLS2 (CONTACT/OPERATOR)
, CONNIE MILLER CLERK TREASURER (CONTACT/OWNER)
Alternative names: NORTH JUDSON MUNICIPAL STP, (OLD) NORTH JUDSON MUNICIPAL WWTP
ROGERS PRECISION AUTO SUPPLY (209 W TALMER AVE in NORTH JUDSON, IN)
STATE MASTER (Indiana facility tracking) Conditionally Exempt Small Quantity Generators, less than 100 kg/month of hazardous waste (Resource Conservation and Recovery Act (tracking hazardous waste)) - notification
MARVS BODY SHOP (609 E TALMER AVE in NORTH JUDSON, IN)
STATE MASTER (Indiana facility tracking) Conditionally Exempt Small Quantity Generators, less than 100 kg/month of hazardous waste (Resource Conservation and Recovery Act (tracking hazardous waste)) - notification Organizations: WENGLARZ DAVID (CONTACT/OWNER)
NORTH JUDSON-SAN PIERRE SCH CORP (960 CAMPBEL DR in NORTH JUDSON, IN)
STATE MASTER (Indiana facility tracking) COMPLIANCE ACTIVITY (Tracking inspections of insecticide, fungicide, and rodenticide, and toxic substances) Business SIC classification: ELEMENTARY AND SECONDARY SCHOOLS
Housing units lacking complete plumbing facilities: 1.9% Housing units lacking complete kitchen facilities: 1.8%
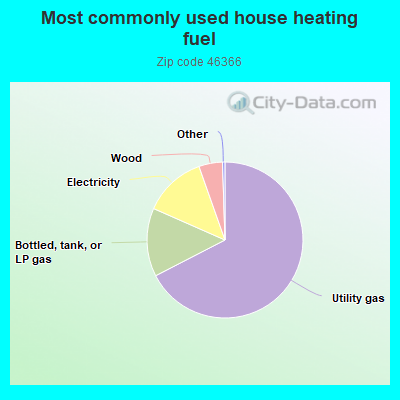
67.5%Utility gas
14.2%Bottled, tank, or LP gas
13.0%Electricity
4.9%Wood
Population in 1990: 8,426.
Place of birth for U.S.-born residents:
This state: 4,686
Northeast: 4
Midwest: 641
South: 350
West: 76
61% of the 46366 zip code residents lived in the same house 5 years ago. Out of people who lived in different houses, 54% lived in this county. Out of people who lived in different counties, 50% lived in Indiana.
93% of the 46366 zip code residents lived in the same house 1 year ago. Out of people who lived in different houses, 41% moved from this county. Out of people who lived in different houses, 21% moved from different county within same state. Out of people who lived in different houses, 37% moved from different state. Out of people who lived in different houses, 6% moved from abroad.
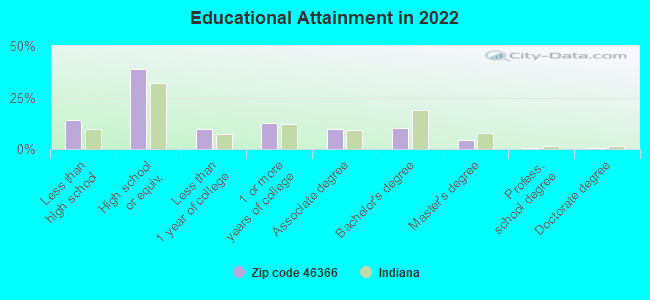
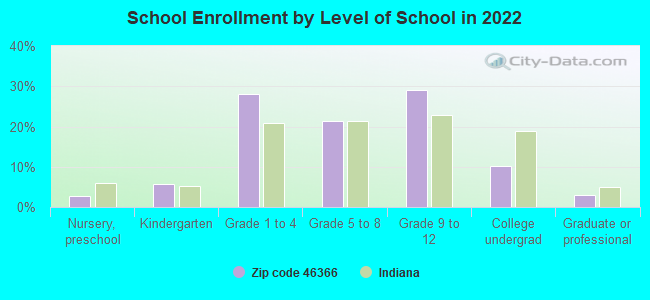
Private vs. public school enrollment:
Students in private schools in grades 1 to 8 (elementary and middle school): 146
Here:
21.8%
Indiana:
14.9%
Students in private schools in grades 9 to 12 (high school): 94
Here:
24.3%
Indiana:
11.4%
Students in private undergraduate colleges: 57
Here:
41.5%
Indiana:
22.3%
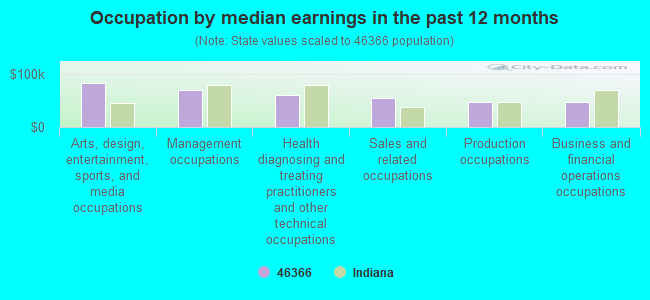
Occupation by median earnings in the past 12 months ($)
82,329Arts, design, entertainment, sports, and media occupations
69,052Management occupations
59,208Health diagnosing and treating practitioners and other technical occupations
54,314Sales and related occupations
46,129Production occupations
45,965Business and financial operations occupations
Top industries in this zip code by the number of employees in 2005:
Accommodation and Food Services: Full-Service Restaurants (10-19: 1, 1-4: 3)
Health Care and Social Assistance: Offices of Dentists (10-19: 1)
Arts, Entertainment, and Recreation: Golf Courses and Country Clubs (10-19: 1)
Fatal accident statistics in 2014:
Fatal accident count: 3
Vehicles involved in fatal accidents: 5
Fatal accidents caused by drunken drivers: 0
Fatalities: 3
Persons involved in fatal accidents: 6
Pedestrians involved in fatal accidents: 0
Fatal accident statistics in 2012:
Fatal accident count: 1
Vehicles involved in fatal accidents: 1
Fatal accidents caused by drunken drivers: 0
Fatalities: 1
Persons involved in fatal accidents: 1
Pedestrians involved in fatal accidents: 0
2002 - 2017 National Fire Incident Reporting System (NFIRS) incidents
According to the data from the years 2002 - 2017 the average number of fire incidents per year is 46. The highest number of fire incidents - 110 took place in 2003, and the least - 0 in 2012. The data has a rising trend.
When looking into fire subcategories, the most incidents belonged to: Outside Fires (64.9%), and Structure Fires (26.9%).
Fire incident types reported to NFIRS in Zip Code 46366
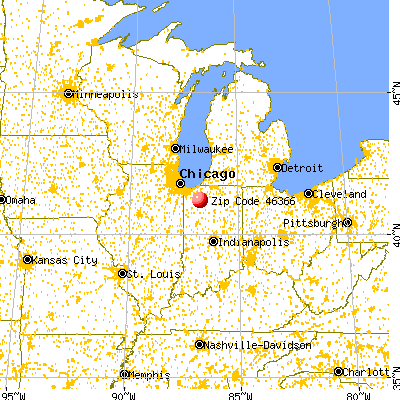


 Nearest zip codes: 46374, 46348, 46534, 46340, 47957, 46996.


 According to the data from the years 2002 - 2017 the average number of fire incidents per year is 46. The highest number of fire incidents - 110 took place in 2003, and the least - 0 in 2012. The data has a rising trend.
 When looking into fire subcategories, the most incidents belonged to: Outside Fires (64.9%), and Structure Fires (26.9%).