Estimated zip code population in 2022: 2,844 Zip code population in 2010: 3,445 Zip code population in 2000: 2,994
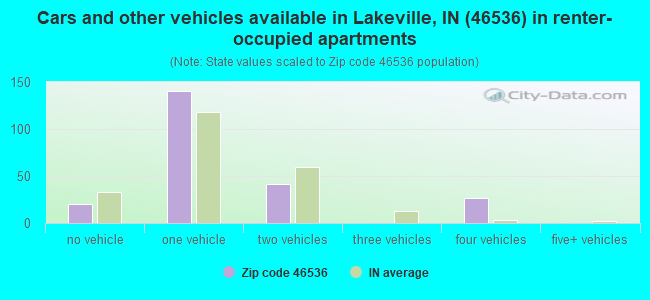
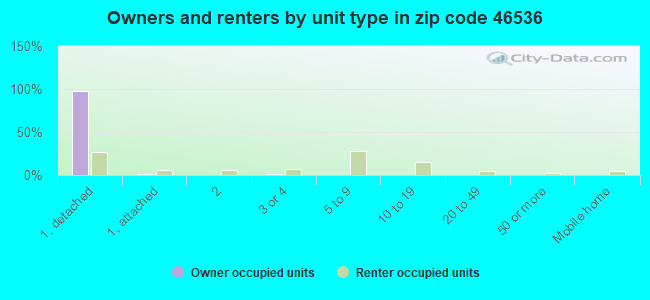
Houses and condos: 1,431 Renter-occupied apartments: 229
% of renters here:
18%
State:
29%
March 2022 cost of living index in zip code 46536: 85.9 (less than average, U.S. average is 100)
Land area: 29.0 sq. mi. Water area: 0.2 sq. mi.
Population density: 98 people per square mile
(very low).
OSM Map
General Map
Google Map
MSN Map
OSM Map
General Map
Google Map
MSN Map
OSM Map
General Map
Google Map
MSN Map
OSM Map
General Map
Google Map
MSN Map
Please wait while loading the map...
Real estate property taxes paid for housing units in 2022:
This zip code:
0.7% ($1,554)
Indiana:
0.7% ($1,467)
Median real estate property taxes paid for housing units with mortgages in 2022: $1,441 (0.6%) Median real estate property taxes paid for housing units with no mortgage in 2022: $1,755 (0.8%)
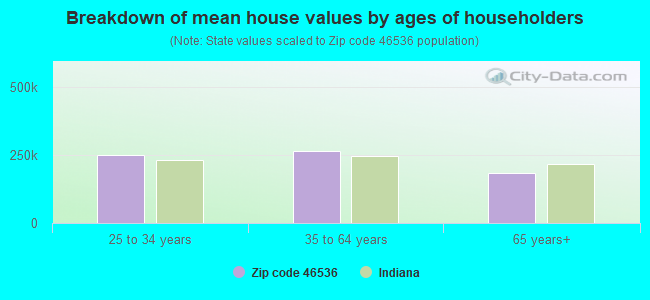
Estimated median house/condo value in 2022: $230,297
46536:
$230,297
Indiana:
$208,700
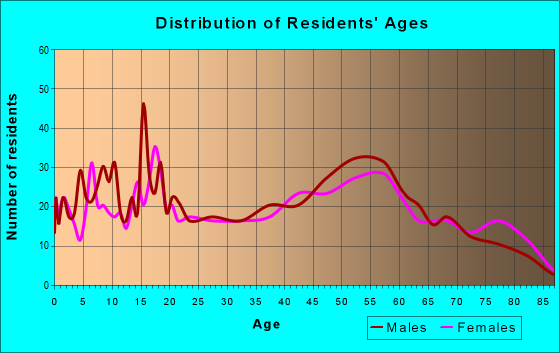
Median resident age:
This zip code:
49.5 years
Indiana median age:
38.2 years
Average household size:
This zip code:
2.3 people
Indiana:
2.4 people
Averages for the 2020 tax year for zip code 46536, filed in 2021:
Average Adjusted Gross Income (AGI) in 2020: $60,266 (Individual Income Tax Returns)
Here:
$60,266
State:
$64,978
Salary/wage: $52,390 (reported on 80.0% of returns)
Here:
$52,390
State:
$55,245
(% of AGI for various income ranges: 1102.3% for AGIs below $25k, 3334.2% for AGIs $25k-50k, 5787.5% for AGIs $50k-75k, 9275.4% for AGIs $75k-100k, 14893.8% for AGIs $100k-200k)
Taxable interest for individuals: $1,004 (reported on 34.2% of returns)
This zip code:
$1,004
Indiana:
$1,351
(% of AGI for various income ranges: 22.6% for AGIs below $25k, 24.5% for AGIs $25k-50k, 46.0% for AGIs $50k-75k, 32.3% for AGIs $75k-100k, 55.4% for AGIs $100k-200k)
Ordinary dividends: $6,567 (reported on 15.5% of returns)
Here:
$6,567
State:
$5,827
(% of AGI for various income ranges: 27.1% for AGIs below $25k, 19.1% for AGIs $25k-50k, 71.0% for AGIs $50k-75k, 68.5% for AGIs $75k-100k, 90.0% for AGIs $100k-200k)
Net capital gain/loss in AGI: +$7,539 (reported on 14.8% of returns)
Here:
+$7,539
State:
+$17,730
(% of AGI for various income ranges: 28.7% for AGIs below $25k, 15.2% for AGIs $25k-50k, 103.5% for AGIs $50k-75k, 88.5% for AGIs $75k-100k, 484.6% for AGIs $100k-200k)
Profit/loss from business: +$10,537 (reported on 12.3% of returns)
Here:
+$10,537
State:
+$12,144
(% of AGI for various income ranges: 106.8% for AGIs below $25k, 162.1% for AGIs $25k-50k, 175.5% for AGIs $50k-75k, 290.0% for AGIs $75k-100k, 313.8% for AGIs $100k-200k)
Taxable individual retirement arrangement distribution: $15,420 (reported on 12.9% of returns)
46536:
$15,420
Indiana:
$18,302
(% of AGI for various income ranges: 86.8% for AGIs below $25k, 128.8% for AGIs $25k-50k, 322.0% for AGIs $50k-75k, 313.1% for AGIs $75k-100k, 1030.0% for AGIs $100k-200k)
Total itemized deductions: $22,317 (reported on 3.9% of returns)
Here:
$22,317
State:
$35,601
(% of AGI for various income ranges: 373.0% for AGIs $50k-75k, 456.2% for AGIs $100k-200k)
Charity contributions: $7,875 (reported on 2.6% of returns)
Here:
$7,875
State:
$15,596
(% of AGI for various income ranges: 242.3% for AGIs $100k-200k)
Taxes paid: $6,517 (reported on 3.9% of returns)
46536:
$6,517
State:
$7,542
(% of AGI for various income ranges: 88.5% for AGIs $50k-75k, 164.6% for AGIs $100k-200k)
Earned income credit: $2,416 (reported on 12.3% of returns)
Here:
$2,416
State:
$2,298
(% of AGI for various income ranges: 83.9% for AGIs below $25k, 60.3% for AGIs $25k-50k)
Percentage of individuals using paid preparers for their 2020 taxes: 94.2%
Here:
94%
State:
94%
(% for various income ranges: 93.6% for AGIs below $25k, 94.9% for AGIs $25k-50k, 96.3% for AGIs $50k-75k, 88.9% for AGIs $75k-100k, 100.0% for AGIs $100k-200k, 80.0% for AGIs over 200k)
Averages for the 2012 tax year for zip code 46536, filed in 2013:
Average Adjusted Gross Income (AGI) in 2012: $53,862 (Individual Income Tax Returns)
Here:
$53,862
State:
$52,932
Salary/wage: $44,424 (reported on 82.9% of returns)
Here:
$44,424
State:
$45,173
(% of AGI for various income ranges: 65.7% for AGIs below $25k, 81.1% for AGIs $25k-50k, 77.3% for AGIs $50k-75k, 80.2% for AGIs $75k-100k, 78.7% for AGIs $100k-200k, 34.4% for AGIs over 200k)
Taxable interest for individuals: $767 (reported on 36.2% of returns)
This zip code:
$767
Indiana:
$1,311
(% of AGI for various income ranges: 1.3% for AGIs below $25k, 0.6% for AGIs $25k-50k, 0.8% for AGIs $50k-75k, 0.4% for AGIs $75k-100k, 0.3% for AGIs $100k-200k, 0.2% for AGIs over 200k)
Ordinary dividends: $2,346 (reported on 15.8% of returns)
Here:
$2,346
State:
$4,690
(% of AGI for various income ranges: 1.5% for AGIs below $25k, 0.7% for AGIs $25k-50k, 0.5% for AGIs $50k-75k, 0.6% for AGIs $75k-100k, 1.3% for AGIs $100k-200k)
Net capital gain/loss in AGI: +$6,606 (reported on 11.2% of returns)
Here:
+$6,606
State:
+$10,406
(% of AGI for various income ranges: 0.2% for AGIs below $25k, 0.2% for AGIs $25k-50k, 0.6% for AGIs $50k-75k, 6.6% for AGIs $100k-200k)
Profit/loss from business: +$10,123 (reported on 14.5% of returns)
Here:
+$10,123
State:
+$11,105
(% of AGI for various income ranges: 6.9% for AGIs below $25k, 2.8% for AGIs $25k-50k, 3.1% for AGIs $50k-75k, 1.8% for AGIs $75k-100k, 4.4% for AGIs $100k-200k)
Taxable individual retirement arrangement distribution: $8,459 (reported on 11.2% of returns)
46536:
$8,459
Indiana:
$13,841
(% of AGI for various income ranges: 6.3% for AGIs below $25k, 1.8% for AGIs $25k-50k, 2.0% for AGIs $50k-75k, 3.3% for AGIs $75k-100k)
Total itemized deductions: $20,108 (18% of AGI, reported on 26.3% of returns)
Here:
$20,108
State:
$20,913
Here:
18.2% of AGI
State:
18.2% of AGI
(% of AGI for various income ranges: 8.3% for AGIs below $25k, 7.8% for AGIs $25k-50k, 9.0% for AGIs $50k-75k, 11.3% for AGIs $75k-100k, 12.0% for AGIs $100k-200k, 9.6% for AGIs over 200k)
Charity contributions: $3,235 (reported on 20.4% of returns)
Here:
$3,235
State:
$4,697
(% of AGI for various income ranges: 0.8% for AGIs below $25k, 0.8% for AGIs $25k-50k, 1.7% for AGIs $50k-75k, 1.4% for AGIs $75k-100k, 1.6% for AGIs $100k-200k, 0.9% for AGIs over 200k)
Taxes paid: $7,322 (reported on 26.3% of returns)
46536:
$7,322
State:
$7,456
(% of AGI for various income ranges: 1.1% for AGIs below $25k, 1.9% for AGIs $25k-50k, 2.5% for AGIs $50k-75k, 3.8% for AGIs $75k-100k, 5.5% for AGIs $100k-200k, 4.9% for AGIs over 200k)
Earned income credit: $2,187 (reported on 15.1% of returns)
Here:
$2,187
State:
$2,265
(% of AGI for various income ranges: 5.3% for AGIs below $25k, 1.0% for AGIs $25k-50k)
Percentage of individuals using paid preparers for their 2012 taxes: 48.0%
Here:
48%
State:
53%
(% for various income ranges: 40.0% for AGIs below $25k, 45.9% for AGIs $25k-50k, 54.2% for AGIs $50k-75k, 56.2% for AGIs $75k-100k, 58.3% for AGIs $100k-200k, 100.0% for AGIs over 200k)
Averages for the 2004 tax year for zip code 46536, filed in 2005:
Average Adjusted Gross Income (AGI) in 2004: $48,726 (Individual Income Tax Returns)
Here:
$48,726
State:
$44,790
Salary/wage: $39,579 (reported on 87.3% of returns)
Here:
$39,579
State:
$39,615
(% of AGI for various income ranges: 108.1% for AGIs below $10k, 73.7% for AGIs $10k-25k, 83.7% for AGIs $25k-50k, 85.3% for AGIs $50k-75k, 86.0% for AGIs $75k-100k, 47.8% for AGIs over 100k)
Taxable interest for individuals: $1,282 (reported on 48.7% of returns)
This zip code:
$1,282
Indiana:
$1,535
(% of AGI for various income ranges: 7.4% for AGIs below $10k, 2.6% for AGIs $10k-25k, 1.0% for AGIs $25k-50k, 1.1% for AGIs $50k-75k, 1.0% for AGIs $75k-100k, 1.1% for AGIs over 100k)
Taxable dividends: $1,273 (reported on 21.4% of returns)
Here:
$1,273
State:
$2,998
(% of AGI for various income ranges: 2.4% for AGIs below $10k, 0.9% for AGIs $10k-25k, 0.6% for AGIs $25k-50k, 0.9% for AGIs $50k-75k, 0.4% for AGIs $75k-100k, 0.3% for AGIs over 100k)
Net capital gain/loss: +$4,513 (reported on 15.9% of returns)
Here:
+$4,513
State:
+$8,619
(% of AGI for various income ranges: -2.2% for AGIs below $10k, 0.3% for AGIs $10k-25k, 0.9% for AGIs $25k-50k, 0.3% for AGIs $50k-75k, 2.5% for AGIs $75k-100k, 2.4% for AGIs over 100k)
Profit/loss from business: +$10,624 (reported on 14.3% of returns)
Here:
+$10,624
State:
+$10,071
(% of AGI for various income ranges: 7.2% for AGIs below $10k, 2.2% for AGIs $10k-25k, 3.8% for AGIs $25k-50k, 1.5% for AGIs $50k-75k, 4.6% for AGIs $75k-100k, 3.1% for AGIs over 100k)
IRA payment deduction: $2,857 (reported on 2.9% of returns)
46536:
$2,857
Indiana:
$2,840
Total itemized deductions: $16,564 (20% of AGI, reported on 28.6% of returns)
Here:
$16,564
State:
$17,065
Here:
20.2% of AGI
State:
19.5% of AGI
(% of AGI for various income ranges: 7.5% for AGIs $10k-25k, 8.1% for AGIs $25k-50k, 11.5% for AGIs $50k-75k, 11.5% for AGIs $75k-100k, 9.8% for AGIs over 100k)
Charity contributions deductions: $3,788 (4% of AGI, reported on 24.0% of returns)
Here:
$3,788
State:
$3,550
Here:
4.4% of AGI
State:
3.8% of AGI
(% of AGI for various income ranges: 0.7% for AGIs $10k-25k, 1.0% for AGIs $25k-50k, 1.6% for AGIs $50k-75k, 1.8% for AGIs $75k-100k, 2.9% for AGIs over 100k)
Total tax: $5,952 (reported on 75.6% of returns)
46536:
$5,952
State:
$6,914
(% of AGI for various income ranges: 1.9% for AGIs below $10k, 3.9% for AGIs $10k-25k, 6.7% for AGIs $25k-50k, 8.0% for AGIs $50k-75k, 10.5% for AGIs $75k-100k, 12.2% for AGIs over 100k)
Earned income credit: $1,467 (reported on 11.2% of returns)
Here:
$1,467
State:
$1,685
Percentage of individuals using paid preparers for their 2004 taxes: 56.7%
Here:
57%
State:
59%
(% for various income ranges: 45.5% for AGIs below $10k, 57.9% for AGIs $10k-25k, 55.5% for AGIs $25k-50k, 59.8% for AGIs $50k-75k, 65.8% for AGIs $75k-100k, 71.8% for AGIs over 100k)
Household received Food Stamps/SNAP in the past 12 months: 78 Household did not receive Food Stamps/SNAP in the past 12 months: 1,181
Women who had a birth in the past 12 months: 47 (51 now married, 0 unmarried) Women who did not have a birth in the past 12 months: 593 (271 now married, 321 unmarried)
Housing units in zip code 46536 with a mortgage: 688 (93 second mortgage, 49 both second mortgage and home equity loan) Houses without a mortgage: 11
Median monthly owner costs for units with a mortgage: $1,332 Median monthly owner costs for units without a mortgage: $447
Residents with income below the poverty level in 2022:
This zip code:
7.3%
Whole state:
12.6%
Residents with income below 50% of the poverty level in 2022:
This zip code:
4.2%
Whole state:
6.3%
Median number of rooms in houses and condos:
Here:
6.3
State:
6.6
Median number of rooms in apartments:
Here:
4.6
State:
4.3
Notable locations in this zip code not listed on our city pages
Churches in zip code 46536 include: County Line Church (A), Maple Grove Church (B), Olive Branch Church (C), Pleasant View Church (D). Display/hide their locations on the map
In group quarters: 2 (-1 institutionalized population)
Size of family households: 573 2-persons, 169 3-persons, 75 4-persons, 40 5-persons, 42 6-persons, 3 7-or-more-persons
Size of nonfamily households: 318 1-person, 44 2-persons
309 married couples with children.
117 single-parent households (32 men, 85 women).
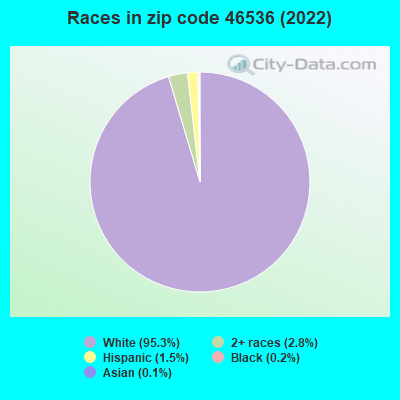
97.9% of residents of 46536 zip code speak English at home.
1.2% of residents speak Spanish at home (100% very well).
0.4% of residents speak other Indo-European language at home (100% very well).
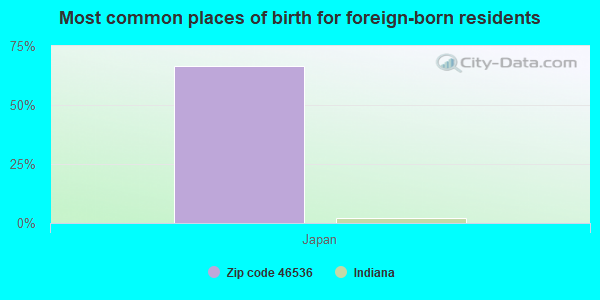
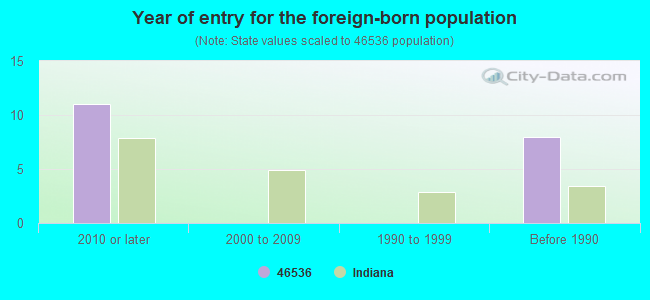
Foreign born population: 3 (0.1%) (100.0% of them are naturalized citizens)
This zip code:
0.1%
Whole state:
6.1%
67%Japan
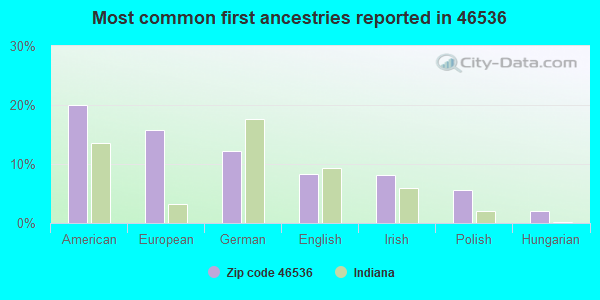
20%American
16%European
12%German
8%English
8%Irish
6%Polish
2%Hungarian
Year of entry for the foreign-born population
112010 or later
02000 to 2009
01990 to 1999
8Before 1990
Facilities with environmental interests located in this zip code:
SIGMA FIBERGLASS INC (520 INDUSTRIAL DR in LAKEVILLE, IN)
AIR MAJOR (AIRS/AFS) STATE MASTER (Indiana facility tracking) - ACES-OP-14100071, AIR PROGRAM, CRTK-9762, EPCRA CRITERIA AND HAZARDOUS AIR POLLUTANT INVENTORY (Inventory of air pollution sources) Conditionally Exempt Small Quantity Generators, less than 100 kg/month of hazardous waste (Resource Conservation and Recovery Act (tracking hazardous waste)) - notification TRI REPORTER (Tracking of toxic chemicals releasing facilities) Business SIC classification: PLASTICS PLUMBING FIXTURES; PLASTICS PRODUCTS; FLAT GLASS Business NAICS classification: FLAT GLASS MANUFACTURING. Organizations: ULTRA GLAS OF LAKEVILLE INC (CONTACT/OWNER)
Alternative names: ULTRA GLAS OF LAKEVILLE INC, ULTRA/GLASS OF LAKEVILLE, INC.
BRISTOL CORP (555 N MICHIGAN ST in LAKEVILLE, IN)
STATE MASTER (Indiana facility tracking) - CRTK-3231, EPCRA (Resource Conservation and Recovery Act (tracking hazardous waste)) Alternative names: BRISTOL CORP ELECTRICAL SYSTEMS DIV
DAVENPORT INSURANCE (215 S MICHIGAN ST in LAKEVILLE, IN)
STATE MASTER (Indiana facility tracking) - UST-17737, UNDERGROUND STORAGE TANK PROGRAM COMPLIANCE ACTIVITY (Tracking inspections of insecticide, fungicide, and rodenticide, and toxic substances) Alternative names: UNION NORTH UNITED SCHOOL CORP
MIDWEST COLLISION & PAINT INC (514 COMMERCE DR in LAKEVILLE, IN)
STATE MASTER (Indiana facility tracking) (Resource Conservation and Recovery Act (tracking hazardous waste)) Organizations: SUSITS FABIAN (CONTACT/OWNER)
NELUNDS BODY WORKS (66080 US 31 S in LAKEVILLE, IN)
STATE MASTER (Indiana facility tracking) Conditionally Exempt Small Quantity Generators, less than 100 kg/month of hazardous waste (Resource Conservation and Recovery Act (tracking hazardous waste)) Organizations: NELUND JIM/SUE (CONTACT/OWNER)
Housing units lacking complete plumbing facilities: 3.5% Housing units lacking complete kitchen facilities: 3.6%
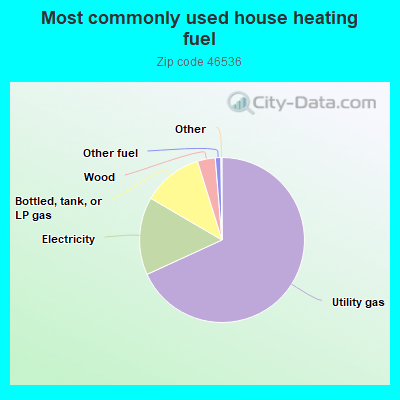
68.3%Utility gas
15.3%Electricity
11.8%Bottled, tank, or LP gas
3.5%Wood
1.1%Other fuel
Population in 1990: 3,355.
Place of birth for U.S.-born residents:
This state: 2,356
Northeast: 64
Midwest: 236
South: 74
West: 77
67% of the 46536 zip code residents lived in the same house 5 years ago. Out of people who lived in different houses, 58% lived in this county. Out of people who lived in different counties, 50% lived in Indiana.
95% of the 46536 zip code residents lived in the same house 1 year ago. Out of people who lived in different houses, 42% moved from this county. Out of people who lived in different houses, 55% moved from different county within same state. Out of people who lived in different houses, 10% moved from different state.
Private vs. public school enrollment:
Students in private schools in grades 1 to 8 (elementary and middle school): 5
Here:
3.3%
Indiana:
14.9%
Students in private schools in grades 9 to 12 (high school): 25
Here:
24.1%
Indiana:
11.4%
Students in private undergraduate colleges: 2
Here:
4.6%
Indiana:
22.3%
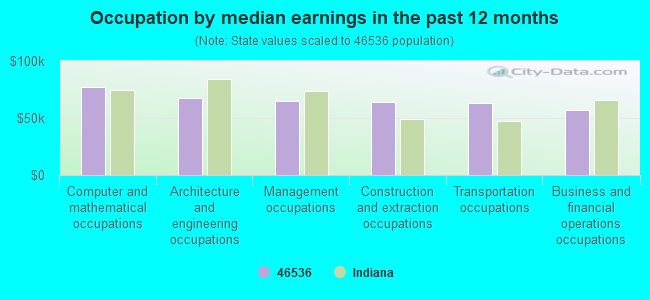
Occupation by median earnings in the past 12 months ($)
77,395Computer and mathematical occupations
67,784Architecture and engineering occupations
65,181Management occupations
63,920Construction and extraction occupations
62,949Transportation occupations
56,953Business and financial operations occupations
Companies with federal contracts located in this zip code:
APPLIED GROUND SUPPORT TECHNIC (65777 MULBERRY ROAD in LAKEVILLE, IN; small business) : $696,644 in 9 contractsfrom 2003 to 2005
Contracts for Miscellaneous Electrical and Electronic Components, Technical Representation Services -- Aircraft Launching, Landing, and Ground Handling Equipment, Aircraft Maintenance and Repair Shop Specialized Equipment by Air Force Signed by year:2000: $0; 2001: $0; 2002: $0; 2003: $83,699; 2004: $394,559; 2005: $218,386; 2006: $0.
Biggest contracts:
$166,640 with Air Force for Miscellaneous Electrical and Electronic Components. Taking place in OK. Signed on 2004-07-09. Completion date: 2004-12-30.
$140,000 with Air Force for Technical Representation Services -- Aircraft Launching, Landing, and Ground Handling Equipment. Taking place in OK. Signed on 2005-06-30. Completion date: 2006-07-01.
$95,994, same as above.Signed on 2004-06-01. Completion date: 2005-03-01.
$95,925, same as above.Signed on 2004-06-14. Completion date: 2005-04-06.
Top industries in this zip code by the number of employees in 2005:
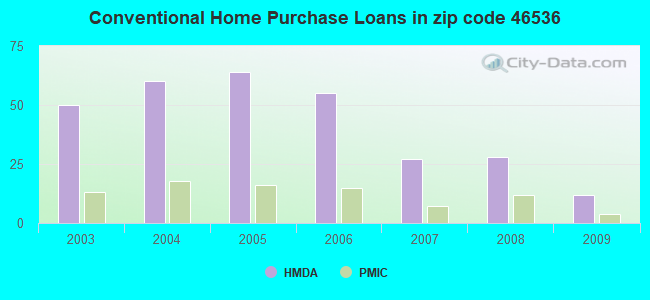
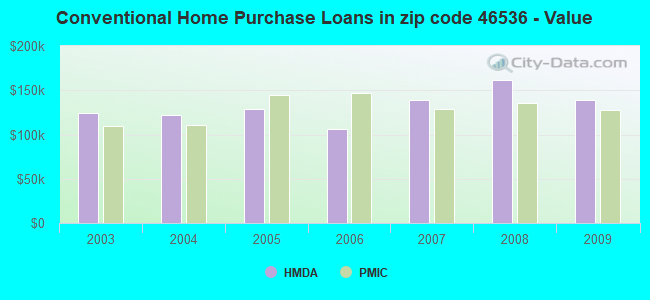
Detailed PMIC statistics for the following Tracts:0123.00
2003 - 2018 National Fire Incident Reporting System (NFIRS) incidents
Based on the data from the years 2003 - 2018 the average number of fire incidents per year is 26. The highest number of reported fires - 53 took place in 2010, and the least - 3 in 2014. The data has a decreasing trend.
When looking into fire subcategories, the most incidents belonged to: Outside Fires (45.6%), and Structure Fires (35.4%).
Fire incident types reported to NFIRS in Zip Code 46536


 Nearest zip codes: 46537, 46614, 46554, 46595, 46506, 46613.


 Based on the data from the years 2003 - 2018 the average number of fire incidents per year is 26. The highest number of reported fires - 53 took place in 2010, and the least - 3 in 2014. The data has a decreasing trend.
 When looking into fire subcategories, the most incidents belonged to: Outside Fires (45.6%), and Structure Fires (35.4%).