Estimated zip code population in 2022: 7,566 Zip code population in 2010: 6,396 Zip code population in 2000: 4,976
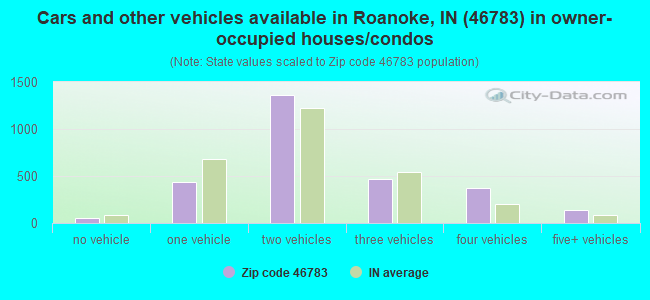
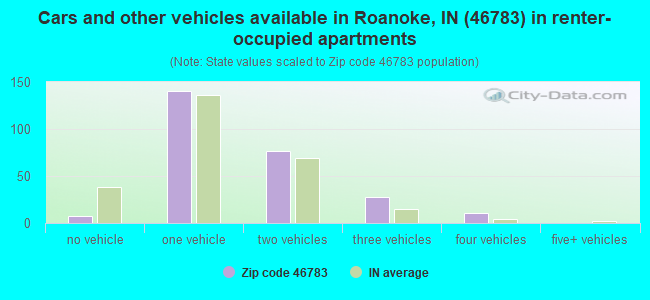
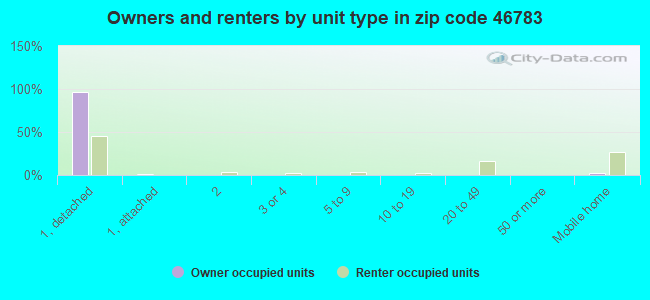
Houses and condos: 3,276 Renter-occupied apartments: 266
% of renters here:
9%
State:
29%
March 2022 cost of living index in zip code 46783: 85.9 (less than average, U.S. average is 100)
Land area: 60.2 sq. mi. Water area: 0.5 sq. mi.
Population density: 126 people per square mile
(very low).
OSM Map
General Map
Google Map
MSN Map
OSM Map
General Map
Google Map
MSN Map
OSM Map
General Map
Google Map
MSN Map
OSM Map
General Map
Google Map
MSN Map
Please wait while loading the map...
Real estate property taxes paid for housing units in 2022:
This zip code:
0.6% ($1,782)
Indiana:
0.7% ($1,467)
Median real estate property taxes paid for housing units with mortgages in 2022: $1,829 (0.6%) Median real estate property taxes paid for housing units with no mortgage in 2022: $1,611 (0.7%)
Business Search- 14 Million verified businesses
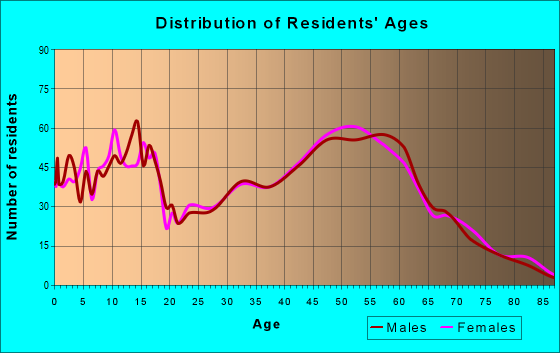
Males: 3,883
(51.3%)
Females: 3,683
(48.7%)
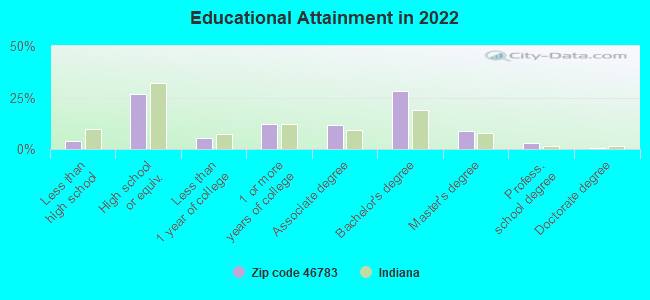
For population 25 years and over in 46783:
High school or higher: 96.6%
Bachelor's degree or higher: 40.8%
Graduate or professional degree: 12.5%
Unemployed: 1.4%
Mean travel time to work (commute): 23.6 minutes
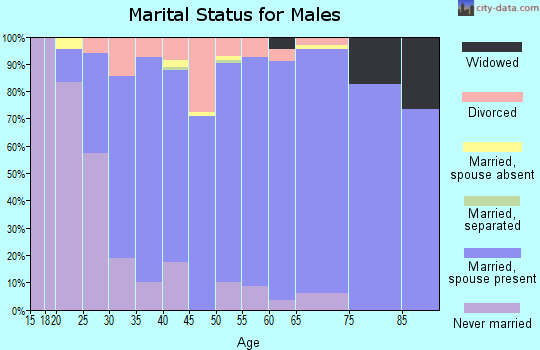
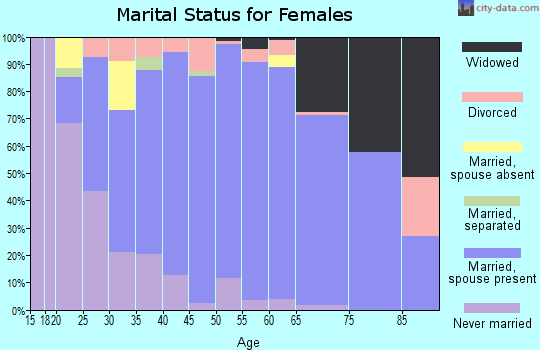
For population 15 years and over in 46783:
Never married: 21.7%
Now married: 66.8%
Separated: 0.5%
Widowed: 4.7%
Divorced: 6.4%
Zip code 46783 compared to state average:
Unemployed percentage below state average.
Black race population percentage significantly below state average.
Foreign-born population percentage significantly below state average.
Renting percentage significantly below state average.
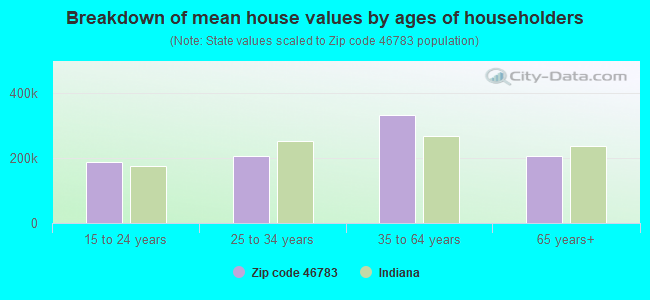
Estimated median house/condo value in 2022: $274,288
46783:
$274,288
Indiana:
$208,700
Median resident age:
This zip code:
41.7 years
Indiana median age:
38.2 years
Average household size:
This zip code:
2.4 people
Indiana:
2.4 people
Averages for the 2020 tax year for zip code 46783, filed in 2021:
Average Adjusted Gross Income (AGI) in 2020: $98,269 (Individual Income Tax Returns)
Here:
$98,269
State:
$64,978
Salary/wage: $79,362 (reported on 83.2% of returns)
Here:
$79,362
State:
$55,245
(% of AGI for various income ranges: 1079.7% for AGIs below $25k, 3524.0% for AGIs $25k-50k, 6251.1% for AGIs $50k-75k, 8642.4% for AGIs $75k-100k, 16817.4% for AGIs $100k-200k, 87100.0% for AGIs over 200k)
Taxable interest for individuals: $1,706 (reported on 43.2% of returns)
This zip code:
$1,706
Indiana:
$1,351
(% of AGI for various income ranges: 20.0% for AGIs below $25k, 24.3% for AGIs $25k-50k, 40.5% for AGIs $50k-75k, 47.9% for AGIs $75k-100k, 87.4% for AGIs $100k-200k, 1897.8% for AGIs over 200k)
Ordinary dividends: $5,169 (reported on 28.4% of returns)
Here:
$5,169
State:
$5,827
(% of AGI for various income ranges: 38.0% for AGIs below $25k, 47.4% for AGIs $25k-50k, 113.2% for AGIs $50k-75k, 160.3% for AGIs $75k-100k, 286.8% for AGIs $100k-200k, 2751.1% for AGIs over 200k)
Net capital gain/loss in AGI: +$13,901 (reported on 25.4% of returns)
Here:
+$13,901
State:
+$17,730
(% of AGI for various income ranges: 28.5% for AGIs below $25k, 37.0% for AGIs $25k-50k, 133.0% for AGIs $50k-75k, 206.1% for AGIs $75k-100k, 524.3% for AGIs $100k-200k, 9717.8% for AGIs over 200k)
Profit/loss from business: +$11,998 (reported on 14.6% of returns)
Here:
+$11,998
State:
+$12,144
(% of AGI for various income ranges: 38.5% for AGIs below $25k, 107.9% for AGIs $25k-50k, 184.6% for AGIs $50k-75k, 118.2% for AGIs $75k-100k, 430.0% for AGIs $100k-200k, 2577.8% for AGIs over 200k)
Taxable individual retirement arrangement distribution: $22,272 (reported on 12.7% of returns)
46783:
$22,272
Indiana:
$18,302
(% of AGI for various income ranges: 90.3% for AGIs below $25k, 131.5% for AGIs $25k-50k, 378.4% for AGIs $50k-75k, 422.4% for AGIs $75k-100k, 705.5% for AGIs $100k-200k, 2985.6% for AGIs over 200k)
Total itemized deductions: $40,425 (reported on 7.6% of returns)
Here:
$40,425
State:
$35,601
(% of AGI for various income ranges: 511.1% for AGIs $50k-75k, 529.4% for AGIs $100k-200k, 7357.8% for AGIs over 200k)
Charity contributions: $19,822 (reported on 6.2% of returns)
Here:
$19,822
State:
$15,596
(% of AGI for various income ranges: 62.4% for AGIs $50k-75k, 203.8% for AGIs $100k-200k, 3608.9% for AGIs over 200k)
Taxes paid: $8,282 (reported on 7.6% of returns)
46783:
$8,282
State:
$7,542
(% of AGI for various income ranges: 82.4% for AGIs $50k-75k, 144.7% for AGIs $100k-200k, 1385.6% for AGIs over 200k)
Earned income credit: $1,859 (reported on 7.8% of returns)
Here:
$1,859
State:
$2,298
(% of AGI for various income ranges: 44.9% for AGIs below $25k, 50.0% for AGIs $25k-50k)
Percentage of individuals using paid preparers for their 2020 taxes: 94.9%
Here:
95%
State:
94%
(% for various income ranges: 92.5% for AGIs below $25k, 93.9% for AGIs $25k-50k, 94.2% for AGIs $50k-75k, 97.7% for AGIs $75k-100k, 96.4% for AGIs $100k-200k, 96.8% for AGIs over 200k)
Averages for the 2012 tax year for zip code 46783, filed in 2013:
Average Adjusted Gross Income (AGI) in 2012: $81,038 (Individual Income Tax Returns)
Here:
$81,038
State:
$52,932
Salary/wage: $62,381 (reported on 85.6% of returns)
Here:
$62,381
State:
$45,173
(% of AGI for various income ranges: 67.0% for AGIs below $25k, 74.9% for AGIs $25k-50k, 78.0% for AGIs $50k-75k, 84.4% for AGIs $75k-100k, 79.7% for AGIs $100k-200k, 42.1% for AGIs over 200k)
Taxable interest for individuals: $1,395 (reported on 43.5% of returns)
This zip code:
$1,395
Indiana:
$1,311
(% of AGI for various income ranges: 2.0% for AGIs below $25k, 0.8% for AGIs $25k-50k, 0.8% for AGIs $50k-75k, 0.3% for AGIs $75k-100k, 0.5% for AGIs $100k-200k, 1.0% for AGIs over 200k)
Ordinary dividends: $6,258 (reported on 28.1% of returns)
Here:
$6,258
State:
$4,690
(% of AGI for various income ranges: 2.6% for AGIs below $25k, 1.7% for AGIs $25k-50k, 0.7% for AGIs $50k-75k, 1.0% for AGIs $75k-100k, 1.2% for AGIs $100k-200k, 3.9% for AGIs over 200k)
Net capital gain/loss in AGI: +$11,248 (reported on 20.9% of returns)
Here:
+$11,248
State:
+$10,406
(% of AGI for various income ranges: 0.6% for AGIs $25k-50k, 0.4% for AGIs $75k-100k, 0.9% for AGIs $100k-200k, 7.3% for AGIs over 200k)
Profit/loss from business: +$6,536 (reported on 14.4% of returns)
Here:
+$6,536
State:
+$11,105
(% of AGI for various income ranges: 2.2% for AGIs below $25k, 2.2% for AGIs $25k-50k, 1.3% for AGIs $50k-75k, 1.3% for AGIs $75k-100k, 1.9% for AGIs $100k-200k, 0.1% for AGIs over 200k)
Taxable individual retirement arrangement distribution: $14,559 (reported on 13.4% of returns)
46783:
$14,559
Indiana:
$13,841
(% of AGI for various income ranges: 5.1% for AGIs below $25k, 2.1% for AGIs $25k-50k, 2.7% for AGIs $50k-75k, 2.7% for AGIs $75k-100k, 3.1% for AGIs $100k-200k, 1.4% for AGIs over 200k)
Total itemized deductions: $24,913 (16% of AGI, reported on 37.3% of returns)
Here:
$24,913
State:
$20,913
Here:
16.2% of AGI
State:
18.2% of AGI
(% of AGI for various income ranges: 10.5% for AGIs below $25k, 10.2% for AGIs $25k-50k, 9.7% for AGIs $50k-75k, 11.9% for AGIs $75k-100k, 13.2% for AGIs $100k-200k, 11.1% for AGIs over 200k)
Charity contributions: $5,956 (reported on 30.7% of returns)
Here:
$5,956
State:
$4,697
(% of AGI for various income ranges: 0.7% for AGIs below $25k, 1.1% for AGIs $25k-50k, 1.3% for AGIs $50k-75k, 2.1% for AGIs $75k-100k, 2.4% for AGIs $100k-200k, 3.0% for AGIs over 200k)
Taxes paid: $9,417 (reported on 36.9% of returns)
46783:
$9,417
State:
$7,456
(% of AGI for various income ranges: 1.0% for AGIs below $25k, 2.3% for AGIs $25k-50k, 2.9% for AGIs $50k-75k, 3.9% for AGIs $75k-100k, 5.2% for AGIs $100k-200k, 5.2% for AGIs over 200k)
Earned income credit: $2,046 (reported on 9.2% of returns)
Here:
$2,046
State:
$2,265
(% of AGI for various income ranges: 4.0% for AGIs below $25k, 0.8% for AGIs $25k-50k)
Percentage of individuals using paid preparers for their 2012 taxes: 55.9%
Here:
56%
State:
53%
(% for various income ranges: 51.6% for AGIs below $25k, 56.4% for AGIs $25k-50k, 56.0% for AGIs $50k-75k, 58.1% for AGIs $75k-100k, 55.3% for AGIs $100k-200k, 75.0% for AGIs over 200k)
Averages for the 2004 tax year for zip code 46783, filed in 2005:
Average Adjusted Gross Income (AGI) in 2004: $78,050 (Individual Income Tax Returns)
Here:
$78,050
State:
$44,790
Salary/wage: $57,765 (reported on 88.3% of returns)
Here:
$57,765
State:
$39,615
(% of AGI for various income ranges: 142.8% for AGIs below $10k, 71.9% for AGIs $10k-25k, 82.7% for AGIs $25k-50k, 87.8% for AGIs $50k-75k, 88.9% for AGIs $75k-100k, 50.3% for AGIs over 100k)
Taxable interest for individuals: $2,062 (reported on 55.7% of returns)
This zip code:
$2,062
Indiana:
$1,535
(% of AGI for various income ranges: 8.4% for AGIs below $10k, 2.9% for AGIs $10k-25k, 1.5% for AGIs $25k-50k, 0.6% for AGIs $50k-75k, 0.6% for AGIs $75k-100k, 1.7% for AGIs over 100k)
Taxable dividends: $3,150 (reported on 30.7% of returns)
Here:
$3,150
State:
$2,998
(% of AGI for various income ranges: 4.4% for AGIs below $10k, 2.0% for AGIs $10k-25k, 0.7% for AGIs $25k-50k, 0.5% for AGIs $50k-75k, 0.7% for AGIs $75k-100k, 1.5% for AGIs over 100k)
Net capital gain/loss: +$12,400 (reported on 23.4% of returns)
Here:
+$12,400
State:
+$8,619
(% of AGI for various income ranges: -1.5% for AGIs below $10k, -0.6% for AGIs $10k-25k, 0.5% for AGIs $25k-50k, 0.3% for AGIs $50k-75k, 1.4% for AGIs $75k-100k, 5.9% for AGIs over 100k)
Profit/loss from business: +$7,426 (reported on 14.2% of returns)
Here:
+$7,426
State:
+$10,071
(% of AGI for various income ranges: 6.9% for AGIs below $10k, 5.0% for AGIs $10k-25k, 2.1% for AGIs $25k-50k, 1.8% for AGIs $50k-75k, 1.2% for AGIs $75k-100k, 0.9% for AGIs over 100k)
IRA payment deduction: $3,046 (reported on 3.2% of returns)
46783:
$3,046
Indiana:
$2,840
(% of AGI for various income ranges: 0.3% for AGIs $10k-25k, 0.3% for AGIs $25k-50k, 0.2% for AGIs $50k-75k, 0.1% for AGIs $75k-100k, 0.0% for AGIs over 100k)
Self-employed pension: $11,900 (reported on 0.7% of returns)
Here:
$11,900
Indiana:
$15,305
Total itemized deductions: $22,398 (15% of AGI, reported on 42.3% of returns)
Here:
$22,398
State:
$17,065
Here:
15.4% of AGI
State:
19.5% of AGI
(% of AGI for various income ranges: 19.3% for AGIs below $10k, 11.4% for AGIs $10k-25k, 10.4% for AGIs $25k-50k, 14.3% for AGIs $50k-75k, 15.7% for AGIs $75k-100k, 11.0% for AGIs over 100k)
Charity contributions deductions: $4,426 (3% of AGI, reported on 36.3% of returns)
Here:
$4,426
State:
$3,550
Here:
2.8% of AGI
State:
3.8% of AGI
(% of AGI for various income ranges: 1.5% for AGIs $10k-25k, 1.2% for AGIs $25k-50k, 2.2% for AGIs $50k-75k, 2.5% for AGIs $75k-100k, 2.1% for AGIs over 100k)
Total tax: $17,207 (reported on 79.2% of returns)
46783:
$17,207
State:
$6,914
(% of AGI for various income ranges: 3.5% for AGIs below $10k, 4.9% for AGIs $10k-25k, 6.8% for AGIs $25k-50k, 8.4% for AGIs $50k-75k, 9.9% for AGIs $75k-100k, 24.1% for AGIs over 100k)
Earned income credit: $1,460 (reported on 6.8% of returns)
Here:
$1,460
State:
$1,685
Percentage of individuals using paid preparers for their 2004 taxes: 55.8%
Here:
56%
State:
59%
(% for various income ranges: 46.1% for AGIs below $10k, 55.3% for AGIs $10k-25k, 55.9% for AGIs $25k-50k, 56.5% for AGIs $50k-75k, 56.7% for AGIs $75k-100k, 69.5% for AGIs over 100k)
Likely homosexual households (counted as self-reported same-sex unmarried-partner households)
Lesbian couples: 0.0% of all households
Gay men: 0.4% of all households
Household received Food Stamps/SNAP in the past 12 months: 43 Household did not receive Food Stamps/SNAP in the past 12 months: 3,038
Women who had a birth in the past 12 months: 66 (60 now married, 9 unmarried) Women who did not have a birth in the past 12 months: 1,604 (941 now married, 667 unmarried)
Housing units in zip code 46783 with a mortgage: 1,948 (195 second mortgage, 17 home equity loan, 149 both second mortgage and home equity loan) Median monthly owner costs for units with a mortgage: $1,536 Median monthly owner costs for units without a mortgage: $497
Residents with income below the poverty level in 2022:
This zip code:
4.5%
Whole state:
12.6%
Residents with income below 50% of the poverty level in 2022:
This zip code:
2.5%
Whole state:
6.3%
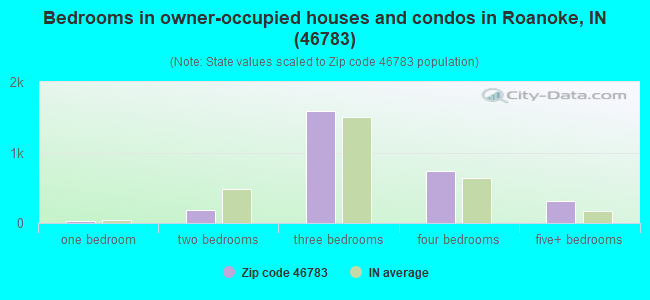
Median number of rooms in houses and condos:
Here:
7.1
State:
6.6
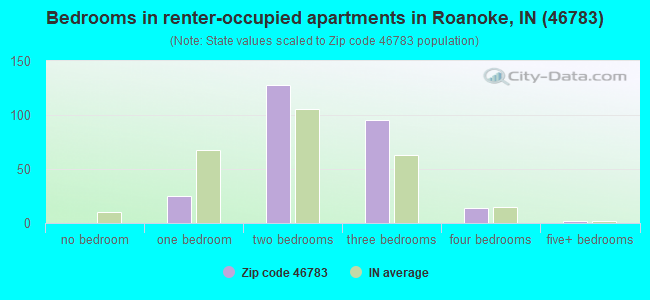
Median number of rooms in apartments:
Here:
4.3
State:
4.3
Notable locations in this zip code not listed on our city pages
In group quarters: 7 (-1 institutionalized population)
Size of family households: 1,305 2-persons, 313 3-persons, 472 4-persons, 183 5-persons, 91 6-persons, 13 7-or-more-persons
Size of nonfamily households: 623 1-person, 65 2-persons, 15 3-persons
1,426 married couples with children.
356 single-parent households (56 men, 300 women).
94.0% of residents of 46783 zip code speak English at home.
4.4% of residents speak Spanish at home (59% very well, 11% well, 29% not well).
1.0% of residents speak other Indo-European language at home (100% very well).
0.5% of residents speak Asian or Pacific Island language at home (100% very well).
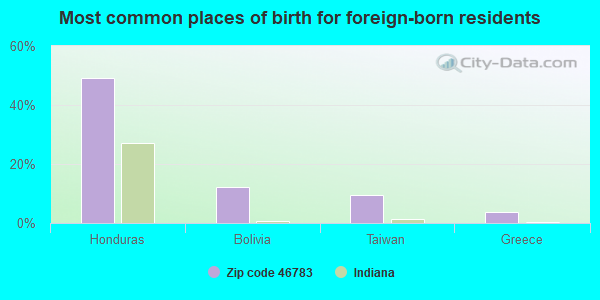
Foreign born population: 136 (1.8%) (23.9% of them are naturalized citizens)
This zip code:
1.8%
Whole state:
6.1%
49%Honduras
12%Bolivia
9%Taiwan
4%Greece
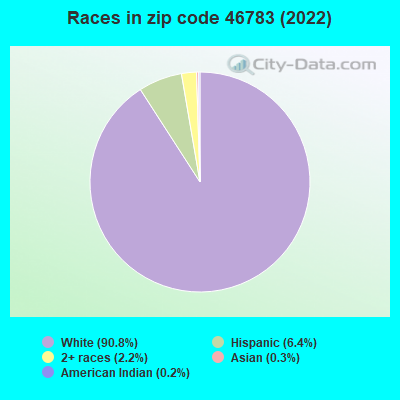
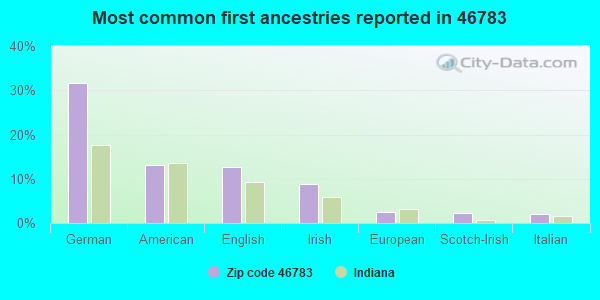
32%German
13%American
13%English
9%Irish
3%European
2%Scotch-Irish
2%Italian
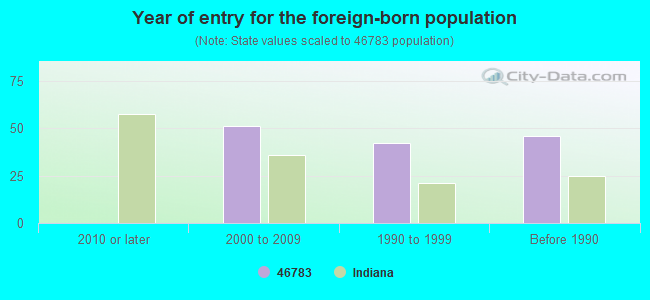
Year of entry for the foreign-born population
02010 or later
512000 to 2009
421990 to 1999
46Before 1990
Facilities with environmental interests located in this zip code:
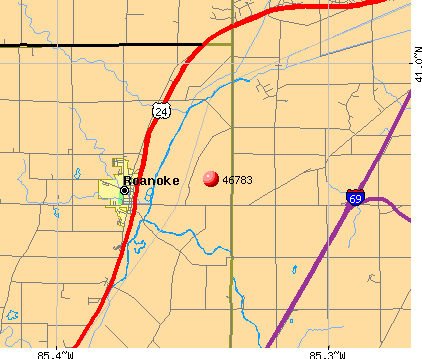
C & M PLATING COMPANY INC (208 S MAIN ST in ROANOKE, IN)
SUPERFUND (Superfund database) (Integrated Compliance Information System) - ICIS-05-1999-0364, FORMAL ENFORCEMENT ACTION, ENFORCEMENT/COMPLIANCE ACTIVITY STATE MASTER (Indiana facility tracking) - UST-19730, UNDERGROUND STORAGE TANK PROGRAM, LUST-199201562, LEAKING STORAGE TANK, LUST-199509536, TSD (Resource Conservation and Recovery Act (tracking hazardous waste)) - notification TARGETED BROWNFIELDS ASSESSMENT (TBA) Business SIC classification: ELECTROPLATING, PLATING, POLISHING, ANODIZING, AND COLORING Organizations: C & M PLATING CO INC (CONTACT/OWNER)
Alternative names: LOT 25
ROANOKE MUNICIPAL WWTP (9101 N HIGHWAY 24 EAST in ROANOKE, IN)
STATE MASTER (Indiana facility tracking) - IN-NPDES-IN0021440, National Pollutant Discharge Elimination System Permit National Pollutant Discharge Elimination System NON-MAJOR (Tracking pollutant discharge elimination systems) - permit (Resource Conservation and Recovery Act (tracking hazardous waste)) Business SIC classification: SEWERAGE SYSTEMS Organizations: JOHN HITZEMAN CERT OPER (CONTACT/OPERATOR)
, ROANOKE TOWN HALL (CONTACT/OWNER)
Alternative names: ROANOKE MUNICIPAL STP, ROANOKE WWTP
ALLIED SYSTEMS (12502 FOGWELL PKWY in ROANOKE, IN)
STATE MASTER (Indiana facility tracking) - CRTK-10236, EPCRA, UST-11306, UNDERGROUND STORAGE TANK PROGRAM Conditionally Exempt Small Quantity Generators, less than 100 kg/month of hazardous waste (Resource Conservation and Recovery Act (tracking hazardous waste)) - notification Organizations: ALLIED HOLDINGS INC (CONTACT/OWNER)
Alternative names: ALLIED AUTOMOTIVE GROUP
ROANOKE ELEMENTARY SCHOOL (423 W VINE ST in ROANOKE, IN)
(Geographic Names Information System) (National Center for Education Statistics) - STATE ID-3029 Organizations: HUNTINGTON CO COM SCH CORP (SCHOOL DISTRICT)
D AND D BODY SHOP (12315 HAMILTON RD in ROANOKE, IN)
STATE MASTER (Indiana facility tracking) Conditionally Exempt Small Quantity Generators, less than 100 kg/month of hazardous waste (Resource Conservation and Recovery Act (tracking hazardous waste)) - notification Organizations: HERNDON DAN (CONTACT/OWNER)
Housing units lacking complete plumbing facilities: 0.6% Housing units lacking complete kitchen facilities: 0.9%
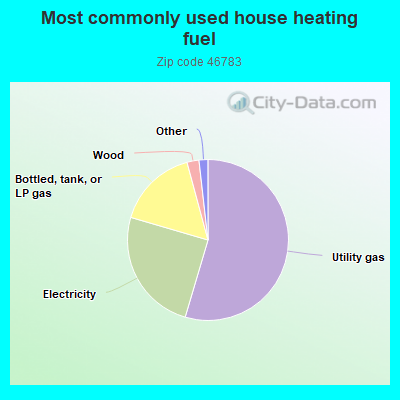
54.7%Utility gas
25.0%Electricity
16.3%Bottled, tank, or LP gas
2.4%Wood
0.6%Fuel oil, kerosene, etc.
0.5%Other fuel
Population in 1990: 4,973. Population change in the 1990s: +3 (+0.1%).
Place of birth for U.S.-born residents:
This state: 5,673
Northeast: 223
Midwest: 1,000
South: 313
West: 175
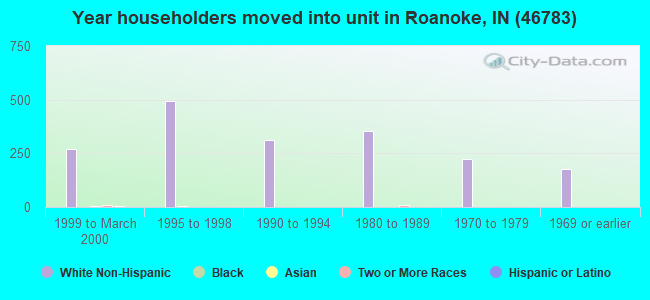
63% of the 46783 zip code residents lived in the same house 5 years ago. Out of people who lived in different houses, 54% lived in this county. Out of people who lived in different counties, 50% lived in Indiana.
91% of the 46783 zip code residents lived in the same house 1 year ago. Out of people who lived in different houses, 57% moved from this county. Out of people who lived in different houses, 37% moved from different county within same state. Out of people who lived in different houses, 5% moved from different state. Out of people who lived in different houses, 2% moved from abroad.
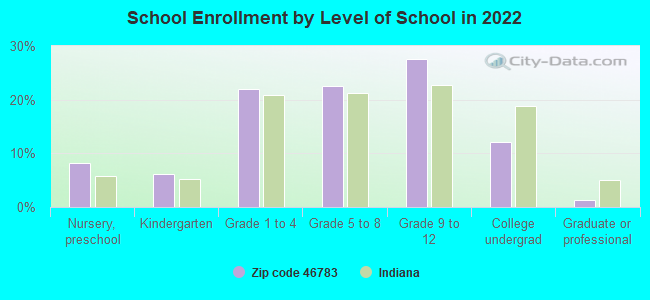
Private vs. public school enrollment:
Students in private schools in grades 1 to 8 (elementary and middle school): 161
Here:
20.7%
Indiana:
14.9%
Students in private schools in grades 9 to 12 (high school): 38
Here:
8.0%
Indiana:
11.4%
Students in private undergraduate colleges: 31
Here:
15.0%
Indiana:
22.3%
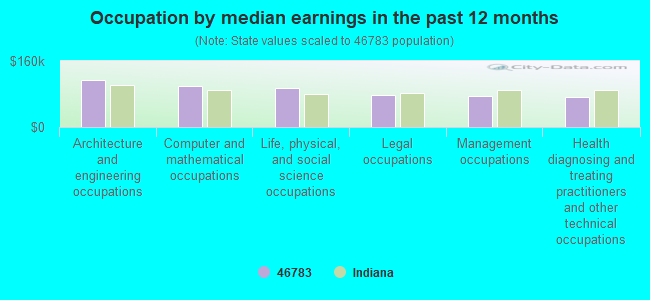
Occupation by median earnings in the past 12 months ($)
114,621Architecture and engineering occupations
98,818Computer and mathematical occupations
95,543Life, physical, and social science occupations
78,670Legal occupations
74,749Management occupations
72,145Health diagnosing and treating practitioners and other technical occupations
Top industries in this zip code by the number of employees in 2005:
Finance and Insurance: Insurance Agencies and Brokerages (100-249 employees: 1 establishment, 50-99 employees: 1 establishment, 1-4 employees: 2 establishments)
Construction: Site Preparation Contractors (20-49: 1, 10-19: 1, 1-4: 4)
Accommodation and Food Services: Limited-Service Restaurants (20-49: 1, 5-9: 2)
Accommodation and Food Services: Full-Service Restaurants (20-49: 1, 5-9: 2)
Construction: Water and Sewer Line and Related Structures Construction (20-49: 1, 5-9: 1)
Information: Data Processing, Hosting, and Related Services (20-49: 1, 1-4: 1)
People in group quarters in 2010:
7 people in group homes intended for adults
People in group quarters in 2000:
14 people in homes for the mentally retarded
Fatal accident statistics in 2014:
Fatal accident count: 2
Vehicles involved in fatal accidents: 3
Fatal accidents caused by drunken drivers: 1
Fatalities: 2
Persons involved in fatal accidents: 3
Pedestrians involved in fatal accidents: 0
Fatal accident statistics in 2012:
Fatal accident count: 2
Vehicles involved in fatal accidents: 4
Fatal accidents caused by drunken drivers: 2
Fatalities: 3
Persons involved in fatal accidents: 9
Pedestrians involved in fatal accidents: 0
Home Mortgage Disclosure Act Aggregated Statistics For Year 2009 (Based on 4 partial tracts)
A) FHA, FSA/RHS & VA Home Purchase Loans
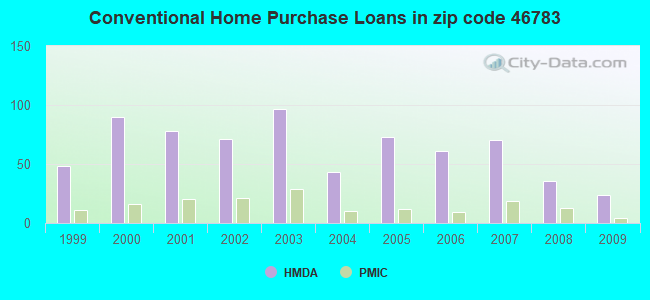
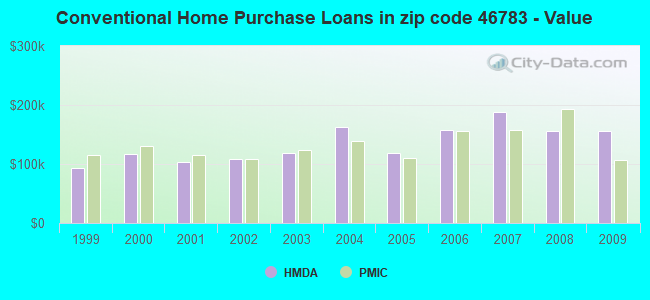
B) Conventional Home Purchase Loans
C) Refinancings
D) Home Improvement Loans
F) Non-occupant Loans on < 5 Family Dwellings (A B C & D)
G) Loans On Manufactured Home Dwelling (A B C & D)
Number
Average Value
Number
Average Value
Number
Average Value
Number
Average Value
Number
Average Value
Number
Average Value
LOANS ORIGINATED
14
$168,221
24
$156,340
156
$168,760
3
$118,643
2
$97,285
1
$124,550
APPLICATIONS APPROVED, NOT ACCEPTED
0
$0
4
$126,820
19
$164,371
0
$0
0
$0
1
$132,520
APPLICATIONS DENIED
2
$221,865
1
$104,620
54
$153,937
8
$32,575
0
$0
4
$25,890
APPLICATIONS WITHDRAWN
0
$0
2
$47,330
27
$147,207
0
$0
1
$115,580
0
$0
FILES CLOSED FOR INCOMPLETENESS
0
$0
0
$0
13
$158,888
0
$0
0
$0
0
$0
Aggregated Statistics For Year 2008 (Based on 4 partial tracts)
A) FHA, FSA/RHS & VA Home Purchase Loans
B) Conventional Home Purchase Loans
C) Refinancings
D) Home Improvement Loans
F) Non-occupant Loans on < 5 Family Dwellings (A B C & D)
G) Loans On Manufactured Home Dwelling (A B C & D)
Number
Average Value
Number
Average Value
Number
Average Value
Number
Average Value
Number
Average Value
Number
Average Value
LOANS ORIGINATED
10
$144,615
36
$155,419
81
$157,234
7
$39,699
2
$59,715
4
$50,620
APPLICATIONS APPROVED, NOT ACCEPTED
0
$0
6
$98,567
9
$158,653
0
$0
2
$215,220
3
$53,750
APPLICATIONS DENIED
3
$170,443
12
$203,172
26
$157,275
5
$32,818
1
$55,800
1
$47,770
APPLICATIONS WITHDRAWN
1
$188,320
4
$125,478
17
$166,001
2
$54,080
1
$121,350
0
$0
FILES CLOSED FOR INCOMPLETENESS
0
$0
0
$0
9
$156,663
0
$0
0
$0
0
$0
Aggregated Statistics For Year 2007 (Based on 4 partial tracts)
A) FHA, FSA/RHS & VA Home Purchase Loans
B) Conventional Home Purchase Loans
C) Refinancings
D) Home Improvement Loans
F) Non-occupant Loans on < 5 Family Dwellings (A B C & D)
G) Loans On Manufactured Home Dwelling (A B C & D)
Number
Average Value
Number
Average Value
Number
Average Value
Number
Average Value
Number
Average Value
Number
Average Value
LOANS ORIGINATED
5
$212,354
70
$188,299
62
$139,177
15
$34,751
2
$96,620
1
$38,210
APPLICATIONS APPROVED, NOT ACCEPTED
0
$0
7
$101,063
10
$109,375
3
$51,943
0
$0
2
$120,065
APPLICATIONS DENIED
3
$167,727
12
$163,329
53
$148,473
5
$19,824
2
$69,445
2
$30,785
APPLICATIONS WITHDRAWN
1
$340,770
4
$152,138
11
$111,995
1
$13,950
1
$176,360
0
$0
FILES CLOSED FOR INCOMPLETENESS
0
$0
1
$341,770
10
$212,926
0
$0
0
$0
0
$0
Aggregated Statistics For Year 2006 (Based on 4 partial tracts)
A) FHA, FSA/RHS & VA Home Purchase Loans
B) Conventional Home Purchase Loans
C) Refinancings
D) Home Improvement Loans
E) Loans on Dwellings For 5+ Families
F) Non-occupant Loans on < 5 Family Dwellings (A B C & D)
G) Loans On Manufactured Home Dwelling (A B C & D)
Number
Average Value
Number
Average Value
Number
Average Value
Number
Average Value
Number
Average Value
Number
Average Value
Number
Average Value
LOANS ORIGINATED
6
$135,092
61
$157,839
79
$141,406
16
$45,414
1
$7,970
4
$121,270
4
$52,762
APPLICATIONS APPROVED, NOT ACCEPTED
0
$0
4
$147,130
11
$121,862
2
$15,255
0
$0
0
$0
1
$9,960
APPLICATIONS DENIED
0
$0
18
$68,254
47
$145,290
6
$17,803
0
$0
4
$68,252
7
$40,853
APPLICATIONS WITHDRAWN
0
$0
4
$114,088
20
$157,978
4
$21,422
0
$0
0
$0
1
$114,590
FILES CLOSED FOR INCOMPLETENESS
0
$0
3
$77,053
9
$217,596
0
$0
0
$0
1
$135,510
0
$0
Aggregated Statistics For Year 2005 (Based on 4 partial tracts)
A) FHA, FSA/RHS & VA Home Purchase Loans
B) Conventional Home Purchase Loans
C) Refinancings
D) Home Improvement Loans
F) Non-occupant Loans on < 5 Family Dwellings (A B C & D)
G) Loans On Manufactured Home Dwelling (A B C & D)
Number
Average Value
Number
Average Value
Number
Average Value
Number
Average Value
Number
Average Value
Number
Average Value
LOANS ORIGINATED
1
$89,910
73
$118,192
88
$119,762
11
$58,686
6
$77,892
5
$44,276
APPLICATIONS APPROVED, NOT ACCEPTED
0
$0
9
$110,690
13
$150,725
1
$150,630
0
$0
3
$49,820
APPLICATIONS DENIED
2
$114,585
12
$75,009
51
$138,020
7
$28,897
1
$125,550
6
$55,667
APPLICATIONS WITHDRAWN
0
$0
5
$86,282
46
$133,883
6
$130,192
2
$63,770
1
$29,890
FILES CLOSED FOR INCOMPLETENESS
1
$112,590
1
$119,160
4
$151,848
0
$0
0
$0
0
$0
Aggregated Statistics For Year 2004 (Based on 4 partial tracts)
A) FHA, FSA/RHS & VA Home Purchase Loans
B) Conventional Home Purchase Loans
C) Refinancings
D) Home Improvement Loans
F) Non-occupant Loans on < 5 Family Dwellings (A B C & D)
G) Loans On Manufactured Home Dwelling (A B C & D)
Number
Average Value
Number
Average Value
Number
Average Value
Number
Average Value
Number
Average Value
Number
Average Value
LOANS ORIGINATED
2
$103,745
43
$163,017
108
$147,833
16
$35,465
2
$82,040
3
$76,853
APPLICATIONS APPROVED, NOT ACCEPTED
0
$0
5
$141,344
12
$87,474
1
$89,410
1
$33,880
2
$50,320
APPLICATIONS DENIED
0
$0
15
$124,773
40
$104,196
10
$29,714
1
$17,940
7
$24,577
APPLICATIONS WITHDRAWN
0
$0
7
$129,176
29
$114,297
1
$15,830
0
$0
1
$115,580
FILES CLOSED FOR INCOMPLETENESS
0
$0
2
$77,630
12
$125,762
1
$84,690
0
$0
0
$0
Aggregated Statistics For Year 2003 (Based on 8 partial tracts)
A) FHA, FSA/RHS & VA Home Purchase Loans
B) Conventional Home Purchase Loans
C) Refinancings
D) Home Improvement Loans
F) Non-occupant Loans on < 5 Family Dwellings (A B C & D)
Number
Average Value
Number
Average Value
Number
Average Value
Number
Average Value
Number
Average Value
LOANS ORIGINATED
12
$106,998
97
$119,305
473
$127,758
18
$35,502
8
$52,860
APPLICATIONS APPROVED, NOT ACCEPTED
0
$0
8
$91,045
52
$107,487
8
$37,195
1
$45,830
APPLICATIONS DENIED
2
$103,530
18
$112,242
104
$114,544
12
$27,620
3
$78,443
APPLICATIONS WITHDRAWN
0
$0
12
$115,860
64
$117,164
1
$11,680
2
$109,765
FILES CLOSED FOR INCOMPLETENESS
0
$0
3
$90,830
15
$173,077
2
$23,095
1
$69,750
Aggregated Statistics For Year 2002 (Based on 6 partial tracts)
A) FHA, FSA/RHS & VA Home Purchase Loans
B) Conventional Home Purchase Loans
C) Refinancings
D) Home Improvement Loans
F) Non-occupant Loans on < 5 Family Dwellings (A B C & D)
Number
Average Value
Number
Average Value
Number
Average Value
Number
Average Value
Number
Average Value
LOANS ORIGINATED
16
$68,791
71
$108,679
308
$126,517
18
$36,389
12
$76,177
APPLICATIONS APPROVED, NOT ACCEPTED
3
$76,537
5
$71,932
40
$88,126
6
$18,268
1
$19,930
APPLICATIONS DENIED
0
$0
9
$45,847
84
$102,253
7
$33,490
2
$27,325
APPLICATIONS WITHDRAWN
1
$82,700
3
$117,703
30
$90,571
3
$60,403
0
$0
FILES CLOSED FOR INCOMPLETENESS
1
$106,610
2
$107,570
27
$109,105
1
$25,820
0
$0
Aggregated Statistics For Year 2001 (Based on 6 partial tracts)
A) FHA, FSA/RHS & VA Home Purchase Loans
B) Conventional Home Purchase Loans
C) Refinancings
D) Home Improvement Loans
F) Non-occupant Loans on < 5 Family Dwellings (A B C & D)
Number
Average Value
Number
Average Value
Number
Average Value
Number
Average Value
Number
Average Value
LOANS ORIGINATED
11
$91,395
78
$102,988
256
$113,366
20
$23,334
9
$73,882
APPLICATIONS APPROVED, NOT ACCEPTED
3
$90,353
15
$63,683
38
$83,006
5
$12,094
1
$55,940
APPLICATIONS DENIED
0
$0
38
$45,797
88
$106,430
16
$11,765
4
$148,000
APPLICATIONS WITHDRAWN
0
$0
4
$102,140
31
$94,984
4
$24,332
1
$34,870
FILES CLOSED FOR INCOMPLETENESS
0
$0
1
$68,920
7
$100,176
0
$0
0
$0
Aggregated Statistics For Year 2000 (Based on 6 partial tracts)
A) FHA, FSA/RHS & VA Home Purchase Loans
B) Conventional Home Purchase Loans
C) Refinancings
D) Home Improvement Loans
F) Non-occupant Loans on < 5 Family Dwellings (A B C & D)
Number
Average Value
Number
Average Value
Number
Average Value
Number
Average Value
Number
Average Value
LOANS ORIGINATED
12
$85,267
90
$116,711
98
$77,819
33
$17,281
3
$52,417
APPLICATIONS APPROVED, NOT ACCEPTED
0
$0
14
$67,680
16
$73,366
6
$21,013
1
$54,800
APPLICATIONS DENIED
1
$46,580
29
$47,994
53
$78,394
18
$15,861
2
$46,210
APPLICATIONS WITHDRAWN
0
$0
6
$81,282
15
$87,559
3
$23,763
0
$0
FILES CLOSED FOR INCOMPLETENESS
0
$0
0
$0
3
$132,047
0
$0
0
$0
Aggregated Statistics For Year 1999 (Based on 3 partial tracts)
A) FHA, FSA/RHS & VA Home Purchase Loans
B) Conventional Home Purchase Loans
C) Refinancings
D) Home Improvement Loans
F) Non-occupant Loans on < 5 Family Dwellings (A B C & D)
2002 - 2018 National Fire Incident Reporting System (NFIRS) incidents
Based on the data from the years 2002 - 2018 the average number of fires per year is 27. The highest number of reported fire incidents - 49 took place in 2008, and the least - 2 in 2016. The data has a dropping trend.
When looking into fire subcategories, the most incidents belonged to: Outside Fires (40.1%), and Structure Fires (39.4%).
Fire incident types reported to NFIRS in Zip Code 46783


 Nearest zip codes: 46799, 46814, 46770, 46804, 46798, 46704.
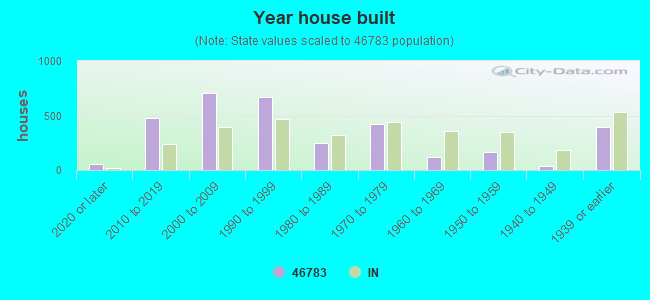


 Based on the data from the years 2002 - 2018 the average number of fires per year is 27. The highest number of reported fire incidents - 49 took place in 2008, and the least - 2 in 2016. The data has a dropping trend.
 When looking into fire subcategories, the most incidents belonged to: Outside Fires (40.1%), and Structure Fires (39.4%).