Estimated zip code population in 2022: 2,840 Zip code population in 2010: 2,716 Zip code population in 2000: 2,543
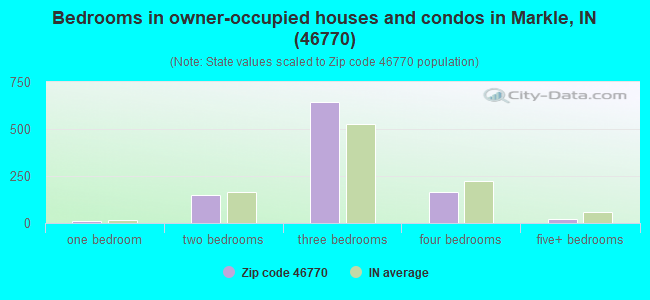
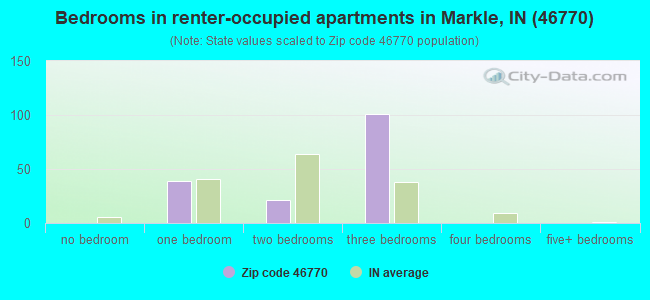
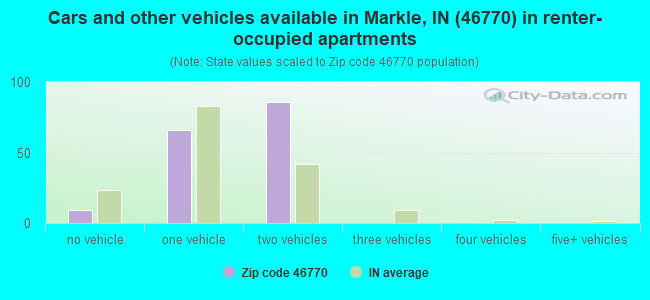
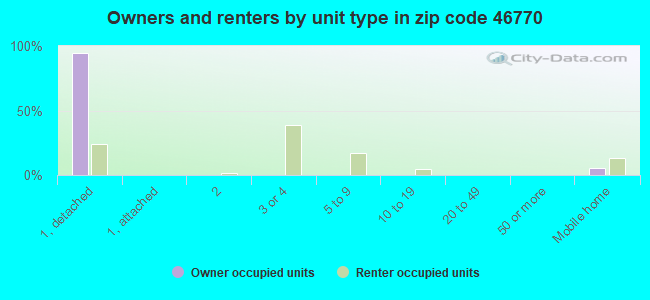
Houses and condos: 1,167 Renter-occupied apartments: 161
% of renters here:
14%
State:
29%
March 2022 cost of living index in zip code 46770: 85.0 (less than average, U.S. average is 100)
Land area: 52.8 sq. mi. Water area: 0.6 sq. mi.
Population density: 54 people per square mile
(very low).
OSM Map
General Map
Google Map
MSN Map
OSM Map
General Map
Google Map
MSN Map
OSM Map
General Map
Google Map
MSN Map
OSM Map
General Map
Google Map
MSN Map
Please wait while loading the map...
Real estate property taxes paid for housing units in 2022:
This zip code:
0.5% ($998)
Indiana:
0.7% ($1,467)
Median real estate property taxes paid for housing units with mortgages in 2022: $1,131 (0.6%) Median real estate property taxes paid for housing units with no mortgage in 2022: $891 (0.6%)
Business Search- 14 Million verified businesses
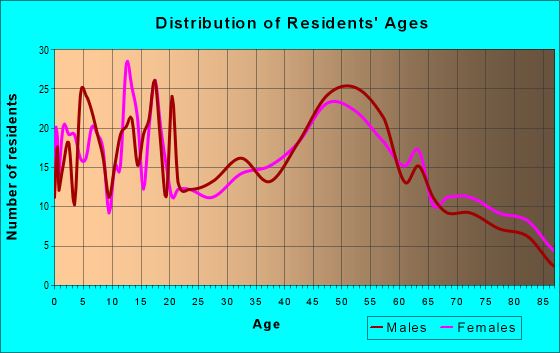
Males: 1,443
(50.8%)
Females: 1,397
(49.2%)
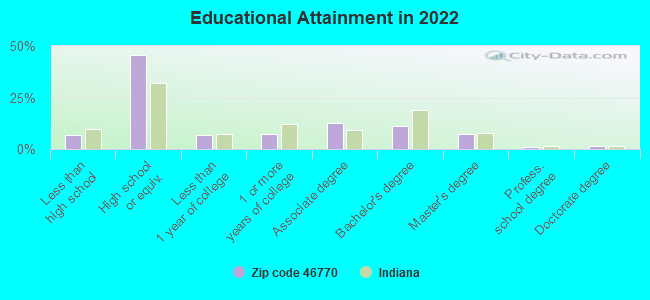
For population 25 years and over in 46770:
High school or higher: 92.4%
Bachelor's degree or higher: 20.5%
Graduate or professional degree: 9.6%
Unemployed: 3.3%
Mean travel time to work (commute): 24.3 minutes
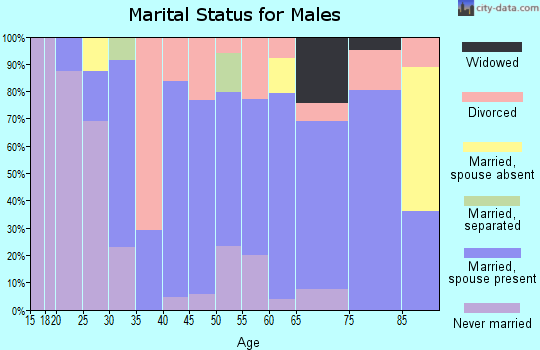
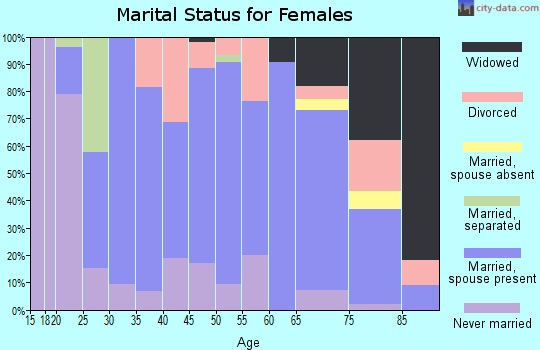
For population 15 years and over in 46770:
Never married: 19.7%
Now married: 59.0%
Separated: 1.0%
Widowed: 7.4%
Divorced: 12.9%
Zip code 46770 compared to state average:
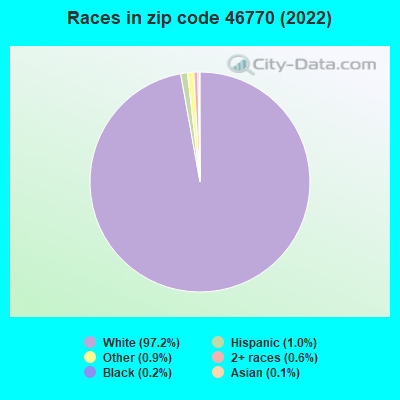
Black race population percentage significantly below state average.
Hispanic race population percentage significantly below state average.
Median age significantly above state average.
Foreign-born population percentage significantly below state average.
Renting percentage below state average.
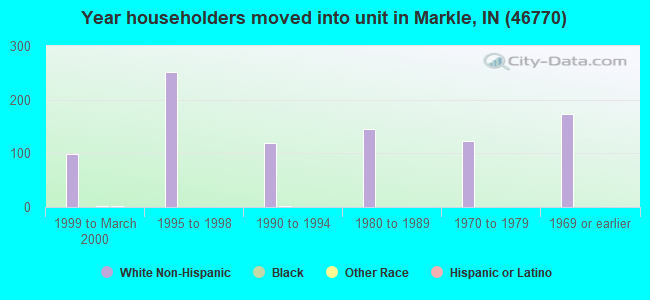
Length of stay since moving in significantly above state average.
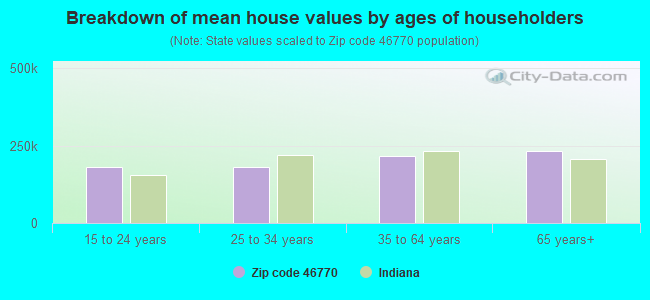
Estimated median house/condo value in 2022: $184,374
46770:
$184,374
Indiana:
$208,700
Median resident age:
This zip code:
46.5 years
Indiana median age:
38.2 years
Average household size:
This zip code:
2.3 people
Indiana:
2.4 people
Averages for the 2020 tax year for zip code 46770, filed in 2021:
Average Adjusted Gross Income (AGI) in 2020: $63,777 (Individual Income Tax Returns)
Here:
$63,777
State:
$64,978
Salary/wage: $55,967 (reported on 80.2% of returns)
Here:
$55,967
State:
$55,245
(% of AGI for various income ranges: 1000.0% for AGIs below $25k, 3470.4% for AGIs $25k-50k, 6633.1% for AGIs $50k-75k, 9554.2% for AGIs $75k-100k, 14935.7% for AGIs $100k-200k)
Taxable interest for individuals: $744 (reported on 32.8% of returns)
This zip code:
$744
Indiana:
$1,351
(% of AGI for various income ranges: 15.4% for AGIs below $25k, 17.0% for AGIs $25k-50k, 50.0% for AGIs $50k-75k, 35.0% for AGIs $75k-100k, 57.9% for AGIs $100k-200k)
Ordinary dividends: $4,926 (reported on 23.7% of returns)
Here:
$4,926
State:
$5,827
(% of AGI for various income ranges: 17.3% for AGIs below $25k, 52.2% for AGIs $25k-50k, 82.5% for AGIs $50k-75k, 116.7% for AGIs $75k-100k, 379.3% for AGIs $100k-200k)
Net capital gain/loss in AGI: +$7,938 (reported on 19.8% of returns)
Here:
+$7,938
State:
+$17,730
(% of AGI for various income ranges: 66.5% for AGIs $25k-50k, 65.0% for AGIs $50k-75k, 149.2% for AGIs $75k-100k, 472.9% for AGIs $100k-200k)
Profit/loss from business: +$15,973 (reported on 11.5% of returns)
Here:
+$15,973
State:
+$12,144
(% of AGI for various income ranges: 142.3% for AGIs below $25k, 93.1% for AGIs $50k-75k, 217.5% for AGIs $75k-100k, 1154.3% for AGIs $100k-200k)
Taxable individual retirement arrangement distribution: $14,119 (reported on 12.2% of returns)
46770:
$14,119
Indiana:
$18,302
(% of AGI for various income ranges: 96.9% for AGIs below $25k, 108.7% for AGIs $25k-50k, 182.5% for AGIs $50k-75k, 448.3% for AGIs $75k-100k, 662.1% for AGIs $100k-200k)
Total itemized deductions: $37,120 (reported on 3.8% of returns)
Here:
$37,120
State:
$35,601
(% of AGI for various income ranges: 1325.7% for AGIs $100k-200k)
Charity contributions: $20,625 (reported on 3.1% of returns)
Here:
$20,625
State:
$15,596
(% of AGI for various income ranges: 589.3% for AGIs $100k-200k)
Taxes paid: $7,640 (reported on 3.8% of returns)
46770:
$7,640
State:
$7,542
(% of AGI for various income ranges: 47.0% for AGIs $25k-50k, 195.7% for AGIs $100k-200k)
Earned income credit: $2,323 (reported on 9.9% of returns)
Here:
$2,323
State:
$2,298
(% of AGI for various income ranges: 65.0% for AGIs below $25k, 57.8% for AGIs $25k-50k)
Percentage of individuals using paid preparers for their 2020 taxes: 96.2%
Here:
96%
State:
94%
(% for various income ranges: 97.4% for AGIs below $25k, 96.4% for AGIs $25k-50k, 95.5% for AGIs $50k-75k, 94.1% for AGIs $75k-100k, 95.2% for AGIs $100k-200k, 100.0% for AGIs over 200k)
Averages for the 2012 tax year for zip code 46770, filed in 2013:
Average Adjusted Gross Income (AGI) in 2012: $53,684 (Individual Income Tax Returns)
Here:
$53,684
State:
$52,932
Salary/wage: $45,495 (reported on 84.9% of returns)
Here:
$45,495
State:
$45,173
(% of AGI for various income ranges: 67.0% for AGIs below $25k, 77.9% for AGIs $25k-50k, 77.2% for AGIs $50k-75k, 78.5% for AGIs $75k-100k, 76.9% for AGIs $100k-200k, 46.0% for AGIs over 200k)
Taxable interest for individuals: $929 (reported on 35.7% of returns)
This zip code:
$929
Indiana:
$1,311
(% of AGI for various income ranges: 2.5% for AGIs below $25k, 0.6% for AGIs $25k-50k, 0.5% for AGIs $50k-75k, 0.3% for AGIs $75k-100k, 0.4% for AGIs $100k-200k, 0.5% for AGIs over 200k)
Ordinary dividends: $3,193 (reported on 23.8% of returns)
Here:
$3,193
State:
$4,690
(% of AGI for various income ranges: 1.9% for AGIs below $25k, 1.3% for AGIs $25k-50k, 1.0% for AGIs $50k-75k, 1.1% for AGIs $75k-100k, 2.9% for AGIs $100k-200k)
Net capital gain/loss in AGI: +$1,852 (reported on 16.7% of returns)
Here:
+$1,852
State:
+$10,406
(% of AGI for various income ranges: 0.2% for AGIs $50k-75k, 0.1% for AGIs $75k-100k, 2.3% for AGIs $100k-200k)
Profit/loss from business: +$7,341 (reported on 13.5% of returns)
Here:
+$7,341
State:
+$11,105
(% of AGI for various income ranges: 3.6% for AGIs below $25k, 1.5% for AGIs $25k-50k, 2.8% for AGIs $50k-75k, 2.6% for AGIs $75k-100k, 1.3% for AGIs $100k-200k)
Taxable individual retirement arrangement distribution: $10,587 (reported on 11.9% of returns)
46770:
$10,587
Indiana:
$13,841
(% of AGI for various income ranges: 4.5% for AGIs below $25k, 2.1% for AGIs $25k-50k, 2.5% for AGIs $50k-75k, 6.6% for AGIs $75k-100k)
Total itemized deductions: $18,753 (19% of AGI, reported on 30.2% of returns)
Here:
$18,753
State:
$20,913
Here:
19.0% of AGI
State:
18.2% of AGI
(% of AGI for various income ranges: 8.7% for AGIs below $25k, 7.1% for AGIs $25k-50k, 10.1% for AGIs $50k-75k, 11.8% for AGIs $75k-100k, 13.2% for AGIs $100k-200k, 10.2% for AGIs over 200k)
Charity contributions: $5,314 (reported on 22.2% of returns)
Here:
$5,314
State:
$4,697
(% of AGI for various income ranges: 1.3% for AGIs $25k-50k, 2.0% for AGIs $50k-75k, 1.9% for AGIs $75k-100k, 3.8% for AGIs $100k-200k, 2.3% for AGIs over 200k)
Taxes paid: $6,921 (reported on 30.2% of returns)
46770:
$6,921
State:
$7,456
(% of AGI for various income ranges: 1.3% for AGIs below $25k, 1.6% for AGIs $25k-50k, 3.0% for AGIs $50k-75k, 4.2% for AGIs $75k-100k, 5.5% for AGIs $100k-200k, 6.0% for AGIs over 200k)
Earned income credit: $1,992 (reported on 10.3% of returns)
Here:
$1,992
State:
$2,265
(% of AGI for various income ranges: 3.4% for AGIs below $25k, 0.8% for AGIs $25k-50k)
Percentage of individuals using paid preparers for their 2012 taxes: 59.5%
Here:
60%
State:
53%
(% for various income ranges: 51.1% for AGIs below $25k, 60.0% for AGIs $25k-50k, 68.2% for AGIs $50k-75k, 64.3% for AGIs $75k-100k, 66.7% for AGIs $100k-200k, 66.7% for AGIs over 200k)
Averages for the 2004 tax year for zip code 46770, filed in 2005:
Average Adjusted Gross Income (AGI) in 2004: $45,207 (Individual Income Tax Returns)
Here:
$45,207
State:
$44,790
Salary/wage: $41,543 (reported on 85.2% of returns)
Here:
$41,543
State:
$39,615
(% of AGI for various income ranges: 78.8% for AGIs below $10k, 69.0% for AGIs $10k-25k, 79.9% for AGIs $25k-50k, 86.9% for AGIs $50k-75k, 83.0% for AGIs $75k-100k, 68.9% for AGIs over 100k)
Taxable interest for individuals: $1,148 (reported on 51.0% of returns)
This zip code:
$1,148
Indiana:
$1,535
(% of AGI for various income ranges: 3.5% for AGIs below $10k, 4.6% for AGIs $10k-25k, 1.0% for AGIs $25k-50k, 0.9% for AGIs $50k-75k, 1.4% for AGIs $75k-100k, 0.8% for AGIs over 100k)
Taxable dividends: $2,623 (reported on 25.3% of returns)
Here:
$2,623
State:
$2,998
(% of AGI for various income ranges: 2.0% for AGIs below $10k, 2.4% for AGIs $10k-25k, 1.5% for AGIs $25k-50k, 0.4% for AGIs $50k-75k, 1.4% for AGIs $75k-100k, 2.1% for AGIs over 100k)
Net capital gain/loss: +$5,302 (reported on 17.3% of returns)
Here:
+$5,302
State:
+$8,619
(% of AGI for various income ranges: 2.4% for AGIs $10k-25k, 0.4% for AGIs $25k-50k, 0.3% for AGIs $50k-75k, 1.9% for AGIs $75k-100k, 5.1% for AGIs over 100k)
Profit/loss from business: +$4,906 (reported on 15.3% of returns)
Here:
+$4,906
State:
+$10,071
(% of AGI for various income ranges: 3.5% for AGIs below $10k, 1.8% for AGIs $10k-25k, 3.8% for AGIs $25k-50k, 0.6% for AGIs $50k-75k, 0.4% for AGIs $75k-100k, 1.5% for AGIs over 100k)
Profit/loss from farming: +$2,651 (reported on 3.9% of returns)
Here:
+$2,651
State:
-$2,212
IRA payment deduction: $2,756 (reported on 3.7% of returns)
46770:
$2,756
Indiana:
$2,840
Total itemized deductions: $17,311 (23% of AGI, reported on 34.2% of returns)
Here:
$17,311
State:
$17,065
Here:
23.0% of AGI
State:
19.5% of AGI
(% of AGI for various income ranges: 16.0% for AGIs $10k-25k, 10.2% for AGIs $25k-50k, 11.6% for AGIs $50k-75k, 14.6% for AGIs $75k-100k, 16.0% for AGIs over 100k)
Charity contributions deductions: $4,771 (6% of AGI, reported on 28.3% of returns)
Here:
$4,771
State:
$3,550
Here:
6.0% of AGI
State:
3.8% of AGI
(% of AGI for various income ranges: 2.7% for AGIs $10k-25k, 1.8% for AGIs $25k-50k, 2.0% for AGIs $50k-75k, 3.0% for AGIs $75k-100k, 5.1% for AGIs over 100k)
Total tax: $5,564 (reported on 79.1% of returns)
46770:
$5,564
State:
$6,914
(% of AGI for various income ranges: 2.2% for AGIs below $10k, 4.2% for AGIs $10k-25k, 7.0% for AGIs $25k-50k, 7.9% for AGIs $50k-75k, 10.1% for AGIs $75k-100k, 15.6% for AGIs over 100k)
Earned income credit: $1,430 (reported on 8.4% of returns)
Here:
$1,430
State:
$1,685
Percentage of individuals using paid preparers for their 2004 taxes: 62.2%
Here:
62%
State:
59%
(% for various income ranges: 47.9% for AGIs below $10k, 63.3% for AGIs $10k-25k, 64.9% for AGIs $25k-50k, 65.2% for AGIs $50k-75k, 74.7% for AGIs $75k-100k, 61.4% for AGIs over 100k)
Household received Food Stamps/SNAP in the past 12 months: 37 Household did not receive Food Stamps/SNAP in the past 12 months: 1,104
Women who had a birth in the past 12 months: 27 (29 now married, 0 unmarried) Women who did not have a birth in the past 12 months: 507 (250 now married, 257 unmarried)
Housing units in zip code 46770 with a mortgage: 591 (90 second mortgage, 85 both second mortgage and home equity loan) Houses without a mortgage: 56
Median monthly owner costs for units with a mortgage: $1,251 Median monthly owner costs for units without a mortgage: $434
Residents with income below the poverty level in 2022:
This zip code:
9.4%
Whole state:
12.6%
Residents with income below 50% of the poverty level in 2022:
This zip code:
2.9%
Whole state:
6.3%
Median number of rooms in houses and condos:
Here:
6.8
State:
6.6
Median number of rooms in apartments:
Here:
4.8
State:
4.3
Notable locations in this zip code not listed on our city pages
In group quarters: 153 (-1 institutionalized population)
Size of family households: 445 2-persons, 202 3-persons, 57 4-persons, 72 5-persons, 32 6-persons, 11 7-or-more-persons
Size of nonfamily households: 289 1-person, 36 2-persons
461 married couples with children.
109 single-parent households (34 men, 75 women).
98.5% of residents of 46770 zip code speak English at home.
0.9% of residents speak Spanish at home (100% very well).
0.2% of residents speak other Indo-European language at home (100% very well).
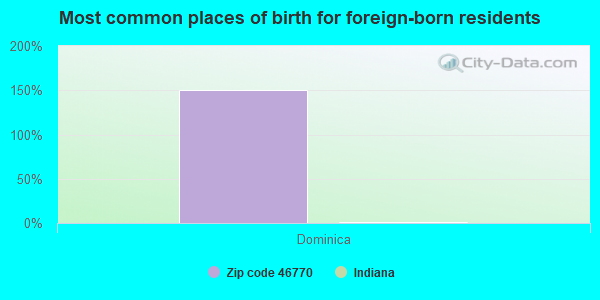
Foreign born population: 4 (0.2%) (100.0% of them are naturalized citizens)
This zip code:
0.2%
Whole state:
6.1%
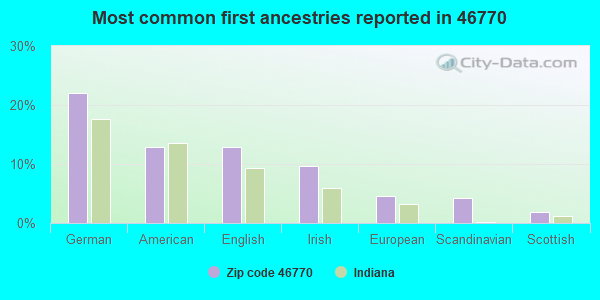
150%Dominica
22%German
13%American
13%English
10%Irish
5%European
4%Scandinavian
2%Scottish
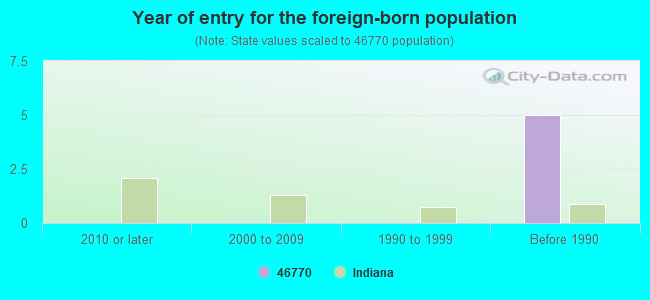
Year of entry for the foreign-born population
02010 or later
02000 to 2009
01990 to 1999
5Before 1990
Facilities with environmental interests located in this zip code:
MARKLE SEWAGE UTILITY (305 W MORSE STREET in MARKLE, IN)
STATE MASTER (Indiana facility tracking) - CRTK-7747, EPCRA National Pollutant Discharge Elimination System NON-MAJOR (Tracking pollutant discharge elimination systems) - permit - ICIS-, ENFORCEMENT/COMPLIANCE ACTIVITY Business SIC classification: SEWERAGE SYSTEMS Organizations: SCOTT SPAHR 14315 (CONTACT/OPERATOR)
, TOWN COUNCIL PRESIDENT (CONTACT/OWNER)
Alternative names: MARKLE MUNICIPAL STP, MARKLE MUNICIPAL WWTP
ALL SEASON INDUSTRIES INC (180 LOGAN ST in MARKLE, IN)
STATE MASTER (Indiana facility tracking) - CRTK-3806, EPCRA National Pollutant Discharge Elimination System NON-MAJOR (Tracking pollutant discharge elimination systems) - permit (Resource Conservation and Recovery Act (tracking hazardous waste)) TRI REPORTER (Tracking of toxic chemicals releasing facilities) Business SIC classification: BOAT BUILDING AND REPAIRING Alternative names: ALL SEASON INDSTRS
DENNIS GOONEN & DR JAMES RADTA PROPERTY (I69 AND US 224 in MARKLE, IN)
STATE MASTER (Indiana facility tracking) - UST-13131, UNDERGROUND STORAGE TANK PROGRAM (Resource Conservation and Recovery Act (tracking hazardous waste)) Alternative names: SUNOCO SERVICE STATION
NOVAE CORPORATION (1 NOVAE PKWY in MARKLE, IN)
National Pollutant Discharge Elimination System NON-MAJOR (Tracking pollutant discharge elimination systems) - permit Small Quantity Generators, between 100 kg and 1000 kg of hazardous waste/month (Resource Conservation and Recovery Act (tracking hazardous waste)) Business SIC classification: MISCELLANEOUS STRUCTURAL METALWORK Organizations: CERTIFIED OPERATOR (CONTACT/OPERATOR)
, NOVAE BUILDING (CONTACT/OWNER)
Alternative names: NOVAE BUILDING
DAYTON FREIGHT (100 NOVAE PKWY in MARKLE, IN)
Small Quantity Generators, between 100 kg and 1000 kg of hazardous waste/month (Resource Conservation and Recovery Act (tracking hazardous waste)) Organizations: DAYTON FREIGHT LINES (CONTACT/OPERATOR)
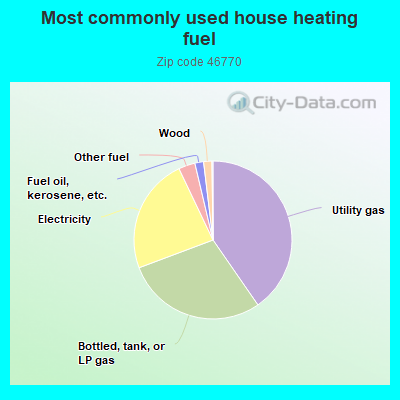
40.5%Utility gas
29.0%Bottled, tank, or LP gas
23.7%Electricity
3.4%Other fuel
1.8%Fuel oil, kerosene, etc.
1.7%Wood
Population in 1990: 3,084.
Place of birth for U.S.-born residents:
This state: 2,359
Northeast: 35
Midwest: 236
South: 121
West: 61
62% of the 46770 zip code residents lived in the same house 5 years ago. Out of people who lived in different houses, 37% lived in this county. Out of people who lived in different counties, 50% lived in Indiana.
89% of the 46770 zip code residents lived in the same house 1 year ago. Out of people who lived in different houses, 49% moved from this county. Out of people who lived in different houses, 44% moved from different county within same state. Out of people who lived in different houses, 4% moved from different state. Out of people who lived in different houses, 1% moved from abroad.
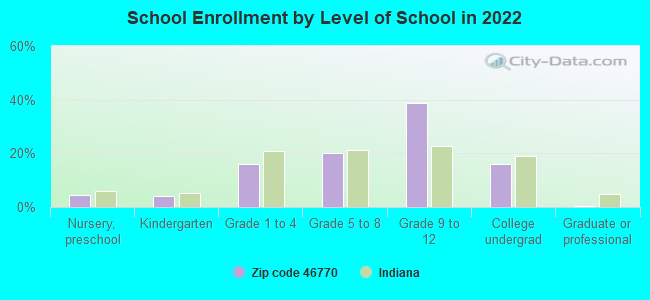
Private vs. public school enrollment:
Students in private schools in grades 1 to 8 (elementary and middle school): 22
Here:
13.1%
Indiana:
14.9%
Students in private schools in grades 9 to 12 (high school): 3
Here:
2.1%
Indiana:
11.4%
Students in private undergraduate colleges: 11
Here:
15.4%
Indiana:
22.3%
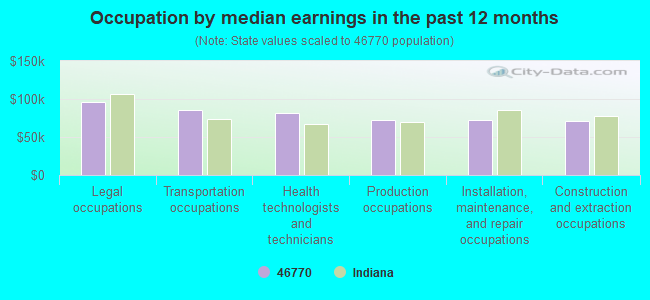
Occupation by median earnings in the past 12 months ($)
96,028Legal occupations
85,636Transportation occupations
81,965Health technologists and technicians
72,857Production occupations
71,758Installation, maintenance, and repair occupations
71,446Construction and extraction occupations
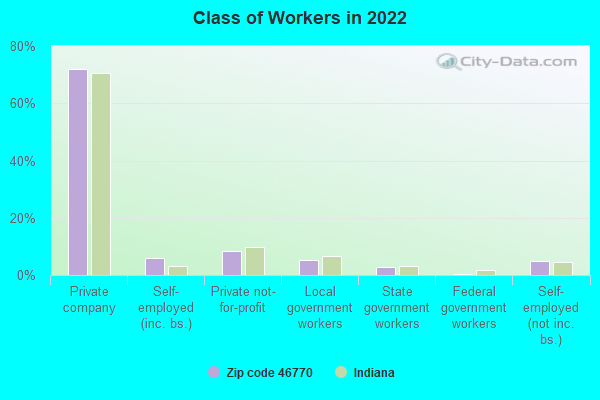
Top industries in this zip code by the number of employees in 2005:
Finance and Insurance: Commercial Banking (20-49: 1)
Construction: Structural Steel and Precast Concrete Contractors (20-49: 1)
Other Services (except Public Administration): Religious Organizations (10-19: 1, 5-9: 1, 1-4: 1)
Health Care and Social Assistance: Offices of Physicians (except Mental Health Specialists) (10-19: 1, 1-4: 2)
People in group quarters in 2010:
76 people in nursing facilities/skilled-nursing facilities
People in group quarters in 2000:
50 people in nursing homes
Fatal accident statistics in 2014:
Fatal accident count: 1
Vehicles involved in fatal accidents: 1
Fatal accidents caused by drunken drivers: 1
Fatalities: 2
Persons involved in fatal accidents: 4
Pedestrians involved in fatal accidents: 0
Fatal accident statistics in 2013:
Fatal accident count: 2
Vehicles involved in fatal accidents: 5
Fatal accidents caused by drunken drivers: 0
Fatalities: 2
Persons involved in fatal accidents: 3
Pedestrians involved in fatal accidents: 2
2002 - 2018 National Fire Incident Reporting System (NFIRS) incidents
Based on the data from the years 2002 - 2018 the average number of fires per year is 19. The highest number of reported fire incidents - 33 took place in 2010, and the least - 1 in 2014. The data has a growing trend.
When looking into fire subcategories, the most incidents belonged to: Structure Fires (37.1%), and Outside Fires (31.2%).
Fire incident types reported to NFIRS in Zip Code 46770


+$2,651
-$2,212
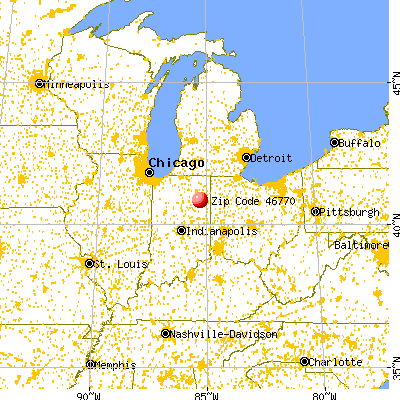
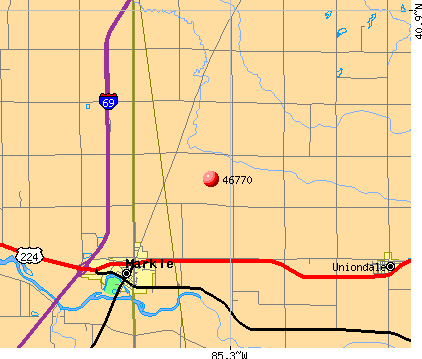 Nearest zip codes: 46799, 46791, 46766, 46783, 46798, 46750.
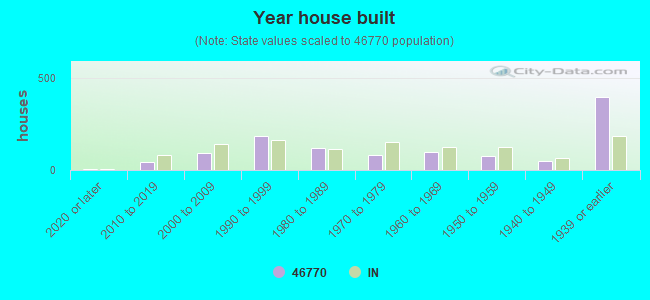


 Based on the data from the years 2002 - 2018 the average number of fires per year is 19. The highest number of reported fire incidents - 33 took place in 2010, and the least - 1 in 2014. The data has a growing trend.
 When looking into fire subcategories, the most incidents belonged to: Structure Fires (37.1%), and Outside Fires (31.2%).