Estimated zip code population in 2022: 16,148
Zip code population in 2010: 16,072
Zip code population in 2000: 17,337
Houses and condos: 7,099
Renter-occupied apartments: 2,484
% of renters here:
40%State:
29%
March 2022 cost of living index in zip code 46807: 82.6
(low, U.S. average is 100)
Land area: 3.2
sq. mi.
Water area: 0.0
sq. mi.
Population density: 5,033 people per square mile (average).
OSM Map
General Map
Google Map
MSN Map
OSM Map
General Map
Google Map
MSN Map
OSM Map
General Map
Google Map
MSN Map
OSM Map
General Map
Google Map
MSN Map
Please wait while loading the map...
Real estate property taxes paid for housing units in 2022:
This zip code:
0.7% ($1,017)Indiana:
0.7% ($1,467)
Median real estate property taxes paid for housing units with mortgages in 2022: $1,127 (0.8%)
Median real estate property taxes paid for housing units with no mortgage in 2022: $794 (0.7%)
Profiles of local businesses
Business Search - 14 Million verified businesses
Males: 7,813 Females: 8,335
For population 25 years and over in 46807:
High school or higher: 91.0%Bachelor's degree or higher: 32.8%Graduate or professional degree: 9.3%Unemployed: 5.4%Mean travel time to work (commute): 21.7 minutes
For population 15 years and over in 46807:
Never married: 41.8%Now married: 40.3%Separated: 2.6%Widowed: 4.5%Divorced: 10.7%
Zip code 46807 compared to state average:
Median house value below state average. Hispanic race population percentage above state average. Median age below state average. Length of stay since moving in significantly above state average. House age above state average. 8,872 55.0% White 2,936 18.2% Hispanic or Latino 1,962 12.2% Black 1,821 11.3% Two or more races 522 3.2% Asian 23 0.1% Some other race 9 0.06% American Indian
Data:
Median household income ($)
Median household income (% change since 2000)
Household income diversity
Ratio of average income to average house value (%)
Ratio of average income to average rent
Median household income ($) - White
Median household income ($) - Black or African American
Median household income ($) - Asian
Median household income ($) - Hispanic or Latino
Median household income ($) - American Indian and Alaska Native
Median household income ($) - Multirace
Median household income ($) - Other Race
Median household income for houses/condos with a mortgage ($)
Median household income for apartments without a mortgage ($)
Races - White alone (%)
Races - White alone (% change since 2000)
Races - Black alone (%)
Races - Black alone (% change since 2000)
Races - American Indian alone (%)
Races - American Indian alone (% change since 2000)
Races - Asian alone (%)
Races - Asian alone (% change since 2000)
Races - Hispanic (%)
Races - Hispanic (% change since 2000)
Races - Native Hawaiian and Other Pacific Islander alone (%)
Races - Native Hawaiian and Other Pacific Islander alone (% change since 2000)
Races - Two or more races (%)
Races - Two or more races (% change since 2000)
Races - Other race alone (%)
Races - Other race alone (% change since 2000)
Racial diversity
Unemployment (%)
Unemployment (% change since 2000)
Unemployment (%) - White
Unemployment (%) - Black or African American
Unemployment (%) - Asian
Unemployment (%) - Hispanic or Latino
Unemployment (%) - American Indian and Alaska Native
Unemployment (%) - Multirace
Unemployment (%) - Other Race
Population density (people per square mile)
Population - Males (%)
Population - Females (%)
Population - Males (%) - White
Population - Males (%) - Black or African American
Population - Males (%) - Asian
Population - Males (%) - Hispanic or Latino
Population - Males (%) - American Indian and Alaska Native
Population - Males (%) - Multirace
Population - Males (%) - Other Race
Population - Females (%) - White
Population - Females (%) - Black or African American
Population - Females (%) - Asian
Population - Females (%) - Hispanic or Latino
Population - Females (%) - American Indian and Alaska Native
Population - Females (%) - Multirace
Population - Females (%) - Other Race
Coronavirus confirmed cases (Apr 27, 2024)
Deaths caused by coronavirus (Apr 27, 2024)
Coronavirus confirmed cases (per 100k population) (Apr 27, 2024)
Deaths caused by coronavirus (per 100k population) (Apr 27, 2024)
Daily increase in number of cases (Apr 27, 2024)
Weekly increase in number of cases (Apr 27, 2024)
Cases doubled (in days) (Apr 27, 2024)
Hospitalized patients (Apr 18, 2022)
Negative test results (Apr 18, 2022)
Total test results (Apr 18, 2022)
COVID Vaccine doses distributed (per 100k population) (Sep 19, 2023)
COVID Vaccine doses administered (per 100k population) (Sep 19, 2023)
COVID Vaccine doses distributed (Sep 19, 2023)
COVID Vaccine doses administered (Sep 19, 2023)
Likely homosexual households (%)
Likely homosexual households (% change since 2000)
Likely homosexual households - Lesbian couples (%)
Likely homosexual households - Lesbian couples (% change since 2000)
Likely homosexual households - Gay men (%)
Likely homosexual households - Gay men (% change since 2000)
Cost of living index
Median gross rent ($)
Median contract rent ($)
Median monthly housing costs ($)
Median house or condo value ($)
Median house or condo value ($ change since 2000)
Mean house or condo value by units in structure - 1, detached ($)
Mean house or condo value by units in structure - 1, attached ($)
Mean house or condo value by units in structure - 2 ($)
Mean house or condo value by units in structure by units in structure - 3 or 4 ($)
Mean house or condo value by units in structure - 5 or more ($)
Mean house or condo value by units in structure - Boat, RV, van, etc. ($)
Mean house or condo value by units in structure - Mobile home ($)
Median house or condo value ($) - White
Median house or condo value ($) - Black or African American
Median house or condo value ($) - Asian
Median house or condo value ($) - Hispanic or Latino
Median house or condo value ($) - American Indian and Alaska Native
Median house or condo value ($) - Multirace
Median house or condo value ($) - Other Race
Median resident age
Resident age diversity
Median resident age - Males
Median resident age - Females
Median resident age - White
Median resident age - Black or African American
Median resident age - Asian
Median resident age - Hispanic or Latino
Median resident age - American Indian and Alaska Native
Median resident age - Multirace
Median resident age - Other Race
Median resident age - Males - White
Median resident age - Males - Black or African American
Median resident age - Males - Asian
Median resident age - Males - Hispanic or Latino
Median resident age - Males - American Indian and Alaska Native
Median resident age - Males - Multirace
Median resident age - Males - Other Race
Median resident age - Females - White
Median resident age - Females - Black or African American
Median resident age - Females - Asian
Median resident age - Females - Hispanic or Latino
Median resident age - Females - American Indian and Alaska Native
Median resident age - Females - Multirace
Median resident age - Females - Other Race
Commute - mean travel time to work (minutes)
Travel time to work - Less than 5 minutes (%)
Travel time to work - Less than 5 minutes (% change since 2000)
Travel time to work - 5 to 9 minutes (%)
Travel time to work - 5 to 9 minutes (% change since 2000)
Travel time to work - 10 to 19 minutes (%)
Travel time to work - 10 to 19 minutes (% change since 2000)
Travel time to work - 20 to 29 minutes (%)
Travel time to work - 20 to 29 minutes (% change since 2000)
Travel time to work - 30 to 39 minutes (%)
Travel time to work - 30 to 39 minutes (% change since 2000)
Travel time to work - 40 to 59 minutes (%)
Travel time to work - 40 to 59 minutes (% change since 2000)
Travel time to work - 60 to 89 minutes (%)
Travel time to work - 60 to 89 minutes (% change since 2000)
Travel time to work - 90 or more minutes (%)
Travel time to work - 90 or more minutes (% change since 2000)
Marital status - Never married (%)
Marital status - Now married (%)
Marital status - Separated (%)
Marital status - Widowed (%)
Marital status - Divorced (%)
Median family income ($)
Median family income (% change since 2000)
Median non-family income ($)
Median non-family income (% change since 2000)
Median per capita income ($)
Median per capita income (% change since 2000)
Median family income ($) - White
Median family income ($) - Black or African American
Median family income ($) - Asian
Median family income ($) - Hispanic or Latino
Median family income ($) - American Indian and Alaska Native
Median family income ($) - Multirace
Median family income ($) - Other Race
Median year house/condo built
Median year apartment built
Year house built - Built 2005 or later (%)
Year house built - Built 2000 to 2004 (%)
Year house built - Built 1990 to 1999 (%)
Year house built - Built 1980 to 1989 (%)
Year house built - Built 1970 to 1979 (%)
Year house built - Built 1960 to 1969 (%)
Year house built - Built 1950 to 1959 (%)
Year house built - Built 1940 to 1949 (%)
Year house built - Built 1939 or earlier (%)
Average household size
Household density (households per square mile)
Average household size - White
Average household size - Black or African American
Average household size - Asian
Average household size - Hispanic or Latino
Average household size - American Indian and Alaska Native
Average household size - Multirace
Average household size - Other Race
Occupied housing units (%)
Vacant housing units (%)
Owner occupied housing units (%)
Renter occupied housing units (%)
Vacancy status - For rent (%)
Vacancy status - For sale only (%)
Vacancy status - Rented or sold, not occupied (%)
Vacancy status - For seasonal, recreational, or occasional use (%)
Vacancy status - For migrant workers (%)
Vacancy status - Other vacant (%)
Residents with income below the poverty level (%)
Residents with income below 50% of the poverty level (%)
Children below poverty level (%)
Poor families by family type - Married-couple family (%)
Poor families by family type - Male, no wife present (%)
Poor families by family type - Female, no husband present (%)
Poverty status for native-born residents (%)
Poverty status for foreign-born residents (%)
Poverty among high school graduates not in families (%)
Poverty among people who did not graduate high school not in families (%)
Residents with income below the poverty level (%) - White
Residents with income below the poverty level (%) - Black or African American
Residents with income below the poverty level (%) - Asian
Residents with income below the poverty level (%) - Hispanic or Latino
Residents with income below the poverty level (%) - American Indian and Alaska Native
Residents with income below the poverty level (%) - Multirace
Residents with income below the poverty level (%) - Other Race
Air pollution - Air Quality Index (AQI)
Air pollution - CO
Air pollution - NO2
Air pollution - SO2
Air pollution - Ozone
Air pollution - PM10
Air pollution - PM25
Air pollution - Pb
Crime - Murders per 100,000 population
Crime - Rapes per 100,000 population
Crime - Robberies per 100,000 population
Crime - Assaults per 100,000 population
Crime - Burglaries per 100,000 population
Crime - Thefts per 100,000 population
Crime - Auto thefts per 100,000 population
Crime - Arson per 100,000 population
Crime - City-data.com crime index
Crime - Violent crime index
Crime - Property crime index
Crime - Murders per 100,000 population (5 year average)
Crime - Rapes per 100,000 population (5 year average)
Crime - Robberies per 100,000 population (5 year average)
Crime - Assaults per 100,000 population (5 year average)
Crime - Burglaries per 100,000 population (5 year average)
Crime - Thefts per 100,000 population (5 year average)
Crime - Auto thefts per 100,000 population (5 year average)
Crime - Arson per 100,000 population (5 year average)
Crime - City-data.com crime index (5 year average)
Crime - Violent crime index (5 year average)
Crime - Property crime index (5 year average)
1996 Presidential Elections Results (%) - Democratic Party (Clinton)
1996 Presidential Elections Results (%) - Republican Party (Dole)
1996 Presidential Elections Results (%) - Other
2000 Presidential Elections Results (%) - Democratic Party (Gore)
2000 Presidential Elections Results (%) - Republican Party (Bush)
2000 Presidential Elections Results (%) - Other
2004 Presidential Elections Results (%) - Democratic Party (Kerry)
2004 Presidential Elections Results (%) - Republican Party (Bush)
2004 Presidential Elections Results (%) - Other
2008 Presidential Elections Results (%) - Democratic Party (Obama)
2008 Presidential Elections Results (%) - Republican Party (McCain)
2008 Presidential Elections Results (%) - Other
2012 Presidential Elections Results (%) - Democratic Party (Obama)
2012 Presidential Elections Results (%) - Republican Party (Romney)
2012 Presidential Elections Results (%) - Other
2016 Presidential Elections Results (%) - Democratic Party (Clinton)
2016 Presidential Elections Results (%) - Republican Party (Trump)
2016 Presidential Elections Results (%) - Other
2020 Presidential Elections Results (%) - Democratic Party (Biden)
2020 Presidential Elections Results (%) - Republican Party (Trump)
2020 Presidential Elections Results (%) - Other
Ancestries Reported - Arab (%)
Ancestries Reported - Czech (%)
Ancestries Reported - Danish (%)
Ancestries Reported - Dutch (%)
Ancestries Reported - English (%)
Ancestries Reported - French (%)
Ancestries Reported - French Canadian (%)
Ancestries Reported - German (%)
Ancestries Reported - Greek (%)
Ancestries Reported - Hungarian (%)
Ancestries Reported - Irish (%)
Ancestries Reported - Italian (%)
Ancestries Reported - Lithuanian (%)
Ancestries Reported - Norwegian (%)
Ancestries Reported - Polish (%)
Ancestries Reported - Portuguese (%)
Ancestries Reported - Russian (%)
Ancestries Reported - Scotch-Irish (%)
Ancestries Reported - Scottish (%)
Ancestries Reported - Slovak (%)
Ancestries Reported - Subsaharan African (%)
Ancestries Reported - Swedish (%)
Ancestries Reported - Swiss (%)
Ancestries Reported - Ukrainian (%)
Ancestries Reported - United States (%)
Ancestries Reported - Welsh (%)
Ancestries Reported - West Indian (%)
Ancestries Reported - Other (%)
Educational Attainment - No schooling completed (%)
Educational Attainment - Less than high school (%)
Educational Attainment - High school or equivalent (%)
Educational Attainment - Less than 1 year of college (%)
Educational Attainment - 1 or more years of college (%)
Educational Attainment - Associate degree (%)
Educational Attainment - Bachelor's degree (%)
Educational Attainment - Master's degree (%)
Educational Attainment - Professional school degree (%)
Educational Attainment - Doctorate degree (%)
School Enrollment - Nursery, preschool (%)
School Enrollment - Kindergarten (%)
School Enrollment - Grade 1 to 4 (%)
School Enrollment - Grade 5 to 8 (%)
School Enrollment - Grade 9 to 12 (%)
School Enrollment - College undergrad (%)
School Enrollment - Graduate or professional (%)
School Enrollment - Not enrolled in school (%)
School enrollment - Public schools (%)
School enrollment - Private schools (%)
School enrollment - Not enrolled (%)
Median number of rooms in houses and condos
Median number of rooms in apartments
Housing units lacking complete plumbing facilities (%)
Housing units lacking complete kitchen facilities (%)
Density of houses
Urban houses (%)
Rural houses (%)
Households with people 60 years and over (%)
Households with people 65 years and over (%)
Households with people 75 years and over (%)
Households with one or more nonrelatives (%)
Households with no nonrelatives (%)
Population in households (%)
Family households (%)
Nonfamily households (%)
Population in families (%)
Family households with own children (%)
Median number of bedrooms in owner occupied houses
Mean number of bedrooms in owner occupied houses
Median number of bedrooms in renter occupied houses
Mean number of bedrooms in renter occupied houses
Median number of vehichles in owner occupied houses
Mean number of vehichles in owner occupied houses
Median number of vehichles in renter occupied houses
Mean number of vehichles in renter occupied houses
Mortgage status - with mortgage (%)
Mortgage status - with second mortgage (%)
Mortgage status - with home equity loan (%)
Mortgage status - with both second mortgage and home equity loan (%)
Mortgage status - without a mortgage (%)
Average family size
Average family size - White
Average family size - Black or African American
Average family size - Asian
Average family size - Hispanic or Latino
Average family size - American Indian and Alaska Native
Average family size - Multirace
Average family size - Other Race
Geographical mobility - Same house 1 year ago (%)
Geographical mobility - Moved within same county (%)
Geographical mobility - Moved from different county within same state (%)
Geographical mobility - Moved from different state (%)
Geographical mobility - Moved from abroad (%)
Place of birth - Born in state of residence (%)
Place of birth - Born in other state (%)
Place of birth - Native, outside of US (%)
Place of birth - Foreign born (%)
Housing units in structures - 1, detached (%)
Housing units in structures - 1, attached (%)
Housing units in structures - 2 (%)
Housing units in structures - 3 or 4 (%)
Housing units in structures - 5 to 9 (%)
Housing units in structures - 10 to 19 (%)
Housing units in structures - 20 to 49 (%)
Housing units in structures - 50 or more (%)
Housing units in structures - Mobile home (%)
Housing units in structures - Boat, RV, van, etc. (%)
House/condo owner moved in on average (years ago)
Renter moved in on average (years ago)
Year householder moved into unit - Moved in 1999 to March 2000 (%)
Year householder moved into unit - Moved in 1995 to 1998 (%)
Year householder moved into unit - Moved in 1990 to 1994 (%)
Year householder moved into unit - Moved in 1980 to 1989 (%)
Year householder moved into unit - Moved in 1970 to 1979 (%)
Year householder moved into unit - Moved in 1969 or earlier (%)
Means of transportation to work - Drove car alone (%)
Means of transportation to work - Carpooled (%)
Means of transportation to work - Public transportation (%)
Means of transportation to work - Bus or trolley bus (%)
Means of transportation to work - Streetcar or trolley car (%)
Means of transportation to work - Subway or elevated (%)
Means of transportation to work - Railroad (%)
Means of transportation to work - Ferryboat (%)
Means of transportation to work - Taxicab (%)
Means of transportation to work - Motorcycle (%)
Means of transportation to work - Bicycle (%)
Means of transportation to work - Walked (%)
Means of transportation to work - Other means (%)
Working at home (%)
Industry diversity
Most Common Industries - Agriculture, forestry, fishing and hunting, and mining (%)
Most Common Industries - Agriculture, forestry, fishing and hunting (%)
Most Common Industries - Mining, quarrying, and oil and gas extraction (%)
Most Common Industries - Construction (%)
Most Common Industries - Manufacturing (%)
Most Common Industries - Wholesale trade (%)
Most Common Industries - Retail trade (%)
Most Common Industries - Transportation and warehousing, and utilities (%)
Most Common Industries - Transportation and warehousing (%)
Most Common Industries - Utilities (%)
Most Common Industries - Information (%)
Most Common Industries - Finance and insurance, and real estate and rental and leasing (%)
Most Common Industries - Finance and insurance (%)
Most Common Industries - Real estate and rental and leasing (%)
Most Common Industries - Professional, scientific, and management, and administrative and waste management services (%)
Most Common Industries - Professional, scientific, and technical services (%)
Most Common Industries - Management of companies and enterprises (%)
Most Common Industries - Administrative and support and waste management services (%)
Most Common Industries - Educational services, and health care and social assistance (%)
Most Common Industries - Educational services (%)
Most Common Industries - Health care and social assistance (%)
Most Common Industries - Arts, entertainment, and recreation, and accommodation and food services (%)
Most Common Industries - Arts, entertainment, and recreation (%)
Most Common Industries - Accommodation and food services (%)
Most Common Industries - Other services, except public administration (%)
Most Common Industries - Public administration (%)
Occupation diversity
Most Common Occupations - Management, business, science, and arts occupations (%)
Most Common Occupations - Management, business, and financial occupations (%)
Most Common Occupations - Management occupations (%)
Most Common Occupations - Business and financial operations occupations (%)
Most Common Occupations - Computer, engineering, and science occupations (%)
Most Common Occupations - Computer and mathematical occupations (%)
Most Common Occupations - Architecture and engineering occupations (%)
Most Common Occupations - Life, physical, and social science occupations (%)
Most Common Occupations - Education, legal, community service, arts, and media occupations (%)
Most Common Occupations - Community and social service occupations (%)
Most Common Occupations - Legal occupations (%)
Most Common Occupations - Education, training, and library occupations (%)
Most Common Occupations - Arts, design, entertainment, sports, and media occupations (%)
Most Common Occupations - Healthcare practitioners and technical occupations (%)
Most Common Occupations - Health diagnosing and treating practitioners and other technical occupations (%)
Most Common Occupations - Health technologists and technicians (%)
Most Common Occupations - Service occupations (%)
Most Common Occupations - Healthcare support occupations (%)
Most Common Occupations - Protective service occupations (%)
Most Common Occupations - Fire fighting and prevention, and other protective service workers including supervisors (%)
Most Common Occupations - Law enforcement workers including supervisors (%)
Most Common Occupations - Food preparation and serving related occupations (%)
Most Common Occupations - Building and grounds cleaning and maintenance occupations (%)
Most Common Occupations - Personal care and service occupations (%)
Most Common Occupations - Sales and office occupations (%)
Most Common Occupations - Sales and related occupations (%)
Most Common Occupations - Office and administrative support occupations (%)
Most Common Occupations - Natural resources, construction, and maintenance occupations (%)
Most Common Occupations - Farming, fishing, and forestry occupations (%)
Most Common Occupations - Construction and extraction occupations (%)
Most Common Occupations - Installation, maintenance, and repair occupations (%)
Most Common Occupations - Production, transportation, and material moving occupations (%)
Most Common Occupations - Production occupations (%)
Most Common Occupations - Transportation occupations (%)
Most Common Occupations - Material moving occupations (%)
People in Group quarters - Institutionalized population (%)
People in Group quarters - Correctional institutions (%)
People in Group quarters - Federal prisons and detention centers (%)
People in Group quarters - Halfway houses (%)
People in Group quarters - Local jails and other confinement facilities (including police lockups) (%)
People in Group quarters - Military disciplinary barracks (%)
People in Group quarters - State prisons (%)
People in Group quarters - Other types of correctional institutions (%)
People in Group quarters - Nursing homes (%)
People in Group quarters - Hospitals/wards, hospices, and schools for the handicapped (%)
People in Group quarters - Hospitals/wards and hospices for chronically ill (%)
People in Group quarters - Hospices or homes for chronically ill (%)
People in Group quarters - Military hospitals or wards for chronically ill (%)
People in Group quarters - Other hospitals or wards for chronically ill (%)
People in Group quarters - Hospitals or wards for drug/alcohol abuse (%)
People in Group quarters - Mental (Psychiatric) hospitals or wards (%)
People in Group quarters - Schools, hospitals, or wards for the mentally retarded (%)
People in Group quarters - Schools, hospitals, or wards for the physically handicapped (%)
People in Group quarters - Institutions for the deaf (%)
People in Group quarters - Institutions for the blind (%)
People in Group quarters - Orthopedic wards and institutions for the physically handicapped (%)
People in Group quarters - Wards in general hospitals for patients who have no usual home elsewhere (%)
People in Group quarters - Wards in military hospitals for patients who have no usual home elsewhere (%)
People in Group quarters - Juvenile institutions (%)
People in Group quarters - Long-term care (%)
People in Group quarters - Homes for abused, dependent, and neglected children (%)
People in Group quarters - Residential treatment centers for emotionally disturbed children (%)
People in Group quarters - Training schools for juvenile delinquents (%)
People in Group quarters - Short-term care, detention or diagnostic centers for delinquent children (%)
People in Group quarters - Type of juvenile institution unknown (%)
People in Group quarters - Noninstitutionalized population (%)
People in Group quarters - College dormitories (includes college quarters off campus) (%)
People in Group quarters - Military quarters (%)
People in Group quarters - On base (%)
People in Group quarters - Barracks, unaccompanied personnel housing (UPH), (Enlisted/Officer), ;and similar group living quarters for military personnel (%)
People in Group quarters - Transient quarters for temporary residents (%)
People in Group quarters - Military ships (%)
People in Group quarters - Group homes (%)
People in Group quarters - Homes or halfway houses for drug/alcohol abuse (%)
People in Group quarters - Homes for the mentally ill (%)
People in Group quarters - Homes for the mentally retarded (%)
People in Group quarters - Homes for the physically handicapped (%)
People in Group quarters - Other group homes (%)
People in Group quarters - Religious group quarters (%)
People in Group quarters - Dormitories (%)
People in Group quarters - Agriculture workers' dormitories on farms (%)
People in Group quarters - Job Corps and vocational training facilities (%)
People in Group quarters - Other workers' dormitories (%)
People in Group quarters - Crews of maritime vessels (%)
People in Group quarters - Other nonhousehold living situations (%)
People in Group quarters - Other noninstitutional group quarters (%)
Residents speaking English at home (%)
Residents speaking English at home - Born in the United States (%)
Residents speaking English at home - Native, born elsewhere (%)
Residents speaking English at home - Foreign born (%)
Residents speaking Spanish at home (%)
Residents speaking Spanish at home - Born in the United States (%)
Residents speaking Spanish at home - Native, born elsewhere (%)
Residents speaking Spanish at home - Foreign born (%)
Residents speaking other language at home (%)
Residents speaking other language at home - Born in the United States (%)
Residents speaking other language at home - Native, born elsewhere (%)
Residents speaking other language at home - Foreign born (%)
Class of Workers - Employee of private company (%)
Class of Workers - Self-employed in own incorporated business (%)
Class of Workers - Private not-for-profit wage and salary workers (%)
Class of Workers - Local government workers (%)
Class of Workers - State government workers (%)
Class of Workers - Federal government workers (%)
Class of Workers - Self-employed workers in own not incorporated business and Unpaid family workers (%)
House heating fuel used in houses and condos - Utility gas (%)
House heating fuel used in houses and condos - Bottled, tank, or LP gas (%)
House heating fuel used in houses and condos - Electricity (%)
House heating fuel used in houses and condos - Fuel oil, kerosene, etc. (%)
House heating fuel used in houses and condos - Coal or coke (%)
House heating fuel used in houses and condos - Wood (%)
House heating fuel used in houses and condos - Solar energy (%)
House heating fuel used in houses and condos - Other fuel (%)
House heating fuel used in houses and condos - No fuel used (%)
House heating fuel used in apartments - Utility gas (%)
House heating fuel used in apartments - Bottled, tank, or LP gas (%)
House heating fuel used in apartments - Electricity (%)
House heating fuel used in apartments - Fuel oil, kerosene, etc. (%)
House heating fuel used in apartments - Coal or coke (%)
House heating fuel used in apartments - Wood (%)
House heating fuel used in apartments - Solar energy (%)
House heating fuel used in apartments - Other fuel (%)
House heating fuel used in apartments - No fuel used (%)
Armed forces status - In Armed Forces (%)
Armed forces status - Civilian (%)
Armed forces status - Civilian - Veteran (%)
Armed forces status - Civilian - Nonveteran (%)
Fatal accidents locations in years 2005-2021
Fatal accidents locations in 2005
Fatal accidents locations in 2006
Fatal accidents locations in 2007
Fatal accidents locations in 2008
Fatal accidents locations in 2009
Fatal accidents locations in 2010
Fatal accidents locations in 2011
Fatal accidents locations in 2012
Fatal accidents locations in 2013
Fatal accidents locations in 2014
Fatal accidents locations in 2015
Fatal accidents locations in 2016
Fatal accidents locations in 2017
Fatal accidents locations in 2018
Fatal accidents locations in 2019
Fatal accidents locations in 2020
Fatal accidents locations in 2021
Alcohol use - People drinking some alcohol every month (%)
Alcohol use - People not drinking at all (%)
Alcohol use - Average days/month drinking alcohol
Alcohol use - Average drinks/week
Alcohol use - Average days/year people drink much
Audiometry - Average condition of hearing (%)
Audiometry - People that can hear a whisper from across a quiet room (%)
Audiometry - People that can hear normal voice from across a quiet room (%)
Audiometry - Ears ringing, roaring, buzzing (%)
Audiometry - Had a job exposure to loud noise (%)
Audiometry - Had off-work exposure to loud noise (%)
Blood Pressure & Cholesterol - Has high blood pressure (%)
Blood Pressure & Cholesterol - Checking blood pressure at home (%)
Blood Pressure & Cholesterol - Frequently checking blood cholesterol (%)
Blood Pressure & Cholesterol - Has high cholesterol level (%)
Consumer Behavior - Money monthly spent on food at supermarket/grocery store
Consumer Behavior - Money monthly spent on food at other stores
Consumer Behavior - Money monthly spent on eating out
Consumer Behavior - Money monthly spent on carryout/delivered foods
Consumer Behavior - Income spent on food at supermarket/grocery store (%)
Consumer Behavior - Income spent on food at other stores (%)
Consumer Behavior - Income spent on eating out (%)
Consumer Behavior - Income spent on carryout/delivered foods (%)
Current Health Status - General health condition (%)
Current Health Status - Blood donors (%)
Current Health Status - Has blood ever tested for HIV virus (%)
Current Health Status - Left-handed people (%)
Dermatology - People using sunscreen (%)
Diabetes - Diabetics (%)
Diabetes - Had a blood test for high blood sugar (%)
Diabetes - People taking insulin (%)
Diet Behavior & Nutrition - Diet health (%)
Diet Behavior & Nutrition - Milk product consumption (# of products/month)
Diet Behavior & Nutrition - Meals not home prepared (#/week)
Diet Behavior & Nutrition - Meals from fast food or pizza place (#/week)
Diet Behavior & Nutrition - Ready-to-eat foods (#/month)
Diet Behavior & Nutrition - Frozen meals/pizza (#/month)
Drug Use - People that ever used marijuana or hashish (%)
Drug Use - Ever used hard drugs (%)
Drug Use - Ever used any form of cocaine (%)
Drug Use - Ever used heroin (%)
Drug Use - Ever used methamphetamine (%)
Health Insurance - People covered by health insurance (%)
Kidney Conditions-Urology - Avg. # of times urinating at night
Medical Conditions - People with asthma (%)
Medical Conditions - People with anemia (%)
Medical Conditions - People with psoriasis (%)
Medical Conditions - People with overweight (%)
Medical Conditions - Elderly people having difficulties in thinking or remembering (%)
Medical Conditions - People who ever received blood transfusion (%)
Medical Conditions - People having trouble seeing even with glass/contacts (%)
Medical Conditions - People with arthritis (%)
Medical Conditions - People with gout (%)
Medical Conditions - People with congestive heart failure (%)
Medical Conditions - People with coronary heart disease (%)
Medical Conditions - People with angina pectoris (%)
Medical Conditions - People who ever had heart attack (%)
Medical Conditions - People who ever had stroke (%)
Medical Conditions - People with emphysema (%)
Medical Conditions - People with thyroid problem (%)
Medical Conditions - People with chronic bronchitis (%)
Medical Conditions - People with any liver condition (%)
Medical Conditions - People who ever had cancer or malignancy (%)
Mental Health - People who have little interest in doing things (%)
Mental Health - People feeling down, depressed, or hopeless (%)
Mental Health - People who have trouble sleeping or sleeping too much (%)
Mental Health - People feeling tired or having little energy (%)
Mental Health - People with poor appetite or overeating (%)
Mental Health - People feeling bad about themself (%)
Mental Health - People who have trouble concentrating on things (%)
Mental Health - People moving or speaking slowly or too fast (%)
Mental Health - People having thoughts they would be better off dead (%)
Oral Health - Average years since last visit a dentist
Oral Health - People embarrassed because of mouth (%)
Oral Health - People with gum disease (%)
Oral Health - General health of teeth and gums (%)
Oral Health - Average days a week using dental floss/device
Oral Health - Average days a week using mouthwash for dental problem
Oral Health - Average number of teeth
Pesticide Use - Households using pesticides to control insects (%)
Pesticide Use - Households using pesticides to kill weeds (%)
Physical Activity - People doing vigorous-intensity work activities (%)
Physical Activity - People doing moderate-intensity work activities (%)
Physical Activity - People walking or bicycling (%)
Physical Activity - People doing vigorous-intensity recreational activities (%)
Physical Activity - People doing moderate-intensity recreational activities (%)
Physical Activity - Average hours a day doing sedentary activities
Physical Activity - Average hours a day watching TV or videos
Physical Activity - Average hours a day using computer
Physical Functioning - People having limitations keeping them from working (%)
Physical Functioning - People limited in amount of work they can do (%)
Physical Functioning - People that need special equipment to walk (%)
Physical Functioning - People experiencing confusion/memory problems (%)
Physical Functioning - People requiring special healthcare equipment (%)
Prescription Medications - Average number of prescription medicines taking
Preventive Aspirin Use - Adults 40+ taking low-dose aspirin (%)
Reproductive Health - Vaginal deliveries (%)
Reproductive Health - Cesarean deliveries (%)
Reproductive Health - Deliveries resulted in a live birth (%)
Reproductive Health - Pregnancies resulted in a delivery (%)
Reproductive Health - Women breastfeeding newborns (%)
Reproductive Health - Women that had a hysterectomy (%)
Reproductive Health - Women that had both ovaries removed (%)
Reproductive Health - Women that have ever taken birth control pills (%)
Reproductive Health - Women taking birth control pills (%)
Reproductive Health - Women that have ever used Depo-Provera or injectables (%)
Reproductive Health - Women that have ever used female hormones (%)
Sexual Behavior - People 18+ that ever had sex (vaginal, anal, or oral) (%)
Sexual Behavior - Males 18+ that ever had vaginal sex with a woman (%)
Sexual Behavior - Males 18+ that ever performed oral sex on a woman (%)
Sexual Behavior - Males 18+ that ever had anal sex with a woman (%)
Sexual Behavior - Males 18+ that ever had any sex with a man (%)
Sexual Behavior - Females 18+ that ever had vaginal sex with a man (%)
Sexual Behavior - Females 18+ that ever performed oral sex on a man (%)
Sexual Behavior - Females 18+ that ever had anal sex with a man (%)
Sexual Behavior - Females 18+ that ever had any kind of sex with a woman (%)
Sexual Behavior - Average age people first had sex
Sexual Behavior - Average number of female sex partners in lifetime (males 18+)
Sexual Behavior - Average number of female vaginal sex partners in lifetime (males 18+)
Sexual Behavior - Average age people first performed oral sex on a woman (18+)
Sexual Behavior - Average number of woman performed oral sex on in lifetime (18+)
Sexual Behavior - Average number of male sex partners in lifetime (males 18+)
Sexual Behavior - Average number of male anal sex partners in lifetime (males 18+)
Sexual Behavior - Average age people first performed oral sex on a man (18+)
Sexual Behavior - Average number of male oral sex partners in lifetime (18+)
Sexual Behavior - People using protection when performing oral sex (%)
Sexual Behavior - Average number of times people have vaginal or anal sex a year
Sexual Behavior - People having sex without condom (%)
Sexual Behavior - Average number of male sex partners in lifetime (females 18+)
Sexual Behavior - Average number of male vaginal sex partners in lifetime (females 18+)
Sexual Behavior - Average number of female sex partners in lifetime (females 18+)
Sexual Behavior - Circumcised males 18+ (%)
Sleep Disorders - Average hours sleeping at night
Sleep Disorders - People that has trouble sleeping (%)
Smoking-Cigarette Use - People smoking cigarettes (%)
Taste & Smell - People 40+ having problems with smell (%)
Taste & Smell - People 40+ having problems with taste (%)
Taste & Smell - People 40+ that ever had wisdom teeth removed (%)
Taste & Smell - People 40+ that ever had tonsils teeth removed (%)
Taste & Smell - People 40+ that ever had a loss of consciousness because of a head injury (%)
Taste & Smell - People 40+ that ever had a broken nose or other serious injury to face or skull (%)
Taste & Smell - People 40+ that ever had two or more sinus infections (%)
Weight - Average height (inches)
Weight - Average weight (pounds)
Weight - Average BMI
Weight - People that are obese (%)
Weight - People that ever were obese (%)
Weight - People trying to lose weight (%)
100%
urban population.
Estimated median house/condo value in 2022: $137,997
46807:
$137,997Indiana:
$208,700
According to our research of Indiana and other state lists, there was 1 registered sex offender living in 46807 zip code as of April 27, 2024 . The ratio of all residents to sex offenders in zip code 46807 is 17,137 to 1.The ratio of registered sex offenders to all residents in this zip code is much lower than the state average.
Median resident age: This zip code:
31.3 yearsIndiana median age:
38.2 years
Average household size: This zip code:
2.5 peopleIndiana:
2.4 people
Averages for the 2020 tax year for zip code 46807, filed in 2021:
Average Adjusted Gross Income (AGI) in 2020: $45,731 (Individual Income Tax Returns) Here:
$45,731State:
$64,978
Salary/wage: $40,749 (reported on 88.9% of returns )Here:
$40,749State:
$55,245
(% of AGI for various income ranges: 1197.6% for AGIs below $25k , 3784.6% for AGIs $25k-50k , 6593.7% for AGIs $50k-75k , 10392.6% for AGIs $75k-100k , 17282.8% for AGIs $100k-200k , 75196.7% for AGIs over 200k ) Taxable interest for individuals: $662 (reported on 18.0% of returns )This zip code:
$662Indiana:
$1,351
(% of AGI for various income ranges: 6.0% for AGIs below $25k , 5.2% for AGIs $25k-50k , 16.6% for AGIs $50k-75k , 22.6% for AGIs $75k-100k , 72.8% for AGIs $100k-200k , 703.3% for AGIs over 200k ) Ordinary dividends: $4,816 (reported on 11.2% of returns )(% of AGI for various income ranges: 13.2% for AGIs below $25k , 13.5% for AGIs $25k-50k , 60.3% for AGIs $50k-75k , 83.3% for AGIs $75k-100k , 250.3% for AGIs $100k-200k , 6570.0% for AGIs over 200k ) Net capital gain/loss in AGI: +$8,571 (reported on 9.6% of returns )Here:
+$8,571State:
+$17,730
(% of AGI for various income ranges: 6.5% for AGIs below $25k , 17.4% for AGIs $25k-50k , 44.3% for AGIs $50k-75k , 83.3% for AGIs $75k-100k , 373.4% for AGIs $100k-200k , 13320.0% for AGIs over 200k ) Profit/loss from business: +$10,672 (reported on 13.5% of returns )Here:
+$10,672State:
+$12,144
(% of AGI for various income ranges: 102.6% for AGIs below $25k , 94.8% for AGIs $25k-50k , 195.2% for AGIs $50k-75k , 249.5% for AGIs $75k-100k , 614.7% for AGIs $100k-200k , 7256.7% for AGIs over 200k ) Taxable individual retirement arrangement distribution: $14,580 (reported on 5.1% of returns )46807:
$14,580Indiana:
$18,302
(% of AGI for various income ranges: 25.3% for AGIs below $25k , 43.7% for AGIs $25k-50k , 100.3% for AGIs $50k-75k , 277.7% for AGIs $75k-100k , 729.7% for AGIs $100k-200k ) Total itemized deductions: $26,765 (reported on 2.5% of returns )Here:
$26,765State:
$35,601
(% of AGI for various income ranges: 36.9% for AGIs $25k-50k , 69.3% for AGIs $50k-75k , 183.8% for AGIs $75k-100k , 427.2% for AGIs $100k-200k , 6296.7% for AGIs over 200k ) Charity contributions: $11,038 (reported on 2.0% of returns )Here:
$11,038State:
$15,596
(% of AGI for various income ranges: 9.7% for AGIs $25k-50k , 12.3% for AGIs $50k-75k , 63.3% for AGIs $75k-100k , 170.6% for AGIs $100k-200k , 2213.3% for AGIs over 200k ) Taxes paid: $6,355 (reported on 2.5% of returns )(% of AGI for various income ranges: 9.0% for AGIs $25k-50k , 13.0% for AGIs $50k-75k , 49.2% for AGIs $75k-100k , 124.1% for AGIs $100k-200k , 1270.0% for AGIs over 200k ) Earned income credit: $2,531 (reported on 23.7% of returns )(% of AGI for various income ranges: 123.8% for AGIs below $25k , 81.9% for AGIs $25k-50k , 2.2% for AGIs $50k-75k ) Percentage of individuals using paid preparers for their 2020 taxes: 92.9%(% for various income ranges: 91.8% for AGIs below $25k , 93.5% for AGIs $25k-50k , 94.7% for AGIs $50k-75k , 92.7% for AGIs $75k-100k , 92.6% for AGIs $100k-200k , 91.7% for AGIs over 200k )
Averages for the 2012 tax year for zip code 46807, filed in 2013:
Average Adjusted Gross Income (AGI) in 2012: $37,701 (Individual Income Tax Returns) Here:
$37,701State:
$52,932
Salary/wage: $33,854 (reported on 88.3% of returns )Here:
$33,854State:
$45,173
(% of AGI for various income ranges: 78.5% for AGIs below $25k , 87.7% for AGIs $25k-50k , 85.5% for AGIs $50k-75k , 79.7% for AGIs $75k-100k , 76.7% for AGIs $100k-200k , 51.2% for AGIs over 200k ) Taxable interest for individuals: $979 (reported on 21.6% of returns )This zip code:
$979Indiana:
$1,311
(% of AGI for various income ranges: 0.7% for AGIs below $25k , 0.4% for AGIs $25k-50k , 0.3% for AGIs $50k-75k , 0.7% for AGIs $75k-100k , 0.6% for AGIs $100k-200k , 1.1% for AGIs over 200k ) Ordinary dividends: $4,760 (reported on 13.0% of returns )(% of AGI for various income ranges: 1.2% for AGIs below $25k , 0.9% for AGIs $25k-50k , 0.8% for AGIs $50k-75k , 1.6% for AGIs $75k-100k , 1.8% for AGIs $100k-200k , 5.6% for AGIs over 200k ) Net capital gain/loss in AGI: +$7,027 (reported on 9.4% of returns )Here:
+$7,027State:
+$10,406
(% of AGI for various income ranges: 0.2% for AGIs $25k-50k , 0.2% for AGIs $50k-75k , 1.2% for AGIs $75k-100k , 1.1% for AGIs $100k-200k , 12.9% for AGIs over 200k ) Profit/loss from business: +$8,510 (reported on 14.1% of returns )Here:
+$8,510State:
+$11,105
(% of AGI for various income ranges: 8.7% for AGIs below $25k , 1.6% for AGIs $25k-50k , 2.3% for AGIs $50k-75k , 3.4% for AGIs $75k-100k , 3.0% for AGIs $100k-200k ) Taxable individual retirement arrangement distribution: $11,196 (reported on 6.8% of returns )46807:
$11,196Indiana:
$13,841
(% of AGI for various income ranges: 1.7% for AGIs below $25k , 1.6% for AGIs $25k-50k , 1.6% for AGIs $50k-75k , 2.4% for AGIs $75k-100k , 4.8% for AGIs $100k-200k ) Self-employment retirement plans: $17,500 (reported on 0.3% of returns )46807:
$17,500Indiana:
$21,482
Total itemized deductions: $17,730 (20% of AGI, reported on 15.1% of returns )Here:
$17,730State:
$20,913
Here:
19.6% of AGIState:
18.2% of AGI
(% of AGI for various income ranges: 3.2% for AGIs below $25k , 4.4% for AGIs $25k-50k , 6.7% for AGIs $50k-75k , 8.4% for AGIs $75k-100k , 11.2% for AGIs $100k-200k , 13.0% for AGIs over 200k ) Charity contributions: $5,152 (reported on 12.3% of returns )(% of AGI for various income ranges: 0.3% for AGIs below $25k , 0.7% for AGIs $25k-50k , 1.6% for AGIs $50k-75k , 1.8% for AGIs $75k-100k , 2.6% for AGIs $100k-200k , 4.9% for AGIs over 200k ) Taxes paid: $5,870 (reported on 14.9% of returns )(% of AGI for various income ranges: 0.5% for AGIs below $25k , 1.0% for AGIs $25k-50k , 1.8% for AGIs $50k-75k , 2.4% for AGIs $75k-100k , 4.1% for AGIs $100k-200k , 6.9% for AGIs over 200k ) Earned income credit: $2,575 (reported on 30.0% of returns )(% of AGI for various income ranges: 9.8% for AGIs below $25k , 1.7% for AGIs $25k-50k ) Percentage of individuals using paid preparers for their 2012 taxes: 43.3%(% for various income ranges: 41.7% for AGIs below $25k , 42.6% for AGIs $25k-50k , 43.7% for AGIs $50k-75k , 48.7% for AGIs $75k-100k , 50.0% for AGIs $100k-200k , 83.3% for AGIs over 200k )
Averages for the 2004 tax year for zip code 46807, filed in 2005:
Average Adjusted Gross Income (AGI) in 2004: $35,425 (Individual Income Tax Returns) Here:
$35,425State:
$44,790
Salary/wage: $31,257 (reported on 89.2% of returns )Here:
$31,257State:
$39,615
(% of AGI for various income ranges: 92.3% for AGIs below $10k , 83.0% for AGIs $10k-25k , 88.6% for AGIs $25k-50k , 87.2% for AGIs $50k-75k , 84.9% for AGIs $75k-100k , 52.5% for AGIs over 100k ) Taxable interest for individuals: $1,583 (reported on 31.3% of returns )This zip code:
$1,583Indiana:
$1,535
(% of AGI for various income ranges: 2.1% for AGIs below $10k , 1.6% for AGIs $10k-25k , 1.0% for AGIs $25k-50k , 1.2% for AGIs $50k-75k , 1.3% for AGIs $75k-100k , 2.0% for AGIs over 100k ) Taxable dividends: $4,433 (reported on 17.0% of returns )(% of AGI for various income ranges: 2.8% for AGIs below $10k , 1.3% for AGIs $10k-25k , 0.9% for AGIs $25k-50k , 1.2% for AGIs $50k-75k , 1.7% for AGIs $75k-100k , 5.0% for AGIs over 100k ) Net capital gain/loss: +$5,650 (reported on 12.4% of returns )Here:
+$5,650State:
+$8,619
(% of AGI for various income ranges: 0.4% for AGIs below $10k , 0.3% for AGIs $10k-25k , 0.3% for AGIs $25k-50k , 1.0% for AGIs $50k-75k , 2.0% for AGIs $75k-100k , 6.0% for AGIs over 100k ) Profit/loss from business: +$7,517 (reported on 11.4% of returns )Here:
+$7,517State:
+$10,071
(% of AGI for various income ranges: 6.1% for AGIs below $10k , 3.8% for AGIs $10k-25k , 2.0% for AGIs $25k-50k , 1.6% for AGIs $50k-75k , 2.3% for AGIs $75k-100k , 2.5% for AGIs over 100k ) IRA payment deduction: $2,471 (reported on 1.9% of returns )46807:
$2,471Indiana:
$2,840
(% of AGI for various income ranges: 0.2% for AGIs $10k-25k , 0.2% for AGIs $25k-50k , 0.1% for AGIs $50k-75k , 0.3% for AGIs $75k-100k ) Self-employed pension: $11,520 (reported on 0.3% of returns )Here:
$11,520Indiana:
$15,305
Total itemized deductions: $15,099 (20% of AGI, reported on 22.6% of returns )Here:
$15,099State:
$17,065
Here:
19.8% of AGIState:
19.5% of AGI
(% of AGI for various income ranges: 5.7% for AGIs below $10k , 5.0% for AGIs $10k-25k , 8.7% for AGIs $25k-50k , 10.1% for AGIs $50k-75k , 12.6% for AGIs $75k-100k , 12.3% for AGIs over 100k ) Charity contributions deductions: $3,775 (5% of AGI, reported on 19.4% of returns )Here:
4.6% of AGIState:
3.8% of AGI
(% of AGI for various income ranges: 0.7% for AGIs below $10k , 0.8% for AGIs $10k-25k , 1.4% for AGIs $25k-50k , 1.9% for AGIs $50k-75k , 2.6% for AGIs $75k-100k , 3.7% for AGIs over 100k ) Total tax: $5,356 (reported on 66.9% of returns )(% of AGI for various income ranges: 2.0% for AGIs below $10k , 3.7% for AGIs $10k-25k , 6.2% for AGIs $25k-50k , 8.6% for AGIs $50k-75k , 10.4% for AGIs $75k-100k , 20.8% for AGIs over 100k ) Earned income credit: $1,725 (reported on 24.4% of returns )Percentage of individuals using paid preparers for their 2004 taxes: 52.6%(% for various income ranges: 49.9% for AGIs below $10k , 55.5% for AGIs $10k-25k , 52.7% for AGIs $25k-50k , 48.7% for AGIs $50k-75k , 48.5% for AGIs $75k-100k , 64.5% for AGIs over 100k )
Estimated median household income in 2022: This zip code:
$57,292Indiana:
$66,785
Nearest zip codes: 46802 ,
46806 ,
46808 ,
46805 ,
46803 ,
46819 .
Fort Wayne Zip Code Map
Percentage of family households: This zip code:
51.2%Indiana:
46.2%
Percentage of households with unmarried partners: This zip code:
11.1%Indiana:
48.0%
Likely homosexual households (counted as self-reported same-sex unmarried-partner households)
Lesbian couples: 0.2% of all households Gay men: 0.3% of all households
Household received Food Stamps/SNAP in the past 12 months: 766Household did not receive Food Stamps/SNAP in the past 12 months: 5,536
Women who had a birth in the past 12 months: 264 (173 now married , 89 unmarried) Women who did not have a birth in the past 12 months: 3,965 (1,588 now married , 2,374 unmarried)
Housing units in zip code 46807 with a mortgage: 2,645 (173
second mortgage , 158
both second mortgage and home equity loan )
Houses without a mortgage: 123
Median monthly owner costs for units with a mortgage: $960
Median monthly owner costs for units without a mortgage: $425
Residents with income below the poverty level in 2022:
This zip code:
16.2%Whole state:
12.6%
Residents with income below 50% of the poverty level in 2022:
This zip code:
10.0%Whole state:
6.3%
Median number of rooms in houses and condos: Median number of rooms in apartments:
Year house built (houses)
4 2020 or later22 2010 to 2019114 2000 to 200986 1990 to 1999278 1980 to 1989865 1970 to 1979655 1960 to 19691,045 1950 to 1959874 1940 to 19492,951 1939 or earlier
Zip code 46807 household income distribution in 2022 247 Less than $10,000350 $10,000 to $14,999217 $15,000 to $19,999163 $20,000 to $24,999280 $25,000 to $29,999293 $30,000 to $34,999401 $35,000 to $39,999432 $40,000 to $44,999370 $45,000 to $49,999708 $50,000 to $59,999472 $60,000 to $74,9991,107 $75,000 to $99,999594 $100,000 to $124,999171 $125,000 to $149,999342 $150,000 to $199,999154 $200,000 or moreEstimate of home value of owner-occupied houses/condos in 2022 in zip code 46807 26 Less than $10,00021 $10,000 to $14,9997 $15,000 to $19,99919 $20,000 to $24,9998 $25,000 to $29,99939 $30,000 to $34,99953 $35,000 to $39,99970 $40,000 to $49,999106 $50,000 to $59,99987 $60,000 to $69,999284 $70,000 to $79,999280 $80,000 to $89,999303 $90,000 to $99,999287 $100,000 to $124,999349 $125,000 to $149,999306 $150,000 to $174,999165 $175,000 to $199,999357 $200,000 to $249,999365 $250,000 to $299,999147 $300,000 to $399,99968 $400,000 to $499,9995 $500,000 to $749,99918 $1,000,000 to $1,499,9999 $2,000,000 or moreRent paid by renters in 2022 in zip code 46807 31 Less than $1006 $150 to $19914 $300 to $34945 $350 to $39981 $400 to $44958 $450 to $499132 $500 to $549334 $550 to $599219 $600 to $649130 $650 to $699165 $700 to $749319 $750 to $799691 $800 to $89942 $900 to $99952 $1,000 to $1,24914 $1,250 to $1,49945 No cash rent
Median gross rent in 2022: $907.
Median price asked for vacant for-sale houses and condos in 2022: $133,967.
Estimated median house (or condo) value in 2022 for: White Non-Hispanic householders: $137,780Black or African American householders: $134,757American Indian or Alaska Native householders: $63,923Asian householders: $160,240Native Hawaiian and other Pacific Islander householders: $140,372Some other race householders: $145,771Two or more races householders: $125,039Hispanic or Latino householders: $135,621Estimated median house or condo value in 2022: $137,997
46807:
$137,997Indiana:
$208,700
Lower value quartile - upper value quartile: $94,075 - $213,965
Mean price in 2022: Detached houses: $199,291Here:
$199,291State:
$257,916
Townhouses or other attached units: $129,527Here:
$129,527State:
$224,114
In 2-unit structures: $40,699Here:
$40,699State:
$175,375
In 3-to-4-unit structures: $282,620Here:
$282,620State:
$151,116
In 5-or-more-unit structures: $128,347Here:
$128,347State:
$200,844
Mobile homes: $49,266Here:
$49,266State:
$67,116
Housing units in structures:
One, detached: 5,340One, attached: 126Two: 5493 or 4: 1945 to 9: 44310 to 19: 12520 to 49: 1950 or more: 285Mobile homes: 19Boats, RVs, vans, etc.: 7Unemployment : 5.4%
Means of transportation to work in zip code 46807 69.5% 5,391 Drove a car alone10.7% 827 Carpooled1.9% 146 Bus or trolley bus0.2% 12 Taxi0.4% 34 Motorcycle0.5% 41 Bicycle2.4% 185 Walked0.2% 18 Other means15.6% 1,210 Worked at homeTravel time to work (commute) in zip code 46807 226 Less than 5 minutes761 5 to 9 minutes965 10 to 14 minutes1,467 15 to 19 minutes1,217 20 to 24 minutes577 25 to 29 minutes561 30 to 34 minutes144 35 to 39 minutes205 40 to 44 minutes200 45 to 59 minutes164 60 to 89 minutes153 90 or more minutes
Neighborhoods in zip code 46807: Percentage of zip code residents living and working in this county: 93.3%
Household type by relationship:
Households: 16,148
Male householders: 3,002 (1,014 living alone ), Female householders: 3,299 (921 living alone )2,280 spouses (2,207 opposite-sex spouses ), 575 unmarried partners , (546 opposite-sex unmarried partners ), 5,304 children (4,942 natural , 109 adopted , 251 stepchildren ), 202 grandchildren , 249 brothers or sisters , 176 parents , 129 foster children , 191 other relatives , 554 non-relatives In group quarters: 98 (-1 institutionalized population )
Size of family households: 1,616 2-persons , 590 3-persons , 834 4-persons , 462 5-persons , 236 6-persons , 167 7-or-more-persons
Size of nonfamily households: 1,932 1-person , 359 2-persons , 33 3-persons , 53 4-persons
2,233 married couples with children. single-parent households (473 men , 1,447 women ).
83.1% of residents of 46807 zip code speak English at home. of residents speak Spanish at home (72% very well, 15% well, 9% not well, 3% not at all ).of residents speak other Indo-European language at home (69% very well, 31% well ).of residents speak Asian or Pacific Island language at home (67% very well, 10% well, 23% not well ).
Foreign born population: 1,324 (8.2%)
(30.6%
of them are naturalized citizens )
This zip code:
8.2%Whole state:
6.1%
45% Honduras 10% Singapore 8% Guatemala 4% France 3% Serbia 2% Liberia 1% Egypt 16% German 7% American 4% English 2% Irish 2% Polish 2% European 1% Scottish
Year of entry for the foreign-born population
97 2010 or later 609 2000 to 2009 416 1990 to 1999 156 Before 1990
There are
42 Medical Specialists in Zip Code 46807 .
Facilities with environmental interests located in this zip code:
LUTHERAN CENTER FOR HEALTH SERVICES (3024 FAIRFIELD AVE in FORT WAYNE, IN)
AIR MINOR (AIRS/AFS) STATE MASTER (Indiana facility tracking) - CRTK-2864, EPCRA, UST-5262, UNDERGROUND STORAGE TANK PROGRAM (Resource Conservation and Recovery Act (tracking hazardous waste)) Business SIC classification: NONCLASSIFIABLE ESTABLISHMENTSOrganizations: LUTHERAN FOUNDATION INC (CONTACT/OPERATOR)
, THE LUTHERAN FOUNDATION INC (CONTACT/OWNER)
Alternative names: LUTHERAN FOUNDATION INC, LUTHERAN HOSPITAL, LUTHERAN HOSPITAL OF FORT WAYNE INC
POLY HI SOLIDUR (2710 AMERICAN WAY in FORT WAYNE, IN)
STATE MASTER (Indiana facility tracking) - ACES-OP-00300165, AIR PROGRAM, CRTK-10014, EPCRA Conditionally Exempt Small Quantity Generators, less than 100 kg/month of hazardous waste (Resource Conservation and Recovery Act (tracking hazardous waste)) - notification Organizations: QUADRANT ENGINEERING PLASTIC PRODUCTS (CONTACT/OPERATOR)
Alternative names: MENASHA CORP POLY HI
CLARK OIL 762 (5850 BLUFFTON RD in FT WAYNE, IN)
STATE MASTER (Indiana facility tracking) - CRTK-8743, EPCRA, LUST-199810560, LEAKING STORAGE TANK, UST-2902, UNDERGROUND STORAGE TANK PROGRAM Conditionally Exempt Small Quantity Generators, less than 100 kg/month of hazardous waste (Resource Conservation and Recovery Act (tracking hazardous waste)) - notification Organizations: CLARK RETAIL ENTERPRISES INC (CONTACT/OWNER)
Alternative names: CLARK OIL #762, CLARK STORE 762
PEERLESS CLEANERS (4934 S CALHOUN ST in FORT WAYNE, IN)
STATE MASTER (Indiana facility tracking) (Resource Conservation and Recovery Act (tracking hazardous waste))
RANDY AUTOMOTIVE (2316 S CALHOUN in FORT WAYNE, IN)
STATE MASTER (Indiana facility tracking) Conditionally Exempt Small Quantity Generators, less than 100 kg/month of hazardous waste (Resource Conservation and Recovery Act (tracking hazardous waste)) - notification Organizations: RON LUNTZ (CONTACT/OWNER)
ROGERS MARKETS INC (7008 BLUFFTON RD in FORT WAYNE, IN)
STATE MASTER (Indiana facility tracking) Conditionally Exempt Small Quantity Generators, less than 100 kg/month of hazardous waste (Resource Conservation and Recovery Act (tracking hazardous waste)) - notification
Housing units lacking complete plumbing facilities: 0.6%
Housing units lacking complete kitchen facilities: 1.3%
84.0% Utility gas 13.9% Electricity 1.4% Bottled, tank, or LP gas 0.5% Wood
Population in 1990: 18,346.
Place of birth for U.S.-born residents:
This state: 11,083Northeast: 454Midwest: 2,029South: 839West: 399
50% of the 46807 zip code residents lived in the same house 5 years ago.
Out of people who lived in different houses, 69% lived in this county.
Out of people who lived in different counties, 50% lived in Indiana.
91% of the 46807 zip code residents lived in the same house 1 year ago.
Out of people who lived in different houses, 59% moved from this county.
Out of people who lived in different houses, 25% moved from different county within same state.
Out of people who lived in different houses, 13% moved from different state.
Out of people who lived in different houses, 3% moved from abroad.
Private vs. public school enrollment:
Students in private schools in grades 1 to 8 (elementary and middle school): 523
Students in private schools in grades 9 to 12 (high school): 253
Students in private undergraduate colleges: 64
Occupation by median earnings in the past 12 months ($)
82,753 Computer and mathematical occupations 66,035 Health diagnosing and treating practitioners and other technical occupations 58,943 Business and financial operations occupations 58,234 Installation, maintenance, and repair occupations 57,461 Management occupations 52,509 Architecture and engineering occupations
Top industries in this zip code by the number of employees in 2005:
Health Care and Social Assistance: Vocational Rehabilitation Services (500-999 employees: 1 establishment, 10-19 employees: 1 establishment)Other Services (except Public Administration): Religious Organizations (20-49: 4, 10-19: 2, 5-9: 4, 1-4: 12)Arts, Entertainment, and Recreation: Musical Groups and Artists (100-249: 1)Accommodation and Food Services: Full-Service Restaurants (20-49: 3, 10-19: 2, 5-9: 2, 1-4: 1)Health Care and Social Assistance: Other Individual and Family Services (20-49: 3, 10-19: 2, 1-4: 2)Health Care and Social Assistance: Child Day Care Services (20-49: 2, 1-4: 2)Accommodation and Food Services: Limited-Service Restaurants (20-49: 2, 1-4: 1)Health Care and Social Assistance: Offices of Dentists (10-19: 3, 5-9: 1, 1-4: 1)Administrative and Support and Waste Management and Remediation Services: Janitorial Services (20-49: 1, 10-19: 1, 1-4: 3)
People in group quarters in 2010:
33 people in group homes intended for adults
9 people in group homes for juveniles (non-correctional)
9 people in residential treatment centers for adults
7 people in mental (psychiatric) hospitals and psychiatric units in other hospitals
6 people in correctional residential facilities
People in group quarters in 2000:
211 people in college dormitories (includes college quarters off campus)
38 people in homes for the mentally retarded
35 people in nursing homes
28 people in other group homes
10 people in homes for the mentally ill
9 people in hospitals/wards and hospices for chronically ill
9 people in hospices or homes for chronically ill
3 people in religious group quarters
Fatal accident statistics in 2010:
Fatal accident count: 1Vehicles involved in fatal accidents: 2Fatal accidents caused by drunken drivers: 0Fatalities: 1Persons involved in fatal accidents: 2Pedestrians involved in fatal accidents: 0
Home Mortgage Disclosure Act Aggregated Statistics For Year 2009(Based on 5 full and 6 partial tracts) A) FHA, FSA/RHS & VA B) Conventional C) Refinancings D) Home Improvement Loans F) Non-occupant Loans on G) Loans On Manufactured Number Average Value Number Average Value Number Average Value Number Average Value Number Average Value Number Average Value
LOANS ORIGINATED 150 $88,615 68 $102,011 340 $90,270 43 $14,863 16 $39,513 0 $0 APPLICATIONS APPROVED, NOT ACCEPTED 7 $61,137 4 $34,075 39 $94,849 7 $9,069 4 $32,405 0 $0 APPLICATIONS DENIED 37 $70,801 21 $65,178 169 $83,215 37 $10,470 11 $63,086 4 $55,312 APPLICATIONS WITHDRAWN 15 $87,264 8 $73,222 100 $80,332 19 $32,667 9 $36,304 0 $0 FILES CLOSED FOR INCOMPLETENESS 2 $135,540 5 $87,038 14 $84,535 0 $0 1 $32,000 0 $0
Aggregated Statistics For Year 2008(Based on 5 full and 6 partial tracts) A) FHA, FSA/RHS & VA B) Conventional C) Refinancings D) Home Improvement Loans E) Loans on Dwellings For 5+ Families F) Non-occupant Loans on G) Loans On Manufactured Number Average Value Number Average Value Number Average Value Number Average Value Number Average Value Number Average Value Number Average Value
LOANS ORIGINATED 156 $78,150 98 $62,690 233 $80,371 55 $13,819 2 $323,180 53 $52,270 0 $0 APPLICATIONS APPROVED, NOT ACCEPTED 13 $78,864 20 $91,115 30 $59,120 13 $14,195 0 $0 6 $39,948 0 $0 APPLICATIONS DENIED 47 $65,335 49 $64,793 272 $75,164 95 $32,679 0 $0 46 $47,538 2 $48,835 APPLICATIONS WITHDRAWN 19 $77,573 12 $98,412 91 $78,073 5 $42,840 0 $0 11 $51,683 0 $0 FILES CLOSED FOR INCOMPLETENESS 5 $79,374 11 $75,618 30 $84,877 7 $15,307 0 $0 4 $51,438 0 $0
Aggregated Statistics For Year 2007(Based on 5 full and 6 partial tracts) A) FHA, FSA/RHS & VA B) Conventional C) Refinancings D) Home Improvement Loans E) Loans on Dwellings For 5+ Families F) Non-occupant Loans on G) Loans On Manufactured Number Average Value Number Average Value Number Average Value Number Average Value Number Average Value Number Average Value Number Average Value
LOANS ORIGINATED 85 $74,787 365 $75,866 348 $71,425 71 $21,496 2 $196,400 130 $54,335 0 $0 APPLICATIONS APPROVED, NOT ACCEPTED 0 $0 50 $63,516 87 $60,688 26 $17,706 0 $0 32 $52,278 0 $0 APPLICATIONS DENIED 5 $61,410 148 $65,112 315 $75,045 148 $21,732 1 $462,120 111 $59,948 2 $20,370 APPLICATIONS WITHDRAWN 8 $63,624 34 $59,337 124 $68,071 29 $21,747 1 $462,120 28 $47,409 0 $0 FILES CLOSED FOR INCOMPLETENESS 0 $0 11 $68,814 67 $86,612 6 $124,190 0 $0 10 $51,526 0 $0
Aggregated Statistics For Year 2006(Based on 5 full and 6 partial tracts) A) FHA, FSA/RHS & VA B) Conventional C) Refinancings D) Home Improvement Loans E) Loans on Dwellings For 5+ Families F) Non-occupant Loans on G) Loans On Manufactured Number Average Value Number Average Value Number Average Value Number Average Value Number Average Value Number Average Value Number Average Value
LOANS ORIGINATED 80 $69,672 593 $66,804 452 $72,891 80 $34,828 1 $35,080 283 $56,769 2 $96,360 APPLICATIONS APPROVED, NOT ACCEPTED 0 $0 84 $83,477 104 $64,851 28 $26,530 1 $72,400 46 $52,760 0 $0 APPLICATIONS DENIED 10 $62,220 255 $56,508 507 $74,098 136 $21,142 1 $34,320 165 $50,338 0 $0 APPLICATIONS WITHDRAWN 6 $54,285 89 $76,396 202 $70,239 11 $49,705 0 $0 50 $52,738 0 $0 FILES CLOSED FOR INCOMPLETENESS 4 $60,792 22 $65,838 80 $92,856 0 $0 0 $0 3 $54,937 0 $0
Aggregated Statistics For Year 2005(Based on 5 full and 6 partial tracts) A) FHA, FSA/RHS & VA B) Conventional C) Refinancings D) Home Improvement Loans E) Loans on Dwellings For 5+ Families F) Non-occupant Loans on G) Loans On Manufactured Number Average Value Number Average Value Number Average Value Number Average Value Number Average Value Number Average Value Number Average Value
LOANS ORIGINATED 77 $78,369 557 $67,524 581 $66,109 73 $32,870 1 $30,810 248 $48,545 1 $42,810 APPLICATIONS APPROVED, NOT ACCEPTED 14 $63,729 60 $70,466 131 $68,614 18 $42,131 0 $0 28 $45,553 0 $0 APPLICATIONS DENIED 19 $76,362 165 $59,408 584 $68,625 145 $25,275 0 $0 111 $46,782 4 $36,552 APPLICATIONS WITHDRAWN 2 $71,525 96 $76,971 346 $78,277 47 $136,102 1 $34,320 56 $62,582 0 $0 FILES CLOSED FOR INCOMPLETENESS 4 $79,598 17 $61,738 50 $73,007 3 $16,480 0 $0 8 $46,140 2 $39,735
Aggregated Statistics For Year 2004(Based on 5 full and 6 partial tracts) A) FHA, FSA/RHS & VA B) Conventional C) Refinancings D) Home Improvement Loans E) Loans on Dwellings For 5+ Families F) Non-occupant Loans on G) Loans On Manufactured Number Average Value Number Average Value Number Average Value Number Average Value Number Average Value Number Average Value Number Average Value
LOANS ORIGINATED 117 $70,202 459 $62,624 680 $68,600 70 $29,559 1 $32,350 226 $54,037 4 $79,115 APPLICATIONS APPROVED, NOT ACCEPTED 8 $55,700 72 $64,961 174 $71,407 16 $38,065 0 $0 41 $49,057 4 $50,328 APPLICATIONS DENIED 22 $62,088 138 $55,870 585 $69,760 124 $19,926 0 $0 119 $50,757 7 $25,191 APPLICATIONS WITHDRAWN 4 $59,795 81 $51,634 305 $73,741 10 $68,062 0 $0 46 $49,237 0 $0 FILES CLOSED FOR INCOMPLETENESS 2 $65,735 21 $55,942 45 $73,688 3 $22,633 0 $0 14 $39,984 0 $0
Aggregated Statistics For Year 2003(Based on 5 full and 6 partial tracts) A) FHA, FSA/RHS & VA B) Conventional C) Refinancings D) Home Improvement Loans E) Loans on Dwellings For 5+ Families F) Non-occupant Loans on Number Average Value Number Average Value Number Average Value Number Average Value Number Average Value Number Average Value
LOANS ORIGINATED 143 $69,967 322 $68,985 1,199 $69,812 67 $18,337 0 $0 231 $51,509 APPLICATIONS APPROVED, NOT ACCEPTED 11 $61,707 34 $71,621 174 $67,236 11 $11,507 0 $0 19 $44,940 APPLICATIONS DENIED 17 $59,682 118 $54,788 623 $60,916 83 $12,101 0 $0 97 $52,214 APPLICATIONS WITHDRAWN 14 $54,594 28 $56,950 345 $65,105 5 $25,710 1 $91,510 28 $53,580 FILES CLOSED FOR INCOMPLETENESS 1 $79,990 17 $77,522 88 $71,355 3 $15,963 0 $0 17 $48,063
Aggregated Statistics For Year 2002(Based on 5 full and 6 partial tracts) A) FHA, FSA/RHS & VA B) Conventional C) Refinancings D) Home Improvement Loans E) Loans on Dwellings For 5+ Families F) Non-occupant Loans on Number Average Value Number Average Value Number Average Value Number Average Value Number Average Value Number Average Value
LOANS ORIGINATED 205 $66,413 312 $70,231 1,103 $68,170 77 $17,773 0 $0 254 $45,744 APPLICATIONS APPROVED, NOT ACCEPTED 1 $50,560 34 $62,747 191 $69,915 22 $24,658 0 $0 16 $40,650 APPLICATIONS DENIED 23 $63,893 71 $50,120 461 $54,100 80 $14,689 1 $731,690 81 $35,668 APPLICATIONS WITHDRAWN 2 $78,730 16 $51,157 133 $61,812 1 $12,100 0 $0 26 $53,772 FILES CLOSED FOR INCOMPLETENESS 9 $67,013 13 $54,601 152 $62,230 0 $0 0 $0 10 $35,287
Aggregated Statistics For Year 2001(Based on 5 full and 6 partial tracts) A) FHA, FSA/RHS & VA B) Conventional C) Refinancings D) Home Improvement Loans E) Loans on Dwellings For 5+ Families F) Non-occupant Loans on Number Average Value Number Average Value Number Average Value Number Average Value Number Average Value Number Average Value
LOANS ORIGINATED 222 $65,596 246 $62,043 830 $62,949 134 $13,489 4 $46,612 146 $40,496 APPLICATIONS APPROVED, NOT ACCEPTED 9 $64,537 36 $50,168 164 $60,676 26 $10,210 0 $0 33 $39,928 APPLICATIONS DENIED 9 $96,854 137 $49,384 538 $52,111 129 $10,738 0 $0 54 $53,909 APPLICATIONS WITHDRAWN 7 $97,404 33 $59,763 213 $61,813 11 $38,975 0 $0 24 $42,098 FILES CLOSED FOR INCOMPLETENESS 8 $61,538 29 $46,837 63 $71,344 1 $25,000 0 $0 7 $28,021
Aggregated Statistics For Year 2000(Based on 5 full and 6 partial tracts) A) FHA, FSA/RHS & VA B) Conventional C) Refinancings D) Home Improvement Loans E) Loans on Dwellings For 5+ Families F) Non-occupant Loans on Number Average Value Number Average Value Number Average Value Number Average Value Number Average Value Number Average Value
LOANS ORIGINATED 279 $59,714 319 $61,940 421 $47,125 166 $13,163 2 $99,340 102 $37,845 APPLICATIONS APPROVED, NOT ACCEPTED 15 $61,615 60 $60,553 185 $51,286 43 $12,616 0 $0 18 $46,170 APPLICATIONS DENIED 25 $57,768 138 $50,039 474 $49,165 180 $13,455 0 $0 52 $38,516 APPLICATIONS WITHDRAWN 1 $81,960 29 $51,654 200 $49,683 16 $19,725 0 $0 8 $40,520 FILES CLOSED FOR INCOMPLETENESS 6 $62,338 8 $71,894 52 $51,521 1 $64,240 0 $0 2 $31,455
Aggregated Statistics For Year 1999(Based on 3 full and 3 partial tracts) A) FHA, FSA/RHS & VA B) Conventional C) Refinancings D) Home Improvement Loans E) Loans on Dwellings For 5+ Families F) Non-occupant Loans on Number Average Value Number Average Value Number Average Value Number Average Value Number Average Value Number Average Value
LOANS ORIGINATED 121 $60,307 188 $68,239 338 $49,161 74 $15,557 2 $572,845 80 $40,520 APPLICATIONS APPROVED, NOT ACCEPTED 5 $49,526 29 $59,562 144 $44,122 24 $14,032 0 $0 20 $41,890 APPLICATIONS DENIED 14 $66,498 69 $48,938 276 $44,395 77 $10,143 0 $0 27 $41,040 APPLICATIONS WITHDRAWN 8 $52,448 34 $54,538 137 $50,327 15 $35,628 0 $0 9 $47,846 FILES CLOSED FOR INCOMPLETENESS 4 $56,342 7 $54,597 35 $51,193 2 $19,975 0 $0 7 $46,190
Private Mortgage Insurance Companies Aggregated Statistics For Year 2009(Based on 5 full and 6 partial tracts) A) Conventional B) Refinancings Number Average Value Number Average Value
LOANS ORIGINATED 27 $93,617 22 $108,672 APPLICATIONS APPROVED, NOT ACCEPTED 5 $77,456 9 $84,660 APPLICATIONS DENIED 3 $86,493 2 $240,145 APPLICATIONS WITHDRAWN 3 $109,213 4 $65,188 FILES CLOSED FOR INCOMPLETENESS 0 $0 0 $0
Aggregated Statistics For Year 2008(Based on 5 full and 6 partial tracts) A) Conventional B) Refinancings C) Non-occupant Loans on Number Average Value Number Average Value Number Average Value
LOANS ORIGINATED 62 $70,081 26 $89,032 10 $42,787 APPLICATIONS APPROVED, NOT ACCEPTED 26 $63,363 21 $85,858 11 $63,139 APPLICATIONS DENIED 10 $89,888 2 $78,730 3 $84,917 APPLICATIONS WITHDRAWN 2 $50,825 2 $78,730 0 $0 FILES CLOSED FOR INCOMPLETENESS 1 $79,050 0 $0 1 $52,370
Aggregated Statistics For Year 2007(Based on 5 full and 6 partial tracts) A) Conventional B) Refinancings C) Non-occupant Loans on D) Loans On Manufactured Number Average Value Number Average Value Number Average Value Number Average Value
LOANS ORIGINATED 213 $74,921 73 $81,788 30 $63,984 0 $0 APPLICATIONS APPROVED, NOT ACCEPTED 20 $83,294 11 $75,827 1 $52,000 0 $0 APPLICATIONS DENIED 7 $48,966 0 $0 0 $0 2 $25,910 APPLICATIONS WITHDRAWN 7 $66,101 4 $87,202 0 $0 0 $0 FILES CLOSED FOR INCOMPLETENESS 3 $73,310 2 $82,450 2 $80,465 0 $0
Aggregated Statistics For Year 2006(Based on 5 full and 6 partial tracts) A) Conventional B) Refinancings C) Non-occupant Loans on Number Average Value Number Average Value Number Average Value
LOANS ORIGINATED 200 $70,266 54 $81,051 37 $47,671 APPLICATIONS APPROVED, NOT ACCEPTED 22 $61,839 5 $109,388 10 $47,523 APPLICATIONS DENIED 2 $84,635 2 $168,425 1 $29,270 APPLICATIONS WITHDRAWN 10 $53,898 13 $62,652 3 $27,043 FILES CLOSED FOR INCOMPLETENESS 0 $0 0 $0 0 $0
Aggregated Statistics For Year 2005(Based on 5 full and 6 partial tracts) A) Conventional B) Refinancings C) Non-occupant Loans on Number Average Value Number Average Value Number Average Value
LOANS ORIGINATED 165 $63,176 66 $68,198 45 $45,006 APPLICATIONS APPROVED, NOT ACCEPTED 21 $61,409 28 $67,352 12 $50,617 APPLICATIONS DENIED 0 $0 2 $71,330 1 $39,660 APPLICATIONS WITHDRAWN 8 $81,905 10 $74,897 2 $40,600 FILES CLOSED FOR INCOMPLETENESS 0 $0 4 $99,162 0 $0
Aggregated Statistics For Year 2004(Based on 5 full and 6 partial tracts) A) Conventional B) Refinancings C) Non-occupant Loans on Number Average Value Number Average Value Number Average Value
LOANS ORIGINATED 182 $64,876 97 $82,491 54 $44,435 APPLICATIONS APPROVED, NOT ACCEPTED 31 $68,740 30 $79,416 6 $48,283 APPLICATIONS DENIED 3 $57,897 0 $0 3 $57,897 APPLICATIONS WITHDRAWN 10 $58,468 5 $65,398 2 $41,885 FILES CLOSED FOR INCOMPLETENESS 1 $45,000 0 $0 1 $45,000
Aggregated Statistics For Year 2003(Based on 5 full and 6 partial tracts) A) Conventional B) Refinancings C) Non-occupant Loans on Number Average Value Number Average Value Number Average Value
LOANS ORIGINATED 120 $73,610 175 $79,937 38 $44,415 APPLICATIONS APPROVED, NOT ACCEPTED 20 $58,890 59 $77,407 7 $42,370 APPLICATIONS DENIED 3 $34,287 7 $113,127 5 $37,252 APPLICATIONS WITHDRAWN 7 $67,101 12 $73,582 7 $48,906 FILES CLOSED FOR INCOMPLETENESS 2 $77,485 4 $107,565 1 $27,450
Aggregated Statistics For Year 2002(Based on 5 full and 6 partial tracts) A) Conventional B) Refinancings C) Non-occupant Loans on Number Average Value Number Average Value Number Average Value
LOANS ORIGINATED 118 $64,586 180 $75,486 50 $40,735 APPLICATIONS APPROVED, NOT ACCEPTED 34 $65,470 23 $61,582 6 $36,510 APPLICATIONS DENIED 5 $60,936 6 $88,287 1 $30,000 APPLICATIONS WITHDRAWN 6 $61,790 15 $85,639 4 $38,282 FILES CLOSED FOR INCOMPLETENESS 0 $0 0 $0 0 $0
Aggregated Statistics For Year 2001(Based on 5 full and 6 partial tracts) A) Conventional B) Refinancings C) Non-occupant Loans on Number Average Value Number Average Value Number Average Value
LOANS ORIGINATED 105 $73,920 111 $79,435 25 $45,605 APPLICATIONS APPROVED, NOT ACCEPTED 22 $77,130 17 $89,648 3 $25,313 APPLICATIONS DENIED 4 $31,848 5 $69,526 4 $38,720 APPLICATIONS WITHDRAWN 2 $32,780 3 $80,053 0 $0 FILES CLOSED FOR INCOMPLETENESS 0 $0 0 $0 0 $0
Aggregated Statistics For Year 2000(Based on 5 full and 6 partial tracts) A) Conventional B) Refinancings C) Non-occupant Loans on Number Average Value Number Average Value Number Average Value
LOANS ORIGINATED 134 $62,649 34 $61,462 30 $38,734 APPLICATIONS APPROVED, NOT ACCEPTED 17 $78,191 4 $46,295 0 $0 APPLICATIONS DENIED 4 $51,018 4 $40,785 1 $37,000 APPLICATIONS WITHDRAWN 4 $69,165 2 $33,885 0 $0 FILES CLOSED FOR INCOMPLETENESS 2 $36,755 0 $0 0 $0
Aggregated Statistics For Year 1999(Based on 3 full and 3 partial tracts) A) Conventional B) Refinancings C) Non-occupant Loans on Number Average Value Number Average Value Number Average Value
LOANS ORIGINATED 89 $69,579 39 $63,016 14 $40,205 APPLICATIONS APPROVED, NOT ACCEPTED 9 $79,458 3 $45,880 0 $0 APPLICATIONS DENIED 2 $91,040 1 $81,800 0 $0 APPLICATIONS WITHDRAWN 1 $53,770 0 $0 0 $0 FILES CLOSED FOR INCOMPLETENESS 0 $0 0 $0 0 $0
2005 - 2018 National Fire Incident Reporting System (NFIRS) incidents See full 2006 National Fire Incident Reporting System statistics for zip code 46807, Indiana
Most common first names in zip code 46807 among deceased individuals Name Count Lived (average)
Mary 136 80.9 years John 132 74.4 years William 123 75.6 years Robert 121 71.5 years James 85 71.0 years Helen 78 79.8 years George 67 77.6 years Ruth 64 78.4 years Charles 63 76.7 years Paul 57 75.8 years
Most common last names in zip code 46807 among deceased individuals Last name Count Lived (average)
Miller 63 76.5 years Smith 43 72.2 years Johnson 39 77.9 years Brown 32 75.9 years Meyer 17 82.6 years Jones 17 73.0 years Williams 17 72.3 years Thomas 16 77.4 years Sullivan 16 79.3 years White 16 77.8 years
Businesses in zip code 46807
Name Count Name Count
CVS 1 Subway 1 KFC 1 Wendy's 1 Pizza Hut 1
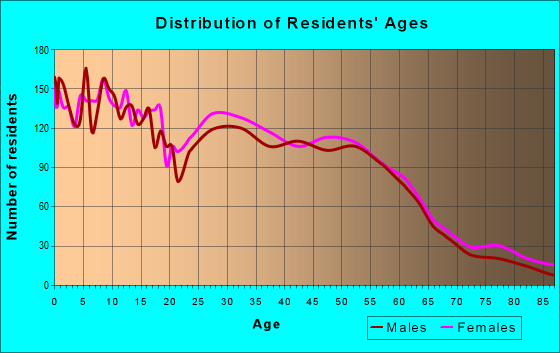
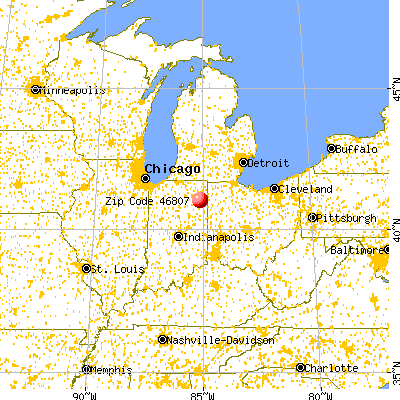


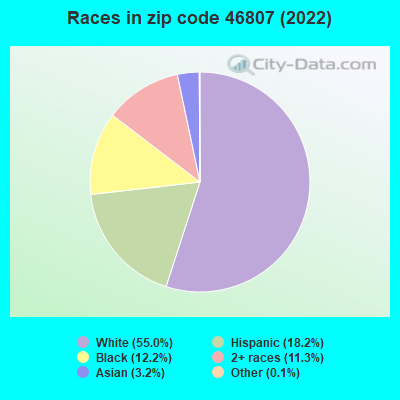


 Nearest zip codes: 46802, 46806, 46808, 46805, 46803, 46819.
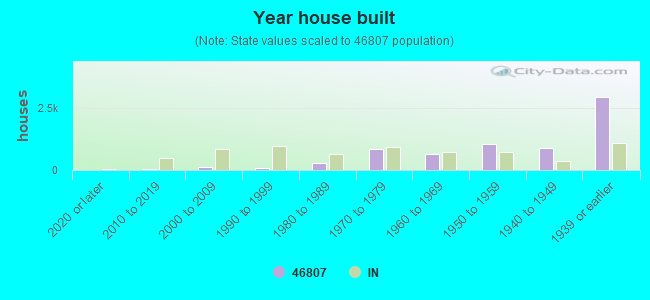

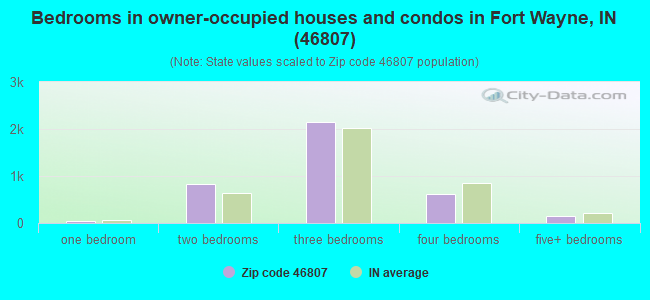
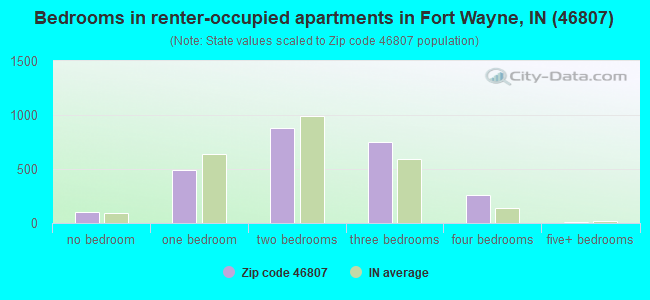
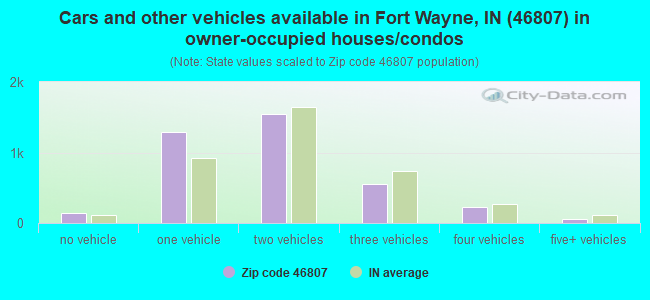
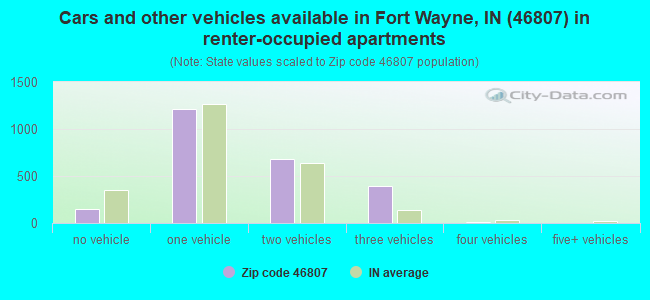


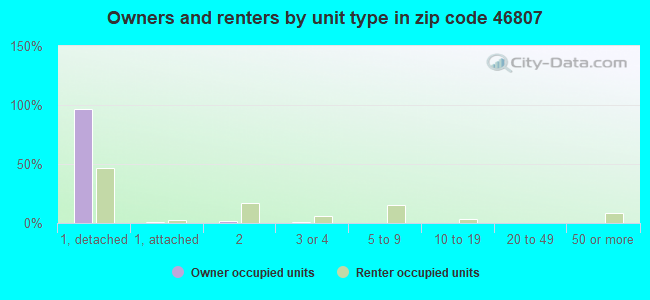
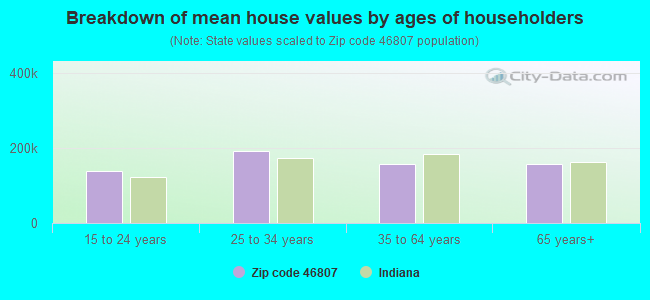


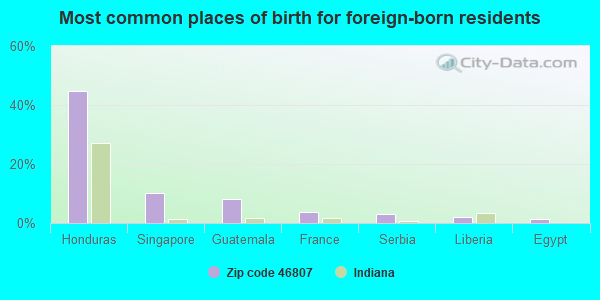
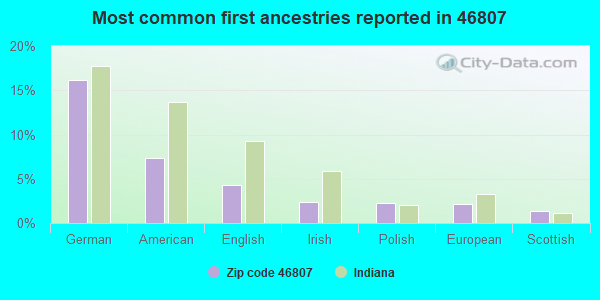
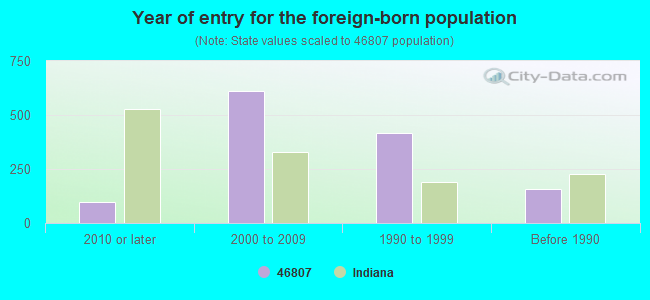


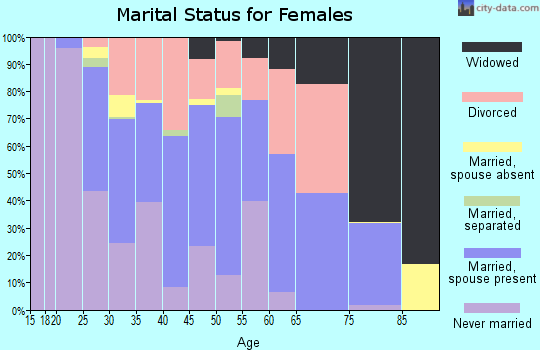
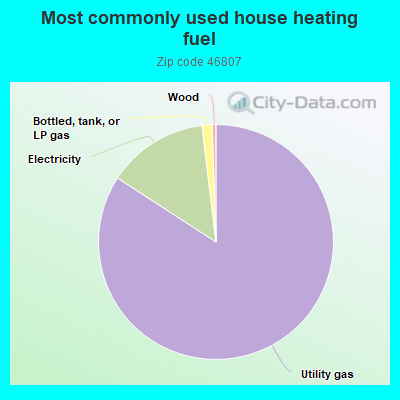
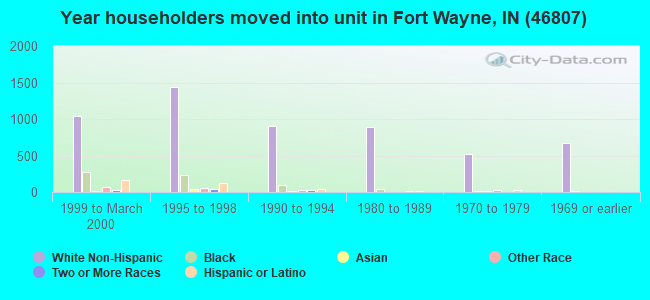
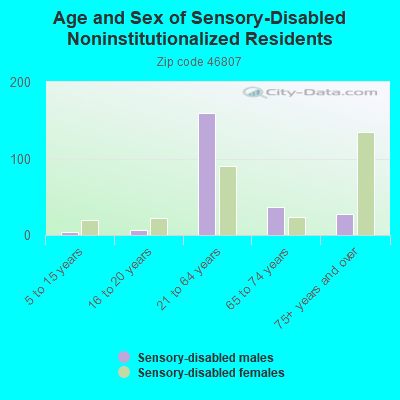
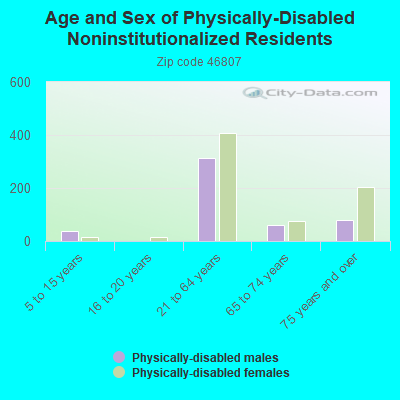
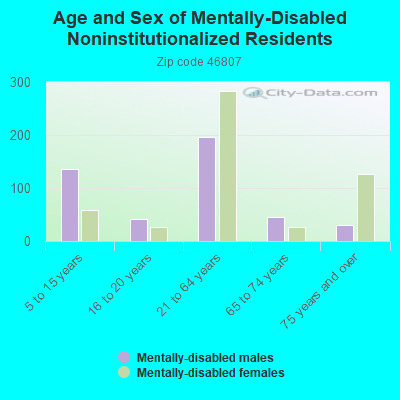
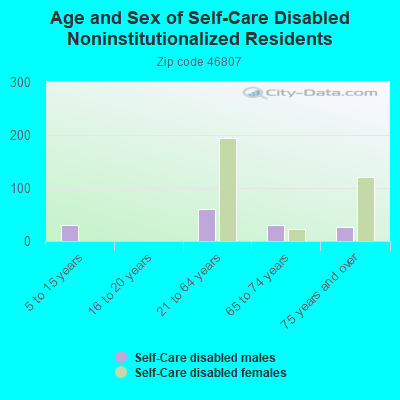
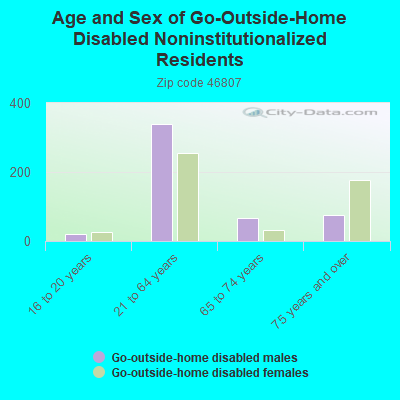
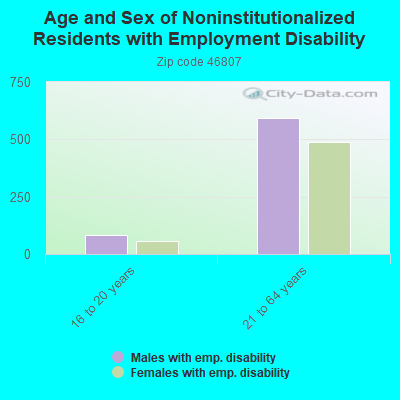
 According to the data from the years 2005 - 2018 the average number of fire incidents per year is 47. The highest number of fires - 71 took place in 2012, and the least - 16 in 2014. The data has a declining trend.
 When looking into fire subcategories, the most incidents belonged to: Structure Fires (47.9%), and Outside Fires (29.7%).