Estimated zip code population in 2022: 22,377 Zip code population in 2010: 21,306 Zip code population in 2000: 22,204
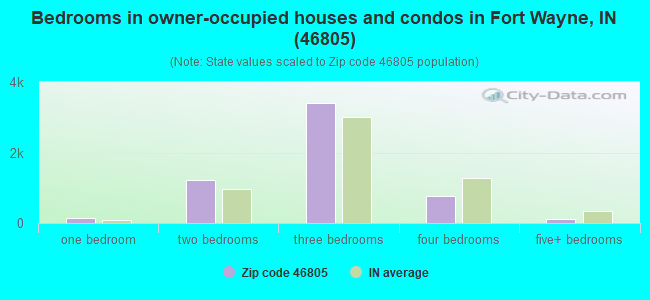
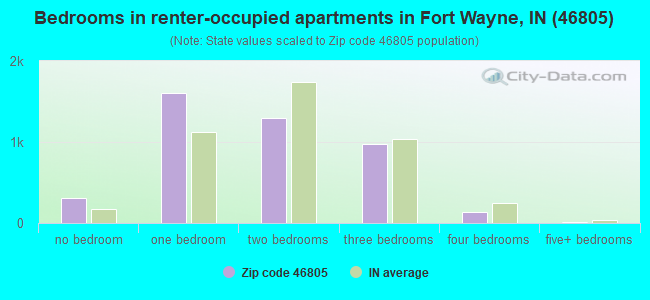
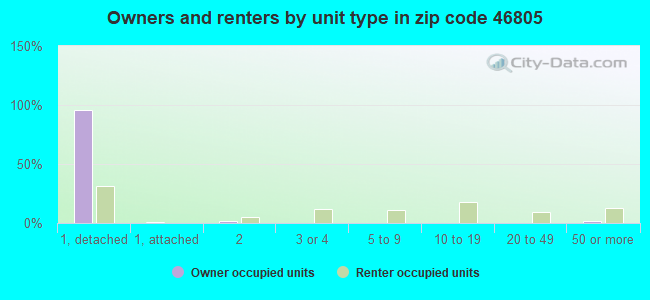
Houses and condos: 10,980 Renter-occupied apartments: 4,327
% of renters here:
43%
State:
29%
March 2022 cost of living index in zip code 46805: 82.6 (low, U.S. average is 100)
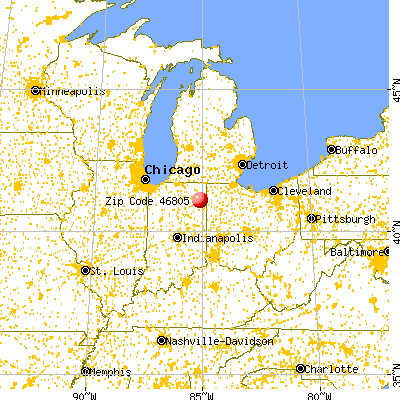
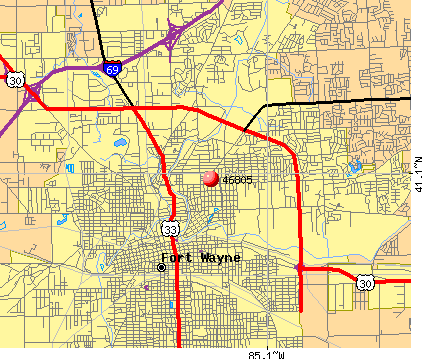
Land area: 6.4 sq. mi. Water area: 0.0 sq. mi.
Population density: 3,471 people per square mile
(average).
OSM Map
General Map
Google Map
MSN Map
OSM Map
General Map
Google Map
MSN Map
OSM Map
General Map
Google Map
MSN Map
OSM Map
General Map
Google Map
MSN Map
Please wait while loading the map...
Real estate property taxes paid for housing units in 2022:
This zip code:
0.8% ($1,046)
Indiana:
0.7% ($1,467)
Median real estate property taxes paid for housing units with mortgages in 2022: $1,133 (0.8%) Median real estate property taxes paid for housing units with no mortgage in 2022: $912 (0.7%)
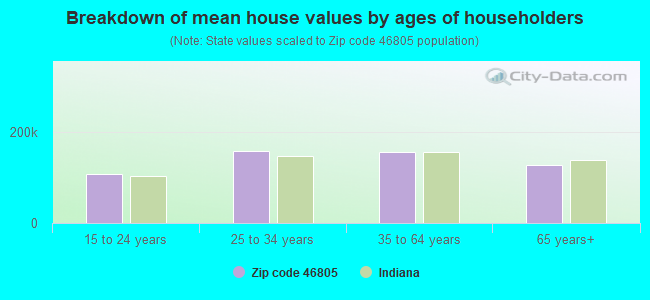
Estimated median house/condo value in 2022: $137,883
46805:
$137,883
Indiana:
$208,700
According to our research of Indiana and other state lists, there were 3 registered sex offenders living in 46805 zip code as of April 26, 2024. The ratio of all residents to sex offenders in zip code 46805 is 7,106 to 1. The ratio of registered sex offenders to all residents in this zip code is much lower than the state average.
Median resident age:
This zip code:
35.0 years
Indiana median age:
38.2 years
Average household size:
This zip code:
2.1 people
Indiana:
2.4 people
Averages for the 2020 tax year for zip code 46805, filed in 2021:
Average Adjusted Gross Income (AGI) in 2020: $43,087 (Individual Income Tax Returns)
Here:
$43,087
State:
$64,978
Salary/wage: $38,828 (reported on 87.1% of returns)
Here:
$38,828
State:
$55,245
(% of AGI for various income ranges: 1197.6% for AGIs below $25k, 3761.6% for AGIs $25k-50k, 6814.1% for AGIs $50k-75k, 9884.0% for AGIs $75k-100k, 16706.0% for AGIs $100k-200k, 70883.3% for AGIs over 200k)
Taxable interest for individuals: $781 (reported on 19.5% of returns)
This zip code:
$781
Indiana:
$1,351
(% of AGI for various income ranges: 6.0% for AGIs below $25k, 7.7% for AGIs $25k-50k, 23.9% for AGIs $50k-75k, 30.0% for AGIs $75k-100k, 64.6% for AGIs $100k-200k, 1773.3% for AGIs over 200k)
Ordinary dividends: $3,661 (reported on 11.0% of returns)
Here:
$3,661
State:
$5,827
(% of AGI for various income ranges: 14.3% for AGIs below $25k, 18.4% for AGIs $25k-50k, 49.2% for AGIs $50k-75k, 102.8% for AGIs $75k-100k, 297.7% for AGIs $100k-200k, 3590.0% for AGIs over 200k)
Net capital gain/loss in AGI: +$7,283 (reported on 9.8% of returns)
Here:
+$7,283
State:
+$17,730
(% of AGI for various income ranges: 2.4% for AGIs below $25k, 15.7% for AGIs $25k-50k, 45.4% for AGIs $50k-75k, 130.9% for AGIs $75k-100k, 478.3% for AGIs $100k-200k, 13470.0% for AGIs over 200k)
Profit/loss from business: +$8,349 (reported on 12.2% of returns)
Here:
+$8,349
State:
+$12,144
(% of AGI for various income ranges: 84.3% for AGIs below $25k, 80.6% for AGIs $25k-50k, 127.5% for AGIs $50k-75k, 234.7% for AGIs $75k-100k, 677.7% for AGIs $100k-200k, 2183.3% for AGIs over 200k)
Taxable individual retirement arrangement distribution: $12,619 (reported on 6.6% of returns)
46805:
$12,619
Indiana:
$18,302
(% of AGI for various income ranges: 41.8% for AGIs below $25k, 48.5% for AGIs $25k-50k, 134.5% for AGIs $50k-75k, 292.5% for AGIs $75k-100k, 533.7% for AGIs $100k-200k, 3746.7% for AGIs over 200k)
Total itemized deductions: $36,914 (reported on 2.1% of returns)
Here:
$36,914
State:
$35,601
(% of AGI for various income ranges: 18.9% for AGIs below $25k, 41.1% for AGIs $25k-50k, 91.2% for AGIs $50k-75k, 181.3% for AGIs $75k-100k, 515.1% for AGIs $100k-200k, 8653.3% for AGIs over 200k)
Charity contributions: $16,406 (reported on 1.6% of returns)
Here:
$16,406
State:
$15,596
(% of AGI for various income ranges: 4.3% for AGIs $25k-50k, 20.8% for AGIs $50k-75k, 53.6% for AGIs $75k-100k, 168.0% for AGIs $100k-200k, 5220.0% for AGIs over 200k)
Taxes paid: $5,945 (reported on 2.1% of returns)
46805:
$5,945
State:
$7,542
(% of AGI for various income ranges: 4.4% for AGIs $25k-50k, 14.5% for AGIs $50k-75k, 26.6% for AGIs $75k-100k, 111.1% for AGIs $100k-200k, 1643.3% for AGIs over 200k)
Earned income credit: $2,187 (reported on 21.4% of returns)
Here:
$2,187
State:
$2,298
(% of AGI for various income ranges: 97.6% for AGIs below $25k, 62.5% for AGIs $25k-50k, 2.4% for AGIs $50k-75k)
Percentage of individuals using paid preparers for their 2020 taxes: 93.6%
Here:
94%
State:
94%
(% for various income ranges: 92.5% for AGIs below $25k, 94.4% for AGIs $25k-50k, 94.5% for AGIs $50k-75k, 94.5% for AGIs $75k-100k, 93.1% for AGIs $100k-200k, 100.0% for AGIs over 200k)
Averages for the 2012 tax year for zip code 46805, filed in 2013:
Average Adjusted Gross Income (AGI) in 2012: $34,984 (Individual Income Tax Returns)
Here:
$34,984
State:
$52,932
Salary/wage: $31,096 (reported on 85.4% of returns)
Here:
$31,096
State:
$45,173
(% of AGI for various income ranges: 77.2% for AGIs below $25k, 85.4% for AGIs $25k-50k, 85.2% for AGIs $50k-75k, 80.7% for AGIs $75k-100k, 71.1% for AGIs $100k-200k, 30.2% for AGIs over 200k)
Taxable interest for individuals: $884 (reported on 23.6% of returns)
This zip code:
$884
Indiana:
$1,311
(% of AGI for various income ranges: 0.8% for AGIs below $25k, 0.5% for AGIs $25k-50k, 0.4% for AGIs $50k-75k, 0.4% for AGIs $75k-100k, 0.8% for AGIs $100k-200k, 1.1% for AGIs over 200k)
Ordinary dividends: $3,518 (reported on 13.0% of returns)
Here:
$3,518
State:
$4,690
(% of AGI for various income ranges: 1.1% for AGIs below $25k, 0.6% for AGIs $25k-50k, 0.9% for AGIs $50k-75k, 1.3% for AGIs $75k-100k, 2.2% for AGIs $100k-200k, 3.3% for AGIs over 200k)
Net capital gain/loss in AGI: +$5,834 (reported on 8.9% of returns)
Here:
+$5,834
State:
+$10,406
(% of AGI for various income ranges: 0.2% for AGIs $25k-50k, 0.3% for AGIs $50k-75k, 0.6% for AGIs $75k-100k, 2.4% for AGIs $100k-200k, 10.0% for AGIs over 200k)
Profit/loss from business: +$9,419 (reported on 11.7% of returns)
Here:
+$9,419
State:
+$11,105
(% of AGI for various income ranges: 5.7% for AGIs below $25k, 2.5% for AGIs $25k-50k, 2.1% for AGIs $50k-75k, 1.8% for AGIs $75k-100k, 6.7% for AGIs $100k-200k)
Taxable individual retirement arrangement distribution: $10,029 (reported on 8.6% of returns)
46805:
$10,029
Indiana:
$13,841
(% of AGI for various income ranges: 2.8% for AGIs below $25k, 2.0% for AGIs $25k-50k, 2.2% for AGIs $50k-75k, 3.1% for AGIs $75k-100k, 5.1% for AGIs $100k-200k)
Self-employment retirement plans: $23,150 (reported on 0.2% of returns)
46805:
$23,150
Indiana:
$21,482
Total itemized deductions: $17,195 (21% of AGI, reported on 13.9% of returns)
Here:
$17,195
State:
$20,913
Here:
20.9% of AGI
State:
18.2% of AGI
(% of AGI for various income ranges: 4.3% for AGIs below $25k, 4.9% for AGIs $25k-50k, 6.4% for AGIs $50k-75k, 7.2% for AGIs $75k-100k, 10.1% for AGIs $100k-200k, 13.2% for AGIs over 200k)
Charity contributions: $4,165 (reported on 10.5% of returns)
Here:
$4,165
State:
$4,697
(% of AGI for various income ranges: 0.5% for AGIs below $25k, 0.7% for AGIs $25k-50k, 1.2% for AGIs $50k-75k, 1.7% for AGIs $75k-100k, 2.5% for AGIs $100k-200k, 2.3% for AGIs over 200k)
Taxes paid: $4,946 (reported on 13.9% of returns)
46805:
$4,946
State:
$7,456
(% of AGI for various income ranges: 0.5% for AGIs below $25k, 1.1% for AGIs $25k-50k, 1.8% for AGIs $50k-75k, 2.1% for AGIs $75k-100k, 3.6% for AGIs $100k-200k, 5.3% for AGIs over 200k)
Earned income credit: $2,219 (reported on 27.6% of returns)
Here:
$2,219
State:
$2,265
(% of AGI for various income ranges: 7.5% for AGIs below $25k, 1.3% for AGIs $25k-50k)
Percentage of individuals using paid preparers for their 2012 taxes: 41.1%
Here:
41%
State:
53%
(% for various income ranges: 38.2% for AGIs below $25k, 41.1% for AGIs $25k-50k, 43.9% for AGIs $50k-75k, 46.8% for AGIs $75k-100k, 58.1% for AGIs $100k-200k, 85.7% for AGIs over 200k)
Averages for the 2004 tax year for zip code 46805, filed in 2005:
Average Adjusted Gross Income (AGI) in 2004: $31,930 (Individual Income Tax Returns)
Here:
$31,930
State:
$44,790
Salary/wage: $29,321 (reported on 86.8% of returns)
Here:
$29,321
State:
$39,615
(% of AGI for various income ranges: 87.6% for AGIs below $10k, 80.9% for AGIs $10k-25k, 87.3% for AGIs $25k-50k, 86.0% for AGIs $50k-75k, 83.0% for AGIs $75k-100k, 51.8% for AGIs over 100k)
Taxable interest for individuals: $1,432 (reported on 35.3% of returns)
This zip code:
$1,432
Indiana:
$1,535
(% of AGI for various income ranges: 5.9% for AGIs below $10k, 1.9% for AGIs $10k-25k, 1.2% for AGIs $25k-50k, 1.2% for AGIs $50k-75k, 1.1% for AGIs $75k-100k, 2.0% for AGIs over 100k)
Taxable dividends: $3,271 (reported on 17.2% of returns)
Here:
$3,271
State:
$2,998
(% of AGI for various income ranges: 3.4% for AGIs below $10k, 1.4% for AGIs $10k-25k, 0.9% for AGIs $25k-50k, 1.0% for AGIs $50k-75k, 1.5% for AGIs $75k-100k, 4.5% for AGIs over 100k)
Net capital gain/loss: +$3,919 (reported on 12.7% of returns)
Here:
+$3,919
State:
+$8,619
(% of AGI for various income ranges: -1.7% for AGIs below $10k, 0.3% for AGIs $10k-25k, 0.4% for AGIs $25k-50k, 0.8% for AGIs $50k-75k, 1.8% for AGIs $75k-100k, 6.5% for AGIs over 100k)
Profit/loss from business: +$7,719 (reported on 10.3% of returns)
Here:
+$7,719
State:
+$10,071
(% of AGI for various income ranges: 1.9% for AGIs below $10k, 2.8% for AGIs $10k-25k, 1.4% for AGIs $25k-50k, 1.5% for AGIs $50k-75k, 1.6% for AGIs $75k-100k, 6.3% for AGIs over 100k)
IRA payment deduction: $2,269 (reported on 2.0% of returns)
46805:
$2,269
Indiana:
$2,840
(% of AGI for various income ranges: 0.2% for AGIs $10k-25k, 0.2% for AGIs $25k-50k, 0.1% for AGIs $50k-75k, 0.1% for AGIs over 100k)
Self-employed pension: $16,385 (reported on 0.3% of returns)
Here:
$16,385
Indiana:
$15,305
Total itemized deductions: $13,937 (23% of AGI, reported on 22.4% of returns)
Here:
$13,937
State:
$17,065
Here:
23.2% of AGI
State:
19.5% of AGI
(% of AGI for various income ranges: 7.7% for AGIs below $10k, 6.9% for AGIs $10k-25k, 9.9% for AGIs $25k-50k, 10.2% for AGIs $50k-75k, 11.2% for AGIs $75k-100k, 11.5% for AGIs over 100k)
Charity contributions deductions: $3,349 (5% of AGI, reported on 18.3% of returns)
Here:
$3,349
State:
$3,550
Here:
5.1% of AGI
State:
3.8% of AGI
(% of AGI for various income ranges: 0.8% for AGIs below $10k, 0.8% for AGIs $10k-25k, 1.3% for AGIs $25k-50k, 2.0% for AGIs $50k-75k, 2.1% for AGIs $75k-100k, 4.3% for AGIs over 100k)
Total tax: $4,191 (reported on 70.0% of returns)
46805:
$4,191
State:
$6,914
(% of AGI for various income ranges: 1.7% for AGIs below $10k, 4.0% for AGIs $10k-25k, 7.0% for AGIs $25k-50k, 8.7% for AGIs $50k-75k, 10.5% for AGIs $75k-100k, 19.9% for AGIs over 100k)
Earned income credit: $1,574 (reported on 18.9% of returns)
Here:
$1,574
State:
$1,685
Percentage of individuals using paid preparers for their 2004 taxes: 50.2%
Here:
50%
State:
59%
(% for various income ranges: 46.4% for AGIs below $10k, 52.3% for AGIs $10k-25k, 48.0% for AGIs $25k-50k, 51.8% for AGIs $50k-75k, 55.4% for AGIs $75k-100k, 69.1% for AGIs over 100k)
Likely homosexual households (counted as self-reported same-sex unmarried-partner households)
Lesbian couples: 0.4% of all households
Gay men: 0.2% of all households
Household received Food Stamps/SNAP in the past 12 months: 1,391 Household did not receive Food Stamps/SNAP in the past 12 months: 8,659
Women who had a birth in the past 12 months: 333 (104 now married, 201 unmarried) Women who did not have a birth in the past 12 months: 5,460 (1,677 now married, 3,770 unmarried)
Housing units in zip code 46805 with a mortgage: 3,615 (305 second mortgage, 250 both second mortgage and home equity loan) Houses without a mortgage: 51
Median monthly owner costs for units with a mortgage: $960 Median monthly owner costs for units without a mortgage: $349
Residents with income below the poverty level in 2022:
This zip code:
17.2%
Whole state:
12.6%
Residents with income below 50% of the poverty level in 2022:
This zip code:
10.4%
Whole state:
6.3%
Median number of rooms in houses and condos:
Here:
6.4
State:
6.6
Median number of rooms in apartments:
Here:
4.0
State:
4.3
Notable locations in this zip code not listed on our city pages
Notable locations in zip code 46805: Zollner Stadium (A), Fort Wayne Fire Department Station 10 (B), Allen County War Memorial Coliseum (C), Parkview Hospital Behavioral Health (D). Display/hide their locations on the map
Parks in zip code 46805 include: Johnny Appleseed Memorial Park (1), Bob Arnold Northside Park (2), Vesey Park (3), Lions Park (4), Lawton Park (5). Display/hide their locations on the map
2,609 married couples with children.
1,623 single-parent households (207 men, 1,416 women).
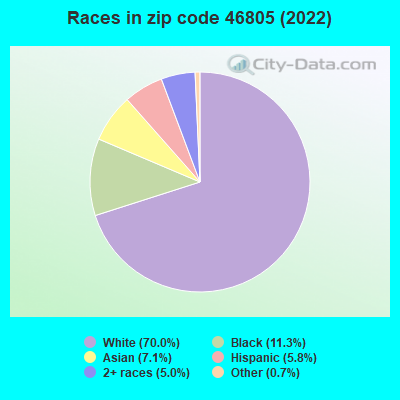
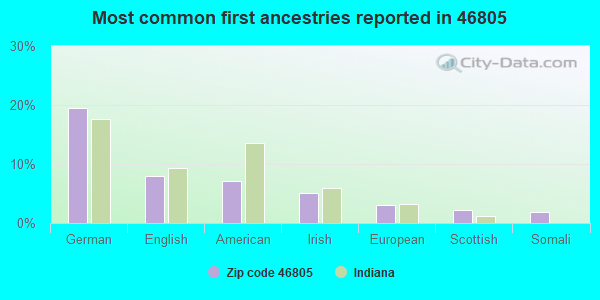
88.5% of residents of 46805 zip code speak English at home.
3.0% of residents speak Spanish at home (80% very well, 14% well, 6% not well).
1.3% of residents speak other Indo-European language at home (74% very well, 13% well, 13% not well).
5.1% of residents speak Asian or Pacific Island language at home (44% very well, 27% well, 20% not well, 10% not at all).
1.4% of residents speak other language at home (25% very well, 36% well, 39% not well).
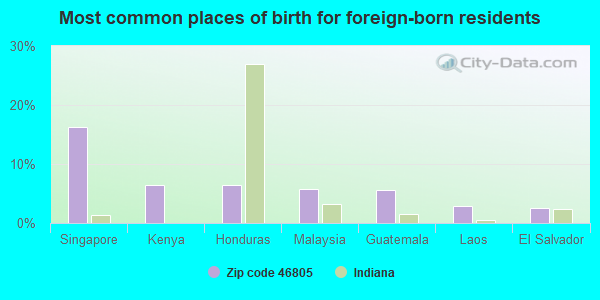
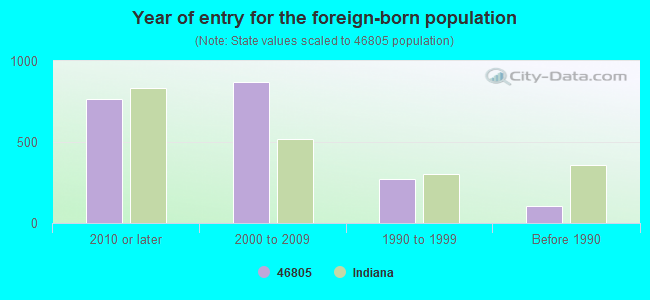
Foreign born population: 1,999 (8.9%) (48.0% of them are naturalized citizens)
Major facilities with environmental interests located in this zip code:
MORRILL MOTORS INCORPORATED (3685 NORTHROP ST. in FORT WAYNE, IN)
STATE MASTER (Indiana facility tracking) - UST-5953, UNDERGROUND STORAGE TANK PROGRAM, LUST-199804504, LEAKING STORAGE TANK (Resource Conservation and Recovery Act (tracking hazardous waste)) TRI REPORTER (Tracking of toxic chemicals releasing facilities) Business SIC classification: MOTORS AND GENERATORS
MUSIC MUSIC INC (1001 COLISEUM BLVD N in FORT WAYNE, IN)
STATE MASTER (Indiana facility tracking) - UST-3297, UNDERGROUND STORAGE TANK PROGRAM (Resource Conservation and Recovery Act (tracking hazardous waste)) Organizations: VANDERFORD WILLIAM (CONTACT/OWNER)
Alternative names: EZ CAR CREDIT CORP
PARKVIEW MEMORIAL HOSPITAL (2200 RANDALLIA DR in FORT WAYNE, IN)
AIR MAJOR (AIRS/AFS) STATE MASTER (Indiana facility tracking) - ACES-OP-00300272, AIR PROGRAM, UST-7697, UNDERGROUND STORAGE TANK PROGRAM CRITERIA AND HAZARDOUS AIR POLLUTANT INVENTORY (Inventory of air pollution sources) Conditionally Exempt Small Quantity Generators, less than 100 kg/month of hazardous waste (Resource Conservation and Recovery Act (tracking hazardous waste)) - notification Business SIC and NAICS classification: GENERAL MEDICAL AND SURGICAL HOSPITALS Organizations: PARKVIEW HOSPITAL (CONTACT/OWNER)
Alternative names: PARKVIEW HOSPITAL
GORDON FOOD SERVICE INC (4621 SPEEDWAY DR in FORT WAYNE, IN)
STATE MASTER (Indiana facility tracking) - CRTK-21069, EPCRA, LUST-199708530, LEAKING STORAGE TANK, UST-2205, UNDERGROUND STORAGE TANK PROGRAM (Resource Conservation and Recovery Act (tracking hazardous waste)) Organizations: GORDON FOOD SERVICES INC (CONTACT/OWNER)
ALLEN COUNTY MEMORIAL COLISEUM (4000 PARNELL AVE in FORT WAYNE, IN)
STATE MASTER (Indiana facility tracking) - CRTK-7935, EPCRA, UST-9636, UNDERGROUND STORAGE TANK PROGRAM (Resource Conservation and Recovery Act (tracking hazardous waste)) Organizations: ALLEN CO COMMISSIONERS (CONTACT/OWNER)
Alternative names: ALLEN CO MEMORIAL COLISEUM
GOODYEAR AUTO SERVICE CTR (4106 COLDWATER RD in FORT WAYNE, IN)
STATE MASTER (Indiana facility tracking) - LUST-199602516, LEAKING STORAGE TANK, UST-2133, UNDERGROUND STORAGE TANK PROGRAM Conditionally Exempt Small Quantity Generators, less than 100 kg/month of hazardous waste (Resource Conservation and Recovery Act (tracking hazardous waste)) Business NAICS classification: GENERAL AUTOMOTIVE REPAIR.; AUTOMOTIVE TRANSMISSION REPAIR. Organizations: GOODYEAR ASC #6769 (CONTACT/OPERATOR)
, GOODYEAR TIRE & RUBBER CO (CONTACT/OWNER)
SEARS 1830 6602 (4201 COLDWATER RD in FT WAYNE, IN)
STATE MASTER (Indiana facility tracking) - LUST-199401503, LEAKING STORAGE TANK, UST-14572, UNDERGROUND STORAGE TANK PROGRAM Conditionally Exempt Small Quantity Generators, less than 100 kg/month of hazardous waste (Resource Conservation and Recovery Act (tracking hazardous waste)) Business NAICS classification: AUTOMOTIVE OIL CHANGE AND LUBRICATION SHOPS. Organizations: SEARS 1830/6602 (CONTACT/OPERATOR)
, SEARS ROEBUCK & CO (CONTACT/OWNER)
Alternative names: SEARS ROEBUCK AND CO
BRETWOOD MARATHON 2492 (3606 E STATE BLVD in FT WAYNE, IN)
STATE MASTER (Indiana facility tracking) - LUST-199308543, LEAKING STORAGE TANK, LUST-199811557, UST-5464, UNDERGROUND STORAGE TANK PROGRAM (Resource Conservation and Recovery Act (tracking hazardous waste)) Organizations: DIEMER JOHN P (CONTACT/OWNER)
Alternative names: BRETWOOD MARATHON #2492
PEP BOYS 394 (422 W COLESIUM BLVD in FORT WAYNE, IN)
STATE MASTER (Indiana facility tracking) - UST-16325, UNDERGROUND STORAGE TANK PROGRAM (Resource Conservation and Recovery Act (tracking hazardous waste)) Organizations: THE PEP BOYS MANNY MOE & JACK (CONTACT/OWNER)
MCMAHON TIRE INC (4201 COLDWATER RD in FORT WAYNE, IN)
STATE MASTER (Indiana facility tracking) - LUST-199709505, LEAKING STORAGE TANK, UST-7766, UNDERGROUND STORAGE TANK PROGRAM (Resource Conservation and Recovery Act (tracking hazardous waste)) Organizations: JC PENNEY CO INC (CONTACT/OWNER)
GRATZ BODY & PAINT SHOP INC (3930 COLDWATER RD in FORT WAYNE, IN)
STATE MASTER (Indiana facility tracking) - CRTK-5027, EPCRA Small Quantity Generators, between 100 kg and 1000 kg of hazardous waste/month (Resource Conservation and Recovery Act (tracking hazardous waste)) - notification Business NAICS classification: AUTOMOTIVE BODY, PAINT, AND INTERIOR REPAIR AND MAINTENANCE. Organizations: AL GRATZ BODY & PAINT SHOP INC (CONTACT/OPERATOR)
, GRATZ TIM L (CONTACT/OWNER)
Alternative names: AL GRATZ BODY AND PAINT SHOP INC
DIMENSION FORD NORTH (320 W COLISEUM BLVD in FORT WAYNE, IN)
STATE MASTER (Indiana facility tracking) - UST-15641, UNDERGROUND STORAGE TANK PROGRAM Small Quantity Generators, between 100 kg and 1000 kg of hazardous waste/month (Resource Conservation and Recovery Act (tracking hazardous waste)) - notification Organizations: BOB THOMAS (CONTACT/OPERATOR)
Alternative names: SUMMIT CITY FORD
PRAIRIE FARMS DAIRY (3400 LIMA RD in FORT WAYNE, IN)
STATE MASTER (Indiana facility tracking) - SPILL-198906043, RELEASE ASSESSMENT, CRTK-9065, EPCRA, LUST-199112537, LEAKING STORAGE TANK, UST-14556, UNDERGROUND STORAGE TANK PROGRAM COMPLIANCE ACTIVITY (Tracking inspections of insecticide, fungicide, and rodenticide, and toxic substances) TRI REPORTER (Tracking of toxic chemicals releasing facilities) Business SIC classification: FLUID MILK Alternative names: ALLEN DAIRY PRODUCTS, PRAIRIE FARMS DAIRY INC., DBA ALLEN DAIRY PRODUCTS INC.
Housing units lacking complete plumbing facilities: 0.9% Housing units lacking complete kitchen facilities: 1.5%
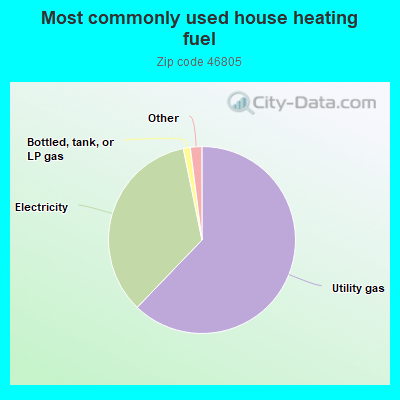
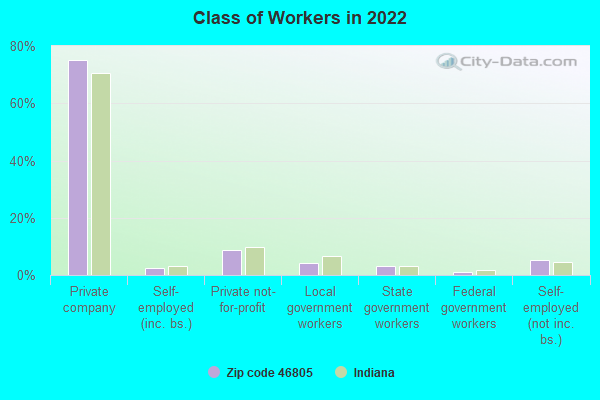
62.2%Utility gas
34.6%Electricity
1.2%Bottled, tank, or LP gas
0.7%No fuel used
0.6%Other fuel
Population in 1990: 22,657.
Place of birth for U.S.-born residents:
This state: 15,363
Northeast: 490
Midwest: 2,715
South: 1,248
West: 591
49% of the 46805 zip code residents lived in the same house 5 years ago. Out of people who lived in different houses, 69% lived in this county. Out of people who lived in different counties, 50% lived in Indiana.
84% of the 46805 zip code residents lived in the same house 1 year ago. Out of people who lived in different houses, 72% moved from this county. Out of people who lived in different houses, 9% moved from different county within same state. Out of people who lived in different houses, 10% moved from different state. Out of people who lived in different houses, 5% moved from abroad.
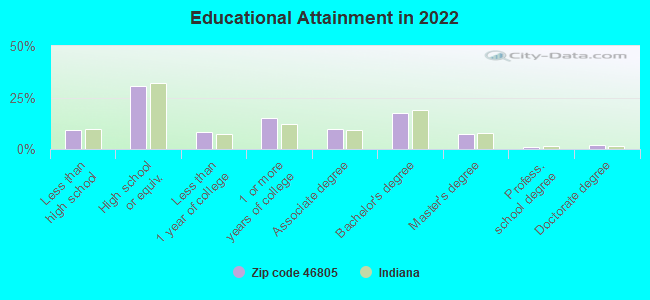
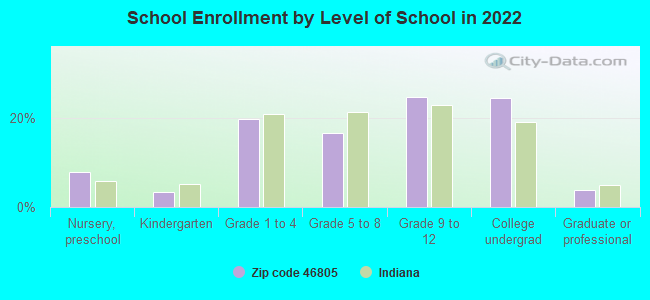
Private vs. public school enrollment:
Students in private schools in grades 1 to 8 (elementary and middle school): 493
Here:
30.4%
Indiana:
14.9%
Students in private schools in grades 9 to 12 (high school): 405
Here:
36.5%
Indiana:
11.4%
Students in private undergraduate colleges: 261
Here:
23.9%
Indiana:
22.3%
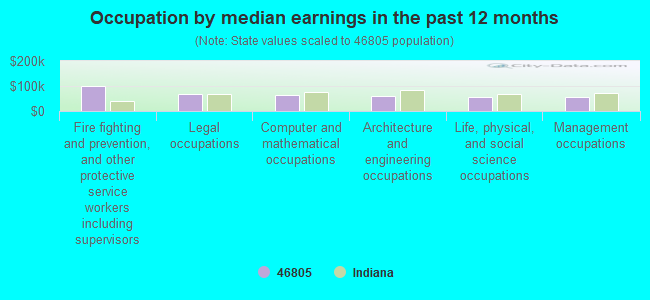
Occupation by median earnings in the past 12 months ($)
99,984Fire fighting and prevention, and other protective service workers including supervisors
66,090Legal occupations
64,457Computer and mathematical occupations
60,635Architecture and engineering occupations
57,789Life, physical, and social science occupations
56,327Management occupations
Companies with federal contracts located in this zip code:
HI-TECH MANUFACTURING INC (125 CHAMBEAU ROAD in FORT WAYNE, IN; small business)
$32,878 with Army for Vehicular Brake, Steering, Axle, Wheel, and Track Components. Signed on 2001-07-09. Completion date: 2002-01-07.
AZAR INCORPORATED (1010 COLISEUM BLVD NORTH in FORT WAYNE, IN; small business) : $11,844 in 3 contractsfrom 2003 to 2004
$6,753 with Army for Lodging - Hotel/Motel. Taking place in AL. Signed on 2004-07-08. Completion date: 2004-08-19.
$4,401 with Army for Lodging - Hotel/Motel. Signed on 2003-06-11. Completion date: 2003-06-29.
$690, same as above.Signed on 2003-06-24. Completion date: 2003-06-29.
RAYNOR GARAGE DOORS OF ALLEN C (3636 LIMA ROAD in FORT WAYNE, IN; small business) : $7,782 in 2 contractsfrom 2003 to 2004
$4,492 with Public Buildings Service for Maintenance, Repair or Alteration of Real Property -- Office Buildings. Signed on 2003-09-15. Completion date: 2003-10-15.
$3,290 with Army for Maintenance, Repair or Alteration of Real Property -- Maintenance Buildings. Signed on 2004-07-08. Completion date: 2004-08-07.
PLIBRICO SALES AND SERVICE INC (3915 MOBILE AVE in FT WAYNE, IN; small business) : $4,285 in 2 contractsin 2002
$4,285 with Army for Clay and Concrete Products Industries Machinery. Signed on 2002-12-23. Completion date: 2003-01-07.
$0, same as above.Signed on 2002-12-23. Completion date: 2003-01-07.
A HATTERSLEY & SONS INC (3939 MOBILE AVE in FORT WAYNE, IN; small business)
$4,251 with Army for Maintenance, Repair or Alteration of Real Property -- Other Airfield Structures. Signed on 2001-08-01. Completion date: 2001-07-28.
DANTZER, RON HEATING & AIR CON (3511 ELEANOR AVE in FORT WAYNE, IN; small business)
$2,207 with Army for Maintenance, Repair or Alteration of Real Property -- Maintenance Buildings. Signed on 2003-04-23. Completion date: 2003-04-24.
LOWE''S HOME CENTERS, INC (1929 NORTH COLISEUM BLVD in FORT WAYNE, IN)
$702 with Army for Cabinets, Lockers, Bins, and Shelving. Signed on 2003-03-19. Completion date: 2003-03-19.
Top industries in this zip code by the number of employees in 2005:
Health Care and Social Assistance: General Medical and Surgical Hospitals (over 1000 employees: 1 establishment, 250-499 employees: 1 establishment)
Health Care and Social Assistance: Offices of Physicians (except Mental Health Specialists) (100-249: 2, 50-99: 2, 20-49: 9, 10-19: 9, 5-9: 16, 1-4: 11)
2005 - 2018 National Fire Incident Reporting System (NFIRS) incidents
According to the data from the years 2005 - 2018 the average number of fire incidents per year is 67. The highest number of fires - 113 took place in 2005, and the least - 19 in 2014. The data has a declining trend.
When looking into fire subcategories, the most incidents belonged to: Structure Fires (39.4%), and Outside Fires (33.9%).
Fire incident types reported to NFIRS in Zip Code 46805


 Nearest zip codes: 46803, 46825, 46802, 46815, 46808, 46806.


 According to the data from the years 2005 - 2018 the average number of fire incidents per year is 67. The highest number of fires - 113 took place in 2005, and the least - 19 in 2014. The data has a declining trend.
 When looking into fire subcategories, the most incidents belonged to: Structure Fires (39.4%), and Outside Fires (33.9%).