Estimated zip code population in 2022: 27,088
Zip code population in 2010: 26,522
Zip code population in 2000: 26,355
Houses and condos: 11,091
Renter-occupied apartments: 2,690
% of renters here:
25%State:
29%
March 2022 cost of living index in zip code 46815: 83.3
(low, U.S. average is 100)
Land area: 10.4
sq. mi.
Water area: 0.0
sq. mi.
Population density: 2,598 people per square mile (average).
OSM Map
General Map
Google Map
MSN Map
OSM Map
General Map
Google Map
MSN Map
OSM Map
General Map
Google Map
MSN Map
OSM Map
General Map
Google Map
MSN Map
Please wait while loading the map...
Real estate property taxes paid for housing units in 2022:
This zip code:
0.8% ($1,575)Indiana:
0.7% ($1,467)
Median real estate property taxes paid for housing units with mortgages in 2022: $1,551 (0.8%)
Median real estate property taxes paid for housing units with no mortgage in 2022: $1,666 (0.9%)
Profiles of local businesses
Business Search - 14 Million verified businesses
Males: 12,918 Females: 14,169
For population 25 years and over in 46815:
High school or higher: 94.4%Bachelor's degree or higher: 32.5%Graduate or professional degree: 10.9%Unemployed: 5.5%Mean travel time to work (commute): 23.6 minutes
For population 15 years and over in 46815:
Never married: 33.8%Now married: 49.9%Separated: 1.0%Widowed: 6.1%Divorced: 9.2%
Zip code 46815 compared to state average:
Hispanic race population percentage below state average. Length of stay since moving in significantly above state average. 21,204 78.3% White 2,414 8.9% Black 1,368 5.1% Asian 1,249 4.6% Two or more races 791 2.9% Hispanic or Latino 53 0.2% Some other race 6 0.02% American Indian
Data:
Median household income ($)
Median household income (% change since 2000)
Household income diversity
Ratio of average income to average house value (%)
Ratio of average income to average rent
Median household income ($) - White
Median household income ($) - Black or African American
Median household income ($) - Asian
Median household income ($) - Hispanic or Latino
Median household income ($) - American Indian and Alaska Native
Median household income ($) - Multirace
Median household income ($) - Other Race
Median household income for houses/condos with a mortgage ($)
Median household income for apartments without a mortgage ($)
Races - White alone (%)
Races - White alone (% change since 2000)
Races - Black alone (%)
Races - Black alone (% change since 2000)
Races - American Indian alone (%)
Races - American Indian alone (% change since 2000)
Races - Asian alone (%)
Races - Asian alone (% change since 2000)
Races - Hispanic (%)
Races - Hispanic (% change since 2000)
Races - Native Hawaiian and Other Pacific Islander alone (%)
Races - Native Hawaiian and Other Pacific Islander alone (% change since 2000)
Races - Two or more races (%)
Races - Two or more races (% change since 2000)
Races - Other race alone (%)
Races - Other race alone (% change since 2000)
Racial diversity
Unemployment (%)
Unemployment (% change since 2000)
Unemployment (%) - White
Unemployment (%) - Black or African American
Unemployment (%) - Asian
Unemployment (%) - Hispanic or Latino
Unemployment (%) - American Indian and Alaska Native
Unemployment (%) - Multirace
Unemployment (%) - Other Race
Population density (people per square mile)
Population - Males (%)
Population - Females (%)
Population - Males (%) - White
Population - Males (%) - Black or African American
Population - Males (%) - Asian
Population - Males (%) - Hispanic or Latino
Population - Males (%) - American Indian and Alaska Native
Population - Males (%) - Multirace
Population - Males (%) - Other Race
Population - Females (%) - White
Population - Females (%) - Black or African American
Population - Females (%) - Asian
Population - Females (%) - Hispanic or Latino
Population - Females (%) - American Indian and Alaska Native
Population - Females (%) - Multirace
Population - Females (%) - Other Race
Coronavirus confirmed cases (Apr 27, 2024)
Deaths caused by coronavirus (Apr 27, 2024)
Coronavirus confirmed cases (per 100k population) (Apr 27, 2024)
Deaths caused by coronavirus (per 100k population) (Apr 27, 2024)
Daily increase in number of cases (Apr 27, 2024)
Weekly increase in number of cases (Apr 27, 2024)
Cases doubled (in days) (Apr 27, 2024)
Hospitalized patients (Apr 18, 2022)
Negative test results (Apr 18, 2022)
Total test results (Apr 18, 2022)
COVID Vaccine doses distributed (per 100k population) (Sep 19, 2023)
COVID Vaccine doses administered (per 100k population) (Sep 19, 2023)
COVID Vaccine doses distributed (Sep 19, 2023)
COVID Vaccine doses administered (Sep 19, 2023)
Likely homosexual households (%)
Likely homosexual households (% change since 2000)
Likely homosexual households - Lesbian couples (%)
Likely homosexual households - Lesbian couples (% change since 2000)
Likely homosexual households - Gay men (%)
Likely homosexual households - Gay men (% change since 2000)
Cost of living index
Median gross rent ($)
Median contract rent ($)
Median monthly housing costs ($)
Median house or condo value ($)
Median house or condo value ($ change since 2000)
Mean house or condo value by units in structure - 1, detached ($)
Mean house or condo value by units in structure - 1, attached ($)
Mean house or condo value by units in structure - 2 ($)
Mean house or condo value by units in structure by units in structure - 3 or 4 ($)
Mean house or condo value by units in structure - 5 or more ($)
Mean house or condo value by units in structure - Boat, RV, van, etc. ($)
Mean house or condo value by units in structure - Mobile home ($)
Median house or condo value ($) - White
Median house or condo value ($) - Black or African American
Median house or condo value ($) - Asian
Median house or condo value ($) - Hispanic or Latino
Median house or condo value ($) - American Indian and Alaska Native
Median house or condo value ($) - Multirace
Median house or condo value ($) - Other Race
Median resident age
Resident age diversity
Median resident age - Males
Median resident age - Females
Median resident age - White
Median resident age - Black or African American
Median resident age - Asian
Median resident age - Hispanic or Latino
Median resident age - American Indian and Alaska Native
Median resident age - Multirace
Median resident age - Other Race
Median resident age - Males - White
Median resident age - Males - Black or African American
Median resident age - Males - Asian
Median resident age - Males - Hispanic or Latino
Median resident age - Males - American Indian and Alaska Native
Median resident age - Males - Multirace
Median resident age - Males - Other Race
Median resident age - Females - White
Median resident age - Females - Black or African American
Median resident age - Females - Asian
Median resident age - Females - Hispanic or Latino
Median resident age - Females - American Indian and Alaska Native
Median resident age - Females - Multirace
Median resident age - Females - Other Race
Commute - mean travel time to work (minutes)
Travel time to work - Less than 5 minutes (%)
Travel time to work - Less than 5 minutes (% change since 2000)
Travel time to work - 5 to 9 minutes (%)
Travel time to work - 5 to 9 minutes (% change since 2000)
Travel time to work - 10 to 19 minutes (%)
Travel time to work - 10 to 19 minutes (% change since 2000)
Travel time to work - 20 to 29 minutes (%)
Travel time to work - 20 to 29 minutes (% change since 2000)
Travel time to work - 30 to 39 minutes (%)
Travel time to work - 30 to 39 minutes (% change since 2000)
Travel time to work - 40 to 59 minutes (%)
Travel time to work - 40 to 59 minutes (% change since 2000)
Travel time to work - 60 to 89 minutes (%)
Travel time to work - 60 to 89 minutes (% change since 2000)
Travel time to work - 90 or more minutes (%)
Travel time to work - 90 or more minutes (% change since 2000)
Marital status - Never married (%)
Marital status - Now married (%)
Marital status - Separated (%)
Marital status - Widowed (%)
Marital status - Divorced (%)
Median family income ($)
Median family income (% change since 2000)
Median non-family income ($)
Median non-family income (% change since 2000)
Median per capita income ($)
Median per capita income (% change since 2000)
Median family income ($) - White
Median family income ($) - Black or African American
Median family income ($) - Asian
Median family income ($) - Hispanic or Latino
Median family income ($) - American Indian and Alaska Native
Median family income ($) - Multirace
Median family income ($) - Other Race
Median year house/condo built
Median year apartment built
Year house built - Built 2005 or later (%)
Year house built - Built 2000 to 2004 (%)
Year house built - Built 1990 to 1999 (%)
Year house built - Built 1980 to 1989 (%)
Year house built - Built 1970 to 1979 (%)
Year house built - Built 1960 to 1969 (%)
Year house built - Built 1950 to 1959 (%)
Year house built - Built 1940 to 1949 (%)
Year house built - Built 1939 or earlier (%)
Average household size
Household density (households per square mile)
Average household size - White
Average household size - Black or African American
Average household size - Asian
Average household size - Hispanic or Latino
Average household size - American Indian and Alaska Native
Average household size - Multirace
Average household size - Other Race
Occupied housing units (%)
Vacant housing units (%)
Owner occupied housing units (%)
Renter occupied housing units (%)
Vacancy status - For rent (%)
Vacancy status - For sale only (%)
Vacancy status - Rented or sold, not occupied (%)
Vacancy status - For seasonal, recreational, or occasional use (%)
Vacancy status - For migrant workers (%)
Vacancy status - Other vacant (%)
Residents with income below the poverty level (%)
Residents with income below 50% of the poverty level (%)
Children below poverty level (%)
Poor families by family type - Married-couple family (%)
Poor families by family type - Male, no wife present (%)
Poor families by family type - Female, no husband present (%)
Poverty status for native-born residents (%)
Poverty status for foreign-born residents (%)
Poverty among high school graduates not in families (%)
Poverty among people who did not graduate high school not in families (%)
Residents with income below the poverty level (%) - White
Residents with income below the poverty level (%) - Black or African American
Residents with income below the poverty level (%) - Asian
Residents with income below the poverty level (%) - Hispanic or Latino
Residents with income below the poverty level (%) - American Indian and Alaska Native
Residents with income below the poverty level (%) - Multirace
Residents with income below the poverty level (%) - Other Race
Air pollution - Air Quality Index (AQI)
Air pollution - CO
Air pollution - NO2
Air pollution - SO2
Air pollution - Ozone
Air pollution - PM10
Air pollution - PM25
Air pollution - Pb
Crime - Murders per 100,000 population
Crime - Rapes per 100,000 population
Crime - Robberies per 100,000 population
Crime - Assaults per 100,000 population
Crime - Burglaries per 100,000 population
Crime - Thefts per 100,000 population
Crime - Auto thefts per 100,000 population
Crime - Arson per 100,000 population
Crime - City-data.com crime index
Crime - Violent crime index
Crime - Property crime index
Crime - Murders per 100,000 population (5 year average)
Crime - Rapes per 100,000 population (5 year average)
Crime - Robberies per 100,000 population (5 year average)
Crime - Assaults per 100,000 population (5 year average)
Crime - Burglaries per 100,000 population (5 year average)
Crime - Thefts per 100,000 population (5 year average)
Crime - Auto thefts per 100,000 population (5 year average)
Crime - Arson per 100,000 population (5 year average)
Crime - City-data.com crime index (5 year average)
Crime - Violent crime index (5 year average)
Crime - Property crime index (5 year average)
1996 Presidential Elections Results (%) - Democratic Party (Clinton)
1996 Presidential Elections Results (%) - Republican Party (Dole)
1996 Presidential Elections Results (%) - Other
2000 Presidential Elections Results (%) - Democratic Party (Gore)
2000 Presidential Elections Results (%) - Republican Party (Bush)
2000 Presidential Elections Results (%) - Other
2004 Presidential Elections Results (%) - Democratic Party (Kerry)
2004 Presidential Elections Results (%) - Republican Party (Bush)
2004 Presidential Elections Results (%) - Other
2008 Presidential Elections Results (%) - Democratic Party (Obama)
2008 Presidential Elections Results (%) - Republican Party (McCain)
2008 Presidential Elections Results (%) - Other
2012 Presidential Elections Results (%) - Democratic Party (Obama)
2012 Presidential Elections Results (%) - Republican Party (Romney)
2012 Presidential Elections Results (%) - Other
2016 Presidential Elections Results (%) - Democratic Party (Clinton)
2016 Presidential Elections Results (%) - Republican Party (Trump)
2016 Presidential Elections Results (%) - Other
2020 Presidential Elections Results (%) - Democratic Party (Biden)
2020 Presidential Elections Results (%) - Republican Party (Trump)
2020 Presidential Elections Results (%) - Other
Ancestries Reported - Arab (%)
Ancestries Reported - Czech (%)
Ancestries Reported - Danish (%)
Ancestries Reported - Dutch (%)
Ancestries Reported - English (%)
Ancestries Reported - French (%)
Ancestries Reported - French Canadian (%)
Ancestries Reported - German (%)
Ancestries Reported - Greek (%)
Ancestries Reported - Hungarian (%)
Ancestries Reported - Irish (%)
Ancestries Reported - Italian (%)
Ancestries Reported - Lithuanian (%)
Ancestries Reported - Norwegian (%)
Ancestries Reported - Polish (%)
Ancestries Reported - Portuguese (%)
Ancestries Reported - Russian (%)
Ancestries Reported - Scotch-Irish (%)
Ancestries Reported - Scottish (%)
Ancestries Reported - Slovak (%)
Ancestries Reported - Subsaharan African (%)
Ancestries Reported - Swedish (%)
Ancestries Reported - Swiss (%)
Ancestries Reported - Ukrainian (%)
Ancestries Reported - United States (%)
Ancestries Reported - Welsh (%)
Ancestries Reported - West Indian (%)
Ancestries Reported - Other (%)
Educational Attainment - No schooling completed (%)
Educational Attainment - Less than high school (%)
Educational Attainment - High school or equivalent (%)
Educational Attainment - Less than 1 year of college (%)
Educational Attainment - 1 or more years of college (%)
Educational Attainment - Associate degree (%)
Educational Attainment - Bachelor's degree (%)
Educational Attainment - Master's degree (%)
Educational Attainment - Professional school degree (%)
Educational Attainment - Doctorate degree (%)
School Enrollment - Nursery, preschool (%)
School Enrollment - Kindergarten (%)
School Enrollment - Grade 1 to 4 (%)
School Enrollment - Grade 5 to 8 (%)
School Enrollment - Grade 9 to 12 (%)
School Enrollment - College undergrad (%)
School Enrollment - Graduate or professional (%)
School Enrollment - Not enrolled in school (%)
School enrollment - Public schools (%)
School enrollment - Private schools (%)
School enrollment - Not enrolled (%)
Median number of rooms in houses and condos
Median number of rooms in apartments
Housing units lacking complete plumbing facilities (%)
Housing units lacking complete kitchen facilities (%)
Density of houses
Urban houses (%)
Rural houses (%)
Households with people 60 years and over (%)
Households with people 65 years and over (%)
Households with people 75 years and over (%)
Households with one or more nonrelatives (%)
Households with no nonrelatives (%)
Population in households (%)
Family households (%)
Nonfamily households (%)
Population in families (%)
Family households with own children (%)
Median number of bedrooms in owner occupied houses
Mean number of bedrooms in owner occupied houses
Median number of bedrooms in renter occupied houses
Mean number of bedrooms in renter occupied houses
Median number of vehichles in owner occupied houses
Mean number of vehichles in owner occupied houses
Median number of vehichles in renter occupied houses
Mean number of vehichles in renter occupied houses
Mortgage status - with mortgage (%)
Mortgage status - with second mortgage (%)
Mortgage status - with home equity loan (%)
Mortgage status - with both second mortgage and home equity loan (%)
Mortgage status - without a mortgage (%)
Average family size
Average family size - White
Average family size - Black or African American
Average family size - Asian
Average family size - Hispanic or Latino
Average family size - American Indian and Alaska Native
Average family size - Multirace
Average family size - Other Race
Geographical mobility - Same house 1 year ago (%)
Geographical mobility - Moved within same county (%)
Geographical mobility - Moved from different county within same state (%)
Geographical mobility - Moved from different state (%)
Geographical mobility - Moved from abroad (%)
Place of birth - Born in state of residence (%)
Place of birth - Born in other state (%)
Place of birth - Native, outside of US (%)
Place of birth - Foreign born (%)
Housing units in structures - 1, detached (%)
Housing units in structures - 1, attached (%)
Housing units in structures - 2 (%)
Housing units in structures - 3 or 4 (%)
Housing units in structures - 5 to 9 (%)
Housing units in structures - 10 to 19 (%)
Housing units in structures - 20 to 49 (%)
Housing units in structures - 50 or more (%)
Housing units in structures - Mobile home (%)
Housing units in structures - Boat, RV, van, etc. (%)
House/condo owner moved in on average (years ago)
Renter moved in on average (years ago)
Year householder moved into unit - Moved in 1999 to March 2000 (%)
Year householder moved into unit - Moved in 1995 to 1998 (%)
Year householder moved into unit - Moved in 1990 to 1994 (%)
Year householder moved into unit - Moved in 1980 to 1989 (%)
Year householder moved into unit - Moved in 1970 to 1979 (%)
Year householder moved into unit - Moved in 1969 or earlier (%)
Means of transportation to work - Drove car alone (%)
Means of transportation to work - Carpooled (%)
Means of transportation to work - Public transportation (%)
Means of transportation to work - Bus or trolley bus (%)
Means of transportation to work - Streetcar or trolley car (%)
Means of transportation to work - Subway or elevated (%)
Means of transportation to work - Railroad (%)
Means of transportation to work - Ferryboat (%)
Means of transportation to work - Taxicab (%)
Means of transportation to work - Motorcycle (%)
Means of transportation to work - Bicycle (%)
Means of transportation to work - Walked (%)
Means of transportation to work - Other means (%)
Working at home (%)
Industry diversity
Most Common Industries - Agriculture, forestry, fishing and hunting, and mining (%)
Most Common Industries - Agriculture, forestry, fishing and hunting (%)
Most Common Industries - Mining, quarrying, and oil and gas extraction (%)
Most Common Industries - Construction (%)
Most Common Industries - Manufacturing (%)
Most Common Industries - Wholesale trade (%)
Most Common Industries - Retail trade (%)
Most Common Industries - Transportation and warehousing, and utilities (%)
Most Common Industries - Transportation and warehousing (%)
Most Common Industries - Utilities (%)
Most Common Industries - Information (%)
Most Common Industries - Finance and insurance, and real estate and rental and leasing (%)
Most Common Industries - Finance and insurance (%)
Most Common Industries - Real estate and rental and leasing (%)
Most Common Industries - Professional, scientific, and management, and administrative and waste management services (%)
Most Common Industries - Professional, scientific, and technical services (%)
Most Common Industries - Management of companies and enterprises (%)
Most Common Industries - Administrative and support and waste management services (%)
Most Common Industries - Educational services, and health care and social assistance (%)
Most Common Industries - Educational services (%)
Most Common Industries - Health care and social assistance (%)
Most Common Industries - Arts, entertainment, and recreation, and accommodation and food services (%)
Most Common Industries - Arts, entertainment, and recreation (%)
Most Common Industries - Accommodation and food services (%)
Most Common Industries - Other services, except public administration (%)
Most Common Industries - Public administration (%)
Occupation diversity
Most Common Occupations - Management, business, science, and arts occupations (%)
Most Common Occupations - Management, business, and financial occupations (%)
Most Common Occupations - Management occupations (%)
Most Common Occupations - Business and financial operations occupations (%)
Most Common Occupations - Computer, engineering, and science occupations (%)
Most Common Occupations - Computer and mathematical occupations (%)
Most Common Occupations - Architecture and engineering occupations (%)
Most Common Occupations - Life, physical, and social science occupations (%)
Most Common Occupations - Education, legal, community service, arts, and media occupations (%)
Most Common Occupations - Community and social service occupations (%)
Most Common Occupations - Legal occupations (%)
Most Common Occupations - Education, training, and library occupations (%)
Most Common Occupations - Arts, design, entertainment, sports, and media occupations (%)
Most Common Occupations - Healthcare practitioners and technical occupations (%)
Most Common Occupations - Health diagnosing and treating practitioners and other technical occupations (%)
Most Common Occupations - Health technologists and technicians (%)
Most Common Occupations - Service occupations (%)
Most Common Occupations - Healthcare support occupations (%)
Most Common Occupations - Protective service occupations (%)
Most Common Occupations - Fire fighting and prevention, and other protective service workers including supervisors (%)
Most Common Occupations - Law enforcement workers including supervisors (%)
Most Common Occupations - Food preparation and serving related occupations (%)
Most Common Occupations - Building and grounds cleaning and maintenance occupations (%)
Most Common Occupations - Personal care and service occupations (%)
Most Common Occupations - Sales and office occupations (%)
Most Common Occupations - Sales and related occupations (%)
Most Common Occupations - Office and administrative support occupations (%)
Most Common Occupations - Natural resources, construction, and maintenance occupations (%)
Most Common Occupations - Farming, fishing, and forestry occupations (%)
Most Common Occupations - Construction and extraction occupations (%)
Most Common Occupations - Installation, maintenance, and repair occupations (%)
Most Common Occupations - Production, transportation, and material moving occupations (%)
Most Common Occupations - Production occupations (%)
Most Common Occupations - Transportation occupations (%)
Most Common Occupations - Material moving occupations (%)
People in Group quarters - Institutionalized population (%)
People in Group quarters - Correctional institutions (%)
People in Group quarters - Federal prisons and detention centers (%)
People in Group quarters - Halfway houses (%)
People in Group quarters - Local jails and other confinement facilities (including police lockups) (%)
People in Group quarters - Military disciplinary barracks (%)
People in Group quarters - State prisons (%)
People in Group quarters - Other types of correctional institutions (%)
People in Group quarters - Nursing homes (%)
People in Group quarters - Hospitals/wards, hospices, and schools for the handicapped (%)
People in Group quarters - Hospitals/wards and hospices for chronically ill (%)
People in Group quarters - Hospices or homes for chronically ill (%)
People in Group quarters - Military hospitals or wards for chronically ill (%)
People in Group quarters - Other hospitals or wards for chronically ill (%)
People in Group quarters - Hospitals or wards for drug/alcohol abuse (%)
People in Group quarters - Mental (Psychiatric) hospitals or wards (%)
People in Group quarters - Schools, hospitals, or wards for the mentally retarded (%)
People in Group quarters - Schools, hospitals, or wards for the physically handicapped (%)
People in Group quarters - Institutions for the deaf (%)
People in Group quarters - Institutions for the blind (%)
People in Group quarters - Orthopedic wards and institutions for the physically handicapped (%)
People in Group quarters - Wards in general hospitals for patients who have no usual home elsewhere (%)
People in Group quarters - Wards in military hospitals for patients who have no usual home elsewhere (%)
People in Group quarters - Juvenile institutions (%)
People in Group quarters - Long-term care (%)
People in Group quarters - Homes for abused, dependent, and neglected children (%)
People in Group quarters - Residential treatment centers for emotionally disturbed children (%)
People in Group quarters - Training schools for juvenile delinquents (%)
People in Group quarters - Short-term care, detention or diagnostic centers for delinquent children (%)
People in Group quarters - Type of juvenile institution unknown (%)
People in Group quarters - Noninstitutionalized population (%)
People in Group quarters - College dormitories (includes college quarters off campus) (%)
People in Group quarters - Military quarters (%)
People in Group quarters - On base (%)
People in Group quarters - Barracks, unaccompanied personnel housing (UPH), (Enlisted/Officer), ;and similar group living quarters for military personnel (%)
People in Group quarters - Transient quarters for temporary residents (%)
People in Group quarters - Military ships (%)
People in Group quarters - Group homes (%)
People in Group quarters - Homes or halfway houses for drug/alcohol abuse (%)
People in Group quarters - Homes for the mentally ill (%)
People in Group quarters - Homes for the mentally retarded (%)
People in Group quarters - Homes for the physically handicapped (%)
People in Group quarters - Other group homes (%)
People in Group quarters - Religious group quarters (%)
People in Group quarters - Dormitories (%)
People in Group quarters - Agriculture workers' dormitories on farms (%)
People in Group quarters - Job Corps and vocational training facilities (%)
People in Group quarters - Other workers' dormitories (%)
People in Group quarters - Crews of maritime vessels (%)
People in Group quarters - Other nonhousehold living situations (%)
People in Group quarters - Other noninstitutional group quarters (%)
Residents speaking English at home (%)
Residents speaking English at home - Born in the United States (%)
Residents speaking English at home - Native, born elsewhere (%)
Residents speaking English at home - Foreign born (%)
Residents speaking Spanish at home (%)
Residents speaking Spanish at home - Born in the United States (%)
Residents speaking Spanish at home - Native, born elsewhere (%)
Residents speaking Spanish at home - Foreign born (%)
Residents speaking other language at home (%)
Residents speaking other language at home - Born in the United States (%)
Residents speaking other language at home - Native, born elsewhere (%)
Residents speaking other language at home - Foreign born (%)
Class of Workers - Employee of private company (%)
Class of Workers - Self-employed in own incorporated business (%)
Class of Workers - Private not-for-profit wage and salary workers (%)
Class of Workers - Local government workers (%)
Class of Workers - State government workers (%)
Class of Workers - Federal government workers (%)
Class of Workers - Self-employed workers in own not incorporated business and Unpaid family workers (%)
House heating fuel used in houses and condos - Utility gas (%)
House heating fuel used in houses and condos - Bottled, tank, or LP gas (%)
House heating fuel used in houses and condos - Electricity (%)
House heating fuel used in houses and condos - Fuel oil, kerosene, etc. (%)
House heating fuel used in houses and condos - Coal or coke (%)
House heating fuel used in houses and condos - Wood (%)
House heating fuel used in houses and condos - Solar energy (%)
House heating fuel used in houses and condos - Other fuel (%)
House heating fuel used in houses and condos - No fuel used (%)
House heating fuel used in apartments - Utility gas (%)
House heating fuel used in apartments - Bottled, tank, or LP gas (%)
House heating fuel used in apartments - Electricity (%)
House heating fuel used in apartments - Fuel oil, kerosene, etc. (%)
House heating fuel used in apartments - Coal or coke (%)
House heating fuel used in apartments - Wood (%)
House heating fuel used in apartments - Solar energy (%)
House heating fuel used in apartments - Other fuel (%)
House heating fuel used in apartments - No fuel used (%)
Armed forces status - In Armed Forces (%)
Armed forces status - Civilian (%)
Armed forces status - Civilian - Veteran (%)
Armed forces status - Civilian - Nonveteran (%)
Fatal accidents locations in years 2005-2021
Fatal accidents locations in 2005
Fatal accidents locations in 2006
Fatal accidents locations in 2007
Fatal accidents locations in 2008
Fatal accidents locations in 2009
Fatal accidents locations in 2010
Fatal accidents locations in 2011
Fatal accidents locations in 2012
Fatal accidents locations in 2013
Fatal accidents locations in 2014
Fatal accidents locations in 2015
Fatal accidents locations in 2016
Fatal accidents locations in 2017
Fatal accidents locations in 2018
Fatal accidents locations in 2019
Fatal accidents locations in 2020
Fatal accidents locations in 2021
Alcohol use - People drinking some alcohol every month (%)
Alcohol use - People not drinking at all (%)
Alcohol use - Average days/month drinking alcohol
Alcohol use - Average drinks/week
Alcohol use - Average days/year people drink much
Audiometry - Average condition of hearing (%)
Audiometry - People that can hear a whisper from across a quiet room (%)
Audiometry - People that can hear normal voice from across a quiet room (%)
Audiometry - Ears ringing, roaring, buzzing (%)
Audiometry - Had a job exposure to loud noise (%)
Audiometry - Had off-work exposure to loud noise (%)
Blood Pressure & Cholesterol - Has high blood pressure (%)
Blood Pressure & Cholesterol - Checking blood pressure at home (%)
Blood Pressure & Cholesterol - Frequently checking blood cholesterol (%)
Blood Pressure & Cholesterol - Has high cholesterol level (%)
Consumer Behavior - Money monthly spent on food at supermarket/grocery store
Consumer Behavior - Money monthly spent on food at other stores
Consumer Behavior - Money monthly spent on eating out
Consumer Behavior - Money monthly spent on carryout/delivered foods
Consumer Behavior - Income spent on food at supermarket/grocery store (%)
Consumer Behavior - Income spent on food at other stores (%)
Consumer Behavior - Income spent on eating out (%)
Consumer Behavior - Income spent on carryout/delivered foods (%)
Current Health Status - General health condition (%)
Current Health Status - Blood donors (%)
Current Health Status - Has blood ever tested for HIV virus (%)
Current Health Status - Left-handed people (%)
Dermatology - People using sunscreen (%)
Diabetes - Diabetics (%)
Diabetes - Had a blood test for high blood sugar (%)
Diabetes - People taking insulin (%)
Diet Behavior & Nutrition - Diet health (%)
Diet Behavior & Nutrition - Milk product consumption (# of products/month)
Diet Behavior & Nutrition - Meals not home prepared (#/week)
Diet Behavior & Nutrition - Meals from fast food or pizza place (#/week)
Diet Behavior & Nutrition - Ready-to-eat foods (#/month)
Diet Behavior & Nutrition - Frozen meals/pizza (#/month)
Drug Use - People that ever used marijuana or hashish (%)
Drug Use - Ever used hard drugs (%)
Drug Use - Ever used any form of cocaine (%)
Drug Use - Ever used heroin (%)
Drug Use - Ever used methamphetamine (%)
Health Insurance - People covered by health insurance (%)
Kidney Conditions-Urology - Avg. # of times urinating at night
Medical Conditions - People with asthma (%)
Medical Conditions - People with anemia (%)
Medical Conditions - People with psoriasis (%)
Medical Conditions - People with overweight (%)
Medical Conditions - Elderly people having difficulties in thinking or remembering (%)
Medical Conditions - People who ever received blood transfusion (%)
Medical Conditions - People having trouble seeing even with glass/contacts (%)
Medical Conditions - People with arthritis (%)
Medical Conditions - People with gout (%)
Medical Conditions - People with congestive heart failure (%)
Medical Conditions - People with coronary heart disease (%)
Medical Conditions - People with angina pectoris (%)
Medical Conditions - People who ever had heart attack (%)
Medical Conditions - People who ever had stroke (%)
Medical Conditions - People with emphysema (%)
Medical Conditions - People with thyroid problem (%)
Medical Conditions - People with chronic bronchitis (%)
Medical Conditions - People with any liver condition (%)
Medical Conditions - People who ever had cancer or malignancy (%)
Mental Health - People who have little interest in doing things (%)
Mental Health - People feeling down, depressed, or hopeless (%)
Mental Health - People who have trouble sleeping or sleeping too much (%)
Mental Health - People feeling tired or having little energy (%)
Mental Health - People with poor appetite or overeating (%)
Mental Health - People feeling bad about themself (%)
Mental Health - People who have trouble concentrating on things (%)
Mental Health - People moving or speaking slowly or too fast (%)
Mental Health - People having thoughts they would be better off dead (%)
Oral Health - Average years since last visit a dentist
Oral Health - People embarrassed because of mouth (%)
Oral Health - People with gum disease (%)
Oral Health - General health of teeth and gums (%)
Oral Health - Average days a week using dental floss/device
Oral Health - Average days a week using mouthwash for dental problem
Oral Health - Average number of teeth
Pesticide Use - Households using pesticides to control insects (%)
Pesticide Use - Households using pesticides to kill weeds (%)
Physical Activity - People doing vigorous-intensity work activities (%)
Physical Activity - People doing moderate-intensity work activities (%)
Physical Activity - People walking or bicycling (%)
Physical Activity - People doing vigorous-intensity recreational activities (%)
Physical Activity - People doing moderate-intensity recreational activities (%)
Physical Activity - Average hours a day doing sedentary activities
Physical Activity - Average hours a day watching TV or videos
Physical Activity - Average hours a day using computer
Physical Functioning - People having limitations keeping them from working (%)
Physical Functioning - People limited in amount of work they can do (%)
Physical Functioning - People that need special equipment to walk (%)
Physical Functioning - People experiencing confusion/memory problems (%)
Physical Functioning - People requiring special healthcare equipment (%)
Prescription Medications - Average number of prescription medicines taking
Preventive Aspirin Use - Adults 40+ taking low-dose aspirin (%)
Reproductive Health - Vaginal deliveries (%)
Reproductive Health - Cesarean deliveries (%)
Reproductive Health - Deliveries resulted in a live birth (%)
Reproductive Health - Pregnancies resulted in a delivery (%)
Reproductive Health - Women breastfeeding newborns (%)
Reproductive Health - Women that had a hysterectomy (%)
Reproductive Health - Women that had both ovaries removed (%)
Reproductive Health - Women that have ever taken birth control pills (%)
Reproductive Health - Women taking birth control pills (%)
Reproductive Health - Women that have ever used Depo-Provera or injectables (%)
Reproductive Health - Women that have ever used female hormones (%)
Sexual Behavior - People 18+ that ever had sex (vaginal, anal, or oral) (%)
Sexual Behavior - Males 18+ that ever had vaginal sex with a woman (%)
Sexual Behavior - Males 18+ that ever performed oral sex on a woman (%)
Sexual Behavior - Males 18+ that ever had anal sex with a woman (%)
Sexual Behavior - Males 18+ that ever had any sex with a man (%)
Sexual Behavior - Females 18+ that ever had vaginal sex with a man (%)
Sexual Behavior - Females 18+ that ever performed oral sex on a man (%)
Sexual Behavior - Females 18+ that ever had anal sex with a man (%)
Sexual Behavior - Females 18+ that ever had any kind of sex with a woman (%)
Sexual Behavior - Average age people first had sex
Sexual Behavior - Average number of female sex partners in lifetime (males 18+)
Sexual Behavior - Average number of female vaginal sex partners in lifetime (males 18+)
Sexual Behavior - Average age people first performed oral sex on a woman (18+)
Sexual Behavior - Average number of woman performed oral sex on in lifetime (18+)
Sexual Behavior - Average number of male sex partners in lifetime (males 18+)
Sexual Behavior - Average number of male anal sex partners in lifetime (males 18+)
Sexual Behavior - Average age people first performed oral sex on a man (18+)
Sexual Behavior - Average number of male oral sex partners in lifetime (18+)
Sexual Behavior - People using protection when performing oral sex (%)
Sexual Behavior - Average number of times people have vaginal or anal sex a year
Sexual Behavior - People having sex without condom (%)
Sexual Behavior - Average number of male sex partners in lifetime (females 18+)
Sexual Behavior - Average number of male vaginal sex partners in lifetime (females 18+)
Sexual Behavior - Average number of female sex partners in lifetime (females 18+)
Sexual Behavior - Circumcised males 18+ (%)
Sleep Disorders - Average hours sleeping at night
Sleep Disorders - People that has trouble sleeping (%)
Smoking-Cigarette Use - People smoking cigarettes (%)
Taste & Smell - People 40+ having problems with smell (%)
Taste & Smell - People 40+ having problems with taste (%)
Taste & Smell - People 40+ that ever had wisdom teeth removed (%)
Taste & Smell - People 40+ that ever had tonsils teeth removed (%)
Taste & Smell - People 40+ that ever had a loss of consciousness because of a head injury (%)
Taste & Smell - People 40+ that ever had a broken nose or other serious injury to face or skull (%)
Taste & Smell - People 40+ that ever had two or more sinus infections (%)
Weight - Average height (inches)
Weight - Average weight (pounds)
Weight - Average BMI
Weight - People that are obese (%)
Weight - People that ever were obese (%)
Weight - People trying to lose weight (%)
Urban population: 27,076
Rural population: 11
Estimated median house/condo value in 2022: $191,877
46815:
$191,877Indiana:
$208,700
Median resident age: This zip code:
37.0 yearsIndiana median age:
38.2 years
Average household size: This zip code:
2.4 peopleIndiana:
2.4 people
Averages for the 2020 tax year for zip code 46815, filed in 2021:
Average Adjusted Gross Income (AGI) in 2020: $52,081 (Individual Income Tax Returns) Here:
$52,081State:
$64,978
Salary/wage: $47,065 (reported on 82.4% of returns )Here:
$47,065State:
$55,245
(% of AGI for various income ranges: 1089.1% for AGIs below $25k , 3527.1% for AGIs $25k-50k , 6299.0% for AGIs $50k-75k , 9266.7% for AGIs $75k-100k , 15986.5% for AGIs $100k-200k , 50568.3% for AGIs over 200k ) Taxable interest for individuals: $941 (reported on 27.9% of returns )This zip code:
$941Indiana:
$1,351
(% of AGI for various income ranges: 14.5% for AGIs below $25k , 13.8% for AGIs $25k-50k , 37.5% for AGIs $50k-75k , 48.0% for AGIs $75k-100k , 91.9% for AGIs $100k-200k , 1103.3% for AGIs over 200k ) Ordinary dividends: $4,011 (reported on 16.9% of returns )(% of AGI for various income ranges: 31.9% for AGIs below $25k , 35.3% for AGIs $25k-50k , 66.3% for AGIs $50k-75k , 125.4% for AGIs $75k-100k , 299.9% for AGIs $100k-200k , 3050.0% for AGIs over 200k ) Net capital gain/loss in AGI: +$6,542 (reported on 14.5% of returns )Here:
+$6,542State:
+$17,730
(% of AGI for various income ranges: 2.5% for AGIs below $25k , 13.5% for AGIs $25k-50k , 62.7% for AGIs $50k-75k , 89.5% for AGIs $75k-100k , 412.6% for AGIs $100k-200k , 10843.3% for AGIs over 200k ) Profit/loss from business: +$8,337 (reported on 11.5% of returns )Here:
+$8,337State:
+$12,144
(% of AGI for various income ranges: 68.0% for AGIs below $25k , 75.9% for AGIs $25k-50k , 112.1% for AGIs $50k-75k , 140.5% for AGIs $75k-100k , 331.7% for AGIs $100k-200k , 3396.7% for AGIs over 200k ) Taxable individual retirement arrangement distribution: $15,867 (reported on 11.8% of returns )46815:
$15,867Indiana:
$18,302
(% of AGI for various income ranges: 81.5% for AGIs below $25k , 119.3% for AGIs $25k-50k , 239.3% for AGIs $50k-75k , 368.4% for AGIs $75k-100k , 816.8% for AGIs $100k-200k , 5795.0% for AGIs over 200k ) Total itemized deductions: $32,721 (reported on 3.4% of returns )Here:
$32,721State:
$35,601
(% of AGI for various income ranges: 39.3% for AGIs below $25k , 70.4% for AGIs $25k-50k , 125.5% for AGIs $50k-75k , 194.0% for AGIs $75k-100k , 446.5% for AGIs $100k-200k , 5833.3% for AGIs over 200k ) Charity contributions: $13,737 (reported on 2.6% of returns )Here:
$13,737State:
$15,596
(% of AGI for various income ranges: 18.4% for AGIs $25k-50k , 30.6% for AGIs $50k-75k , 46.4% for AGIs $75k-100k , 167.7% for AGIs $100k-200k , 2735.0% for AGIs over 200k ) Taxes paid: $5,787 (reported on 3.4% of returns )(% of AGI for various income ranges: 1.3% for AGIs below $25k , 9.1% for AGIs $25k-50k , 23.1% for AGIs $50k-75k , 41.6% for AGIs $75k-100k , 108.1% for AGIs $100k-200k , 900.0% for AGIs over 200k ) Earned income credit: $2,271 (reported on 14.8% of returns )(% of AGI for various income ranges: 78.0% for AGIs below $25k , 64.3% for AGIs $25k-50k , 2.5% for AGIs $50k-75k ) Percentage of individuals using paid preparers for their 2020 taxes: 93.5%(% for various income ranges: 92.2% for AGIs below $25k , 94.8% for AGIs $25k-50k , 94.3% for AGIs $50k-75k , 93.4% for AGIs $75k-100k , 92.9% for AGIs $100k-200k , 94.4% for AGIs over 200k )
Averages for the 2012 tax year for zip code 46815, filed in 2013:
Average Adjusted Gross Income (AGI) in 2012: $47,035 (Individual Income Tax Returns) Here:
$47,035State:
$52,932
Salary/wage: $41,310 (reported on 81.6% of returns )Here:
$41,310State:
$45,173
(% of AGI for various income ranges: 69.7% for AGIs below $25k , 77.9% for AGIs $25k-50k , 77.4% for AGIs $50k-75k , 77.8% for AGIs $75k-100k , 74.2% for AGIs $100k-200k , 36.1% for AGIs over 200k ) Taxable interest for individuals: $1,164 (reported on 35.8% of returns )This zip code:
$1,164Indiana:
$1,311
(% of AGI for various income ranges: 1.4% for AGIs below $25k , 0.8% for AGIs $25k-50k , 0.7% for AGIs $50k-75k , 0.8% for AGIs $75k-100k , 0.8% for AGIs $100k-200k , 1.4% for AGIs over 200k ) Ordinary dividends: $4,653 (reported on 21.0% of returns )(% of AGI for various income ranges: 2.3% for AGIs below $25k , 1.2% for AGIs $25k-50k , 1.5% for AGIs $50k-75k , 1.6% for AGIs $75k-100k , 1.9% for AGIs $100k-200k , 5.7% for AGIs over 200k ) Net capital gain/loss in AGI: +$4,353 (reported on 15.8% of returns )Here:
+$4,353State:
+$10,406
(% of AGI for various income ranges: 0.1% for AGIs $25k-50k , 0.4% for AGIs $50k-75k , 0.6% for AGIs $75k-100k , 1.6% for AGIs $100k-200k , 8.7% for AGIs over 200k ) Profit/loss from business: +$7,699 (reported on 11.5% of returns )Here:
+$7,699State:
+$11,105
(% of AGI for various income ranges: 4.6% for AGIs below $25k , 1.5% for AGIs $25k-50k , 1.5% for AGIs $50k-75k , 1.8% for AGIs $75k-100k , 2.3% for AGIs $100k-200k ) Taxable individual retirement arrangement distribution: $12,115 (reported on 14.6% of returns )46815:
$12,115Indiana:
$13,841
(% of AGI for various income ranges: 5.1% for AGIs below $25k , 3.5% for AGIs $25k-50k , 3.7% for AGIs $50k-75k , 3.4% for AGIs $75k-100k , 4.1% for AGIs $100k-200k , 2.9% for AGIs over 200k ) Total itemized deductions: $18,000 (20% of AGI, reported on 25.6% of returns )Here:
$18,000State:
$20,913
Here:
20.4% of AGIState:
18.2% of AGI
(% of AGI for various income ranges: 9.0% for AGIs below $25k , 8.1% for AGIs $25k-50k , 9.5% for AGIs $50k-75k , 9.8% for AGIs $75k-100k , 11.1% for AGIs $100k-200k , 11.5% for AGIs over 200k ) Charity contributions: $5,026 (reported on 20.6% of returns )(% of AGI for various income ranges: 1.0% for AGIs below $25k , 1.2% for AGIs $25k-50k , 1.8% for AGIs $50k-75k , 2.3% for AGIs $75k-100k , 2.8% for AGIs $100k-200k , 4.6% for AGIs over 200k ) Taxes paid: $5,298 (reported on 25.6% of returns )(% of AGI for various income ranges: 1.1% for AGIs below $25k , 1.7% for AGIs $25k-50k , 2.5% for AGIs $50k-75k , 3.0% for AGIs $75k-100k , 4.1% for AGIs $100k-200k , 4.6% for AGIs over 200k ) Earned income credit: $2,131 (reported on 16.7% of returns )(% of AGI for various income ranges: 5.5% for AGIs below $25k , 1.1% for AGIs $25k-50k ) Percentage of individuals using paid preparers for their 2012 taxes: 44.5%(% for various income ranges: 39.1% for AGIs below $25k , 45.2% for AGIs $25k-50k , 47.5% for AGIs $50k-75k , 48.8% for AGIs $75k-100k , 55.3% for AGIs $100k-200k , 76.9% for AGIs over 200k )
Averages for the 2004 tax year for zip code 46815, filed in 2005:
Average Adjusted Gross Income (AGI) in 2004: $43,721 (Individual Income Tax Returns) Here:
$43,721State:
$44,790
Salary/wage: $39,796 (reported on 83.4% of returns )Here:
$39,796State:
$39,615
(% of AGI for various income ranges: 95.6% for AGIs below $10k , 68.1% for AGIs $10k-25k , 78.1% for AGIs $25k-50k , 81.3% for AGIs $50k-75k , 83.9% for AGIs $75k-100k , 64.8% for AGIs over 100k ) Taxable interest for individuals: $1,617 (reported on 52.0% of returns )This zip code:
$1,617Indiana:
$1,535
(% of AGI for various income ranges: 7.1% for AGIs below $10k , 3.9% for AGIs $10k-25k , 2.1% for AGIs $25k-50k , 1.4% for AGIs $50k-75k , 1.0% for AGIs $75k-100k , 1.9% for AGIs over 100k ) Taxable dividends: $2,935 (reported on 28.9% of returns )(% of AGI for various income ranges: 4.2% for AGIs below $10k , 2.5% for AGIs $10k-25k , 1.7% for AGIs $25k-50k , 1.6% for AGIs $50k-75k , 1.2% for AGIs $75k-100k , 2.6% for AGIs over 100k ) Net capital gain/loss: +$4,440 (reported on 22.3% of returns )Here:
+$4,440State:
+$8,619
(% of AGI for various income ranges: 0.7% for AGIs below $10k , 0.5% for AGIs $10k-25k , 0.4% for AGIs $25k-50k , 0.6% for AGIs $50k-75k , 1.0% for AGIs $75k-100k , 6.7% for AGIs over 100k ) Profit/loss from business: +$7,751 (reported on 11.7% of returns )Here:
+$7,751State:
+$10,071
(% of AGI for various income ranges: 2.7% for AGIs below $10k , 2.8% for AGIs $10k-25k , 2.0% for AGIs $25k-50k , 1.9% for AGIs $50k-75k , 1.6% for AGIs $75k-100k , 2.3% for AGIs over 100k ) Profit/loss from farming: +$727 (reported on 0.2% of returns )
Here : State :
IRA payment deduction: $2,956 (reported on 2.5% of returns )46815:
$2,956Indiana:
$2,840
(% of AGI for various income ranges: 0.2% for AGIs below $10k , 0.2% for AGIs $10k-25k , 0.3% for AGIs $25k-50k , 0.2% for AGIs $50k-75k , 0.2% for AGIs $75k-100k , 0.1% for AGIs over 100k ) Self-employed pension: $11,981 (reported on 0.4% of returns )Here:
$11,981Indiana:
$15,305
(% of AGI for various income ranges: 0.1% for AGIs $50k-75k , 0.1% for AGIs $75k-100k , 0.3% for AGIs over 100k ) Total itemized deductions: $15,396 (21% of AGI, reported on 36.6% of returns )Here:
$15,396State:
$17,065
Here:
20.8% of AGIState:
19.5% of AGI
(% of AGI for various income ranges: 18.5% for AGIs below $10k , 11.3% for AGIs $10k-25k , 12.9% for AGIs $25k-50k , 12.8% for AGIs $50k-75k , 13.7% for AGIs $75k-100k , 12.6% for AGIs over 100k ) Charity contributions deductions: $3,630 (5% of AGI, reported on 32.6% of returns )Here:
4.7% of AGIState:
3.8% of AGI
(% of AGI for various income ranges: 1.0% for AGIs below $10k , 1.7% for AGIs $10k-25k , 2.1% for AGIs $25k-50k , 2.4% for AGIs $50k-75k , 2.9% for AGIs $75k-100k , 3.8% for AGIs over 100k ) Total tax: $5,986 (reported on 75.5% of returns )(% of AGI for various income ranges: 2.1% for AGIs below $10k , 3.9% for AGIs $10k-25k , 6.8% for AGIs $25k-50k , 8.1% for AGIs $50k-75k , 10.1% for AGIs $75k-100k , 17.8% for AGIs over 100k ) Earned income credit: $1,600 (reported on 10.4% of returns )Percentage of individuals using paid preparers for their 2004 taxes: 49.9%(% for various income ranges: 39.5% for AGIs below $10k , 52.7% for AGIs $10k-25k , 51.5% for AGIs $25k-50k , 53.2% for AGIs $50k-75k , 52.1% for AGIs $75k-100k , 55.9% for AGIs over 100k )
Estimated median household income in 2022: This zip code:
$64,068Indiana:
$66,785
Nearest zip codes: 46803 ,
46835 ,
46805 ,
46806 ,
46825 ,
46774 .
New Haven Zip Code Map
Percentage of family households: This zip code:
46.0%Indiana:
46.2%
Percentage of households with unmarried partners: This zip code:
4.1%Indiana:
48.0%
No gay or lesbian households reported
Household received Food Stamps/SNAP in the past 12 months: 973Household did not receive Food Stamps/SNAP in the past 12 months: 9,669
Women who had a birth in the past 12 months: 475 (341 now married , 136 unmarried) Women who did not have a birth in the past 12 months: 6,015 (2,347 now married , 3,663 unmarried)
Housing units in zip code 46815 with a mortgage: 5,350 (401
second mortgage , 303
both second mortgage and home equity loan )
Houses without a mortgage: 378
Median monthly owner costs for units with a mortgage: $1,147
Median monthly owner costs for units without a mortgage: $483
Residents with income below the poverty level in 2022:
This zip code:
12.0%Whole state:
12.6%
Residents with income below 50% of the poverty level in 2022:
This zip code:
8.1%Whole state:
6.3%
Median number of rooms in houses and condos: Median number of rooms in apartments:
Year house built (houses)
11 2020 or later265 2010 to 2019529 2000 to 20091,150 1990 to 19991,683 1980 to 19893,294 1970 to 19792,527 1960 to 19691,163 1950 to 195992 1940 to 194934 1939 or earlier
Zip code 46815 household income distribution in 2022 481 Less than $10,000574 $10,000 to $14,999257 $15,000 to $19,999560 $20,000 to $24,999290 $25,000 to $29,999400 $30,000 to $34,999515 $35,000 to $39,999465 $40,000 to $44,999431 $45,000 to $49,999758 $50,000 to $59,9991,440 $60,000 to $74,9991,355 $75,000 to $99,9991,226 $100,000 to $124,999895 $125,000 to $149,999583 $150,000 to $199,999381 $200,000 or moreEstimate of home value of owner-occupied houses/condos in 2022 in zip code 46815 137 Less than $10,00059 $10,000 to $14,99923 $15,000 to $19,99918 $20,000 to $24,99920 $25,000 to $29,99931 $30,000 to $34,9999 $50,000 to $59,99941 $60,000 to $69,99933 $70,000 to $79,999225 $80,000 to $89,999141 $90,000 to $99,999632 $100,000 to $124,9991,010 $125,000 to $149,9991,302 $150,000 to $174,9991,045 $175,000 to $199,9991,650 $200,000 to $249,999587 $250,000 to $299,999283 $300,000 to $399,99939 $400,000 to $499,99951 $500,000 to $749,99932 $750,000 to $999,99917 $2,000,000 or moreRent paid by renters in 2022 in zip code 46815 130 $150 to $19945 $200 to $24911 $250 to $29917 $350 to $3999 $400 to $44981 $500 to $549126 $550 to $599220 $600 to $649246 $650 to $699467 $700 to $749119 $750 to $799268 $800 to $899312 $900 to $999216 $1,000 to $1,249277 $1,250 to $1,49956 $1,500 to $1,99916 $2,000 to $2,49918 $3,000 to $3,49927 No cash rent
Median gross rent in 2022: $936.
Median price asked for vacant for-sale houses and condos in 2022: $862,446.
Estimated median house (or condo) value in 2022 for: White Non-Hispanic householders: $191,876Black or African American householders: $197,212American Indian or Alaska Native householders: $310,441Asian householders: $345,812Some other race householders: $161,840Two or more races householders: $189,900Hispanic or Latino householders: $169,349Estimated median house or condo value in 2022: $191,877
46815:
$191,877Indiana:
$208,700
Lower value quartile - upper value quartile: $147,020 - $242,366
Mean price in 2022: Detached houses: $199,291Here:
$199,291State:
$257,916
Townhouses or other attached units: $129,527Here:
$129,527State:
$224,114
In 2-unit structures: $40,699Here:
$40,699State:
$175,375
In 3-to-4-unit structures: $282,620Here:
$282,620State:
$151,116
In 5-or-more-unit structures: $128,347Here:
$128,347State:
$200,844
Mobile homes: $49,266Here:
$49,266State:
$67,116
Housing units in structures:
One, detached: 7,941One, attached: 505Two: 1483 or 4: 6915 to 9: 75110 to 19: 41720 to 49: 17350 or more: 429Mobile homes: 50Unemployment : 5.5%
Means of transportation to work in zip code 46815 78.4% 10,069 Drove a car alone7.8% 997 Carpooled0.4% 45 Bus or trolley bus0.1% 17 Taxi0.8% 109 Bicycle1.9% 245 Walked1.2% 157 Other means9.0% 1,155 Worked at homeTravel time to work (commute) in zip code 46815 316 Less than 5 minutes831 5 to 9 minutes2,409 10 to 14 minutes2,090 15 to 19 minutes2,636 20 to 24 minutes833 25 to 29 minutes1,355 30 to 34 minutes109 35 to 39 minutes46 40 to 44 minutes184 45 to 59 minutes305 60 to 89 minutes530 90 or more minutes
Percentage of zip code residents living and working in this county: 91.1%
Household type by relationship:
Households: 27,088
Male householders: 4,669 (1,171 living alone ), Female householders: 5,989 (2,106 living alone )5,280 spouses (5,216 opposite-sex spouses ), 619 unmarried partners , (585 opposite-sex unmarried partners ), 7,929 children (7,332 natural , 281 adopted , 314 stepchildren ), 485 grandchildren , 98 brothers or sisters , 138 parents , 86 foster children , 166 other relatives , 474 non-relatives In group quarters: 1,187 (-1 institutionalized population )
Size of family households: 2,811 2-persons , 1,594 3-persons , 1,062 4-persons , 753 5-persons , 265 6-persons , 165 7-or-more-persons
Size of nonfamily households: 3,281 1-person , 650 2-persons , 64 3-persons
3,964 married couples with children. single-parent households (166 men , 1,759 women ).
91.7% of residents of 46815 zip code speak English at home. of residents speak Spanish at home (99% very well, 1% well ).of residents speak other Indo-European language at home (66% very well, 23% well, 11% not well ).of residents speak Asian or Pacific Island language at home (59% very well, 14% well, 25% not well, 2% not at all ).of residents speak other language at home (90% very well, 10% well ).
Foreign born population: 1,259 (4.6%)
(73.6%
of them are naturalized citizens )
This zip code:
4.6%Whole state:
6.1%
5% Laos 5% Bhutan 5% Honduras 5% Singapore 3% Liberia 3% Thailand 2% France 22% German 13% American 12% English 6% Irish 5% European 3% Polish 2% Dutch
Year of entry for the foreign-born population
1,136 2010 or later 427 2000 to 2009 119 1990 to 1999 217 Before 1990
There are
140 Medical Specialists in Zip Code 46815 .
Facilities with environmental interests located in this zip code:
AMOCO SERVICE STATION 2341 (5916 ST JOE RD in FORT WAYNE, IN)
STATE MASTER (Indiana facility tracking) - CRTK-7590, EPCRA, UST-15135, UNDERGROUND STORAGE TANK PROGRAM (Resource Conservation and Recovery Act (tracking hazardous waste)) Organizations: AMOCO OIL CO (CONTACT/OWNER)
Alternative names: AMOCO OIL CO 2341
MAPLEWOOD SHELL SERVICE STATION (6132 STELLHORN RD in FORT WAYNE, IN)
STATE MASTER (Indiana facility tracking) - CRTK-4020, EPCRA, LUST-199311554, LEAKING STORAGE TANK, UST-129, UNDERGROUND STORAGE TANK PROGRAM (Resource Conservation and Recovery Act (tracking hazardous waste)) Organizations: WILLIWMS BILL (CONTACT/OWNER)
SHOAFF PARK GOLF COURSE (6401 ST JOE RD in FORT WAYNE, IN)
STATE MASTER (Indiana facility tracking) - LUST-199510510, LEAKING STORAGE TANK, UST-1997, UNDERGROUND STORAGE TANK PROGRAM Conditionally Exempt Small Quantity Generators, less than 100 kg/month of hazardous waste (Resource Conservation and Recovery Act (tracking hazardous waste)) - notification Organizations: CITY OF FT WAYNE (CONTACT/OWNER)
BLACKHAWK MIDDLE SCHOOL (7200 E STATE BLVD in FORT WAYNE, IN)
(National Center for Education Statistics) - STATE ID-0107 Organizations: FORT WAYNE COMMUNITY SCHOOLS (SCHOOL DISTRICT)
R NELSON SNIDER HIGH SCHOOL (4600 FAIRLAWN PASS in FORT WAYNE, IN)
(National Center for Education Statistics) - STATE ID-0102 Organizations: FORT WAYNE COMMUNITY SCHOOLS (SCHOOL DISTRICT)
ONE HOUR MARTINIZING (2616 MAPLECREST RD in FORT WAYNE, IN)
STATE MASTER (Indiana facility tracking) (Resource Conservation and Recovery Act (tracking hazardous waste)) Organizations: ALLEN CO DRY CLEANING (CONTACT/OWNER)
QUICK LUBE OF INDIANA (6353 STELLHORN RD in FORT WAYNE, IN)
STATE MASTER (Indiana facility tracking) (Resource Conservation and Recovery Act (tracking hazardous waste)) Organizations: SCHAVEY LARRY (CONTACT/OWNER)
MASTER CLEANERS (6121 PLANTATION LN in FORT WAYNE, IN)
STATE MASTER (Indiana facility tracking) Conditionally Exempt Small Quantity Generators, less than 100 kg/month of hazardous waste (Resource Conservation and Recovery Act (tracking hazardous waste)) - notification Organizations: RUMAC INC (CONTACT/OWNER)
LSI HAMILTON PK (6012 STELLHORN RD in FORT WAYNE, IN)
STATE MASTER (Indiana facility tracking) Conditionally Exempt Small Quantity Generators, less than 100 kg/month of hazardous waste (Resource Conservation and Recovery Act (tracking hazardous waste)) - notification Organizations: DON WALDROP (CONTACT/OWNER)
Housing units lacking complete plumbing facilities: 0.5%
Housing units lacking complete kitchen facilities: 0.7%
75.6% Utility gas 22.6% Electricity 1.1% Bottled, tank, or LP gas
Population in 1990: 25,377. Population change in the 1990s: +978 (+3.9%).
Place of birth for U.S.-born residents:
This state: 18,706Northeast: 807Midwest: 4,067South: 1,077West: 633
57% of the 46815 zip code residents lived in the same house 5 years ago.
Out of people who lived in different houses, 74% lived in this county.
Out of people who lived in different counties, 50% lived in Indiana.
91% of the 46815 zip code residents lived in the same house 1 year ago.
Out of people who lived in different houses, 74% moved from this county.
Out of people who lived in different houses, 13% moved from different county within same state.
Out of people who lived in different houses, 10% moved from different state.
Out of people who lived in different houses, 2% moved from abroad.
Private vs. public school enrollment:
Students in private schools in grades 1 to 8 (elementary and middle school): 786
Students in private schools in grades 9 to 12 (high school): 493
Students in private undergraduate colleges: 287
Occupation by median earnings in the past 12 months ($)
90,939 Architecture and engineering occupations 65,559 Management occupations 63,894 Computer and mathematical occupations 58,887 Health diagnosing and treating practitioners and other technical occupations 53,216 Production occupations 47,612 Fire fighting and prevention, and other protective service workers including supervisors
Companies with federal contracts located in this zip code:
TEMPORARY SOLUTION, INC (2210 MAPLECREST RD in FORT WAYNE, IN; small business) in 6 contracts from 2002 to 2004
Contracts for Food Services by ArmySigned by year: 2000: $0; 2001: $0; 2002: $22,924; 2003: $0; 2004: $25,185; 2005: $0; 2006: $0.
Biggest contracts: with Army for Food Services. Signed on 2004-10-01. Completion date: 2005-09-30.
, same as above. Signed on 2003-10-20. Completion date: 2004-09-30.
, same as above. Signed on 2002-10-02. Completion date: 2003-09-07.
, same as above. Signed on 2003-10-17. Completion date: 2003-10-17.
GOEGLEINS INC (7311 MAYSVILLE RD in FORT WAYNE, IN; small business) in 3 contracts from 2003 to 2006
$7,575 with Army for Special Dietary Foods and Food Specialty Preparations. Signed on 2003-03-09. Completion date: 2003-03-09.
, same as above. Signed on 2003-04-17. Completion date: 2003-04-12.
, same as above. Signed on 2006-02-28. Completion date: 2006-02-26.
Top industries in this zip code by the number of employees in 2005:
Administrative and Support and Waste Management and Remediation Services: Temporary Help Services (100-249 employees: 2 establishments, 50-99 employees: 4 establishments, 20-49 employees: 2 establishments, 10-19 employees: 1 establishment, 1-4 employees: 2 establishments)Accommodation and Food Services: Full-Service Restaurants (100-249: 1, 50-99: 3, 20-49: 3, 10-19: 3, 1-4: 1)Other Services (except Public Administration): Religious Organizations (100-249: 1, 50-99: 2, 20-49: 3, 10-19: 2, 5-9: 3, 1-4: 7)Accommodation and Food Services: Limited-Service Restaurants (50-99: 1, 20-49: 7, 10-19: 3, 5-9: 1, 1-4: 3)Health Care and Social Assistance: Offices of Dentists (20-49: 3, 10-19: 9, 5-9: 12, 1-4: 5)Health Care and Social Assistance: Nursing Care Facilities (100-249: 1, 50-99: 1)Health Care and Social Assistance: Offices of Physicians (except Mental Health Specialists) (100-249: 1, 10-19: 3, 5-9: 1, 1-4: 1)Health Care and Social Assistance: Continuing Care Retirement Communities (100-249: 1, 20-49: 1)Finance and Insurance: Insurance Agencies and Brokerages (10-19: 3, 5-9: 5, 1-4: 27)
People in group quarters in 2010:
572 people in college/university student housing
206 people in nursing facilities/skilled-nursing facilities
30 people in group homes intended for adults
8 people in residential treatment centers for adults
People in group quarters in 2000:
355 people in nursing homes
38 people in homes for the mentally retarded
6 people in religious group quarters
Fatal accident statistics in 2014:
Fatal accident count: 4Vehicles involved in fatal accidents: 6Fatal accidents caused by drunken drivers: 3Fatalities: 4Persons involved in fatal accidents: 9Pedestrians involved in fatal accidents: 2
Fatal accident statistics in 2013:
Fatal accident count: 1Vehicles involved in fatal accidents: 1Fatal accidents caused by drunken drivers: 0Fatalities: 1Persons involved in fatal accidents: 1Pedestrians involved in fatal accidents: 1
Home Mortgage Disclosure Act Aggregated Statistics For Year 2009(Based on 4 full and 12 partial tracts) A) FHA, FSA/RHS & VA B) Conventional C) Refinancings D) Home Improvement Loans E) Loans on Dwellings For 5+ Families F) Non-occupant Loans on G) Loans On Manufactured Number Average Value Number Average Value Number Average Value Number Average Value Number Average Value Number Average Value Number Average Value
LOANS ORIGINATED 410 $97,522 204 $90,540 1,053 $100,224 50 $31,743 2 $514,640 49 $85,053 0 $0 APPLICATIONS APPROVED, NOT ACCEPTED 26 $91,522 7 $62,440 81 $110,690 13 $13,200 0 $0 9 $165,820 1 $20,620 APPLICATIONS DENIED 57 $100,966 26 $71,815 254 $107,167 32 $39,276 0 $0 17 $75,225 2 $3,000 APPLICATIONS WITHDRAWN 33 $106,376 11 $81,978 223 $100,986 21 $56,256 0 $0 11 $63,926 0 $0 FILES CLOSED FOR INCOMPLETENESS 10 $83,848 7 $92,566 69 $97,970 2 $11,555 0 $0 1 $47,540 0 $0
Aggregated Statistics For Year 2008(Based on 4 full and 12 partial tracts) A) FHA, FSA/RHS & VA B) Conventional C) Refinancings D) Home Improvement Loans E) Loans on Dwellings For 5+ Families F) Non-occupant Loans on G) Loans On Manufactured Number Average Value Number Average Value Number Average Value Number Average Value Number Average Value Number Average Value Number Average Value
LOANS ORIGINATED 278 $100,187 248 $91,422 524 $98,708 92 $24,218 2 $1,227,325 36 $90,784 1 $19,380 APPLICATIONS APPROVED, NOT ACCEPTED 9 $97,922 30 $104,999 61 $93,142 26 $18,008 0 $0 7 $78,066 0 $0 APPLICATIONS DENIED 63 $102,670 44 $90,561 351 $104,038 88 $21,161 0 $0 24 $94,954 6 $15,913 APPLICATIONS WITHDRAWN 21 $95,092 20 $81,473 194 $104,430 9 $29,767 0 $0 12 $83,847 0 $0 FILES CLOSED FOR INCOMPLETENESS 6 $77,832 9 $95,379 49 $110,757 5 $49,766 0 $0 6 $86,042 0 $0
Aggregated Statistics For Year 2007(Based on 4 full and 12 partial tracts) A) FHA, FSA/RHS & VA B) Conventional C) Refinancings D) Home Improvement Loans E) Loans on Dwellings For 5+ Families F) Non-occupant Loans on G) Loans On Manufactured Number Average Value Number Average Value Number Average Value Number Average Value Number Average Value Number Average Value Number Average Value
LOANS ORIGINATED 144 $104,421 558 $93,306 568 $92,514 128 $25,111 4 $1,816,500 70 $75,535 0 $0 APPLICATIONS APPROVED, NOT ACCEPTED 1 $122,310 64 $91,087 132 $86,378 25 $21,962 0 $0 8 $89,356 1 $31,840 APPLICATIONS DENIED 36 $96,430 96 $94,359 465 $99,118 103 $24,966 0 $0 34 $72,912 2 $18,985 APPLICATIONS WITHDRAWN 12 $111,135 44 $77,374 236 $98,845 21 $30,587 0 $0 21 $72,928 0 $0 FILES CLOSED FOR INCOMPLETENESS 8 $107,714 17 $116,604 85 $119,170 5 $62,830 0 $0 6 $81,913 0 $0
Aggregated Statistics For Year 2006(Based on 4 full and 12 partial tracts) A) FHA, FSA/RHS & VA B) Conventional C) Refinancings D) Home Improvement Loans E) Loans on Dwellings For 5+ Families F) Non-occupant Loans on G) Loans On Manufactured Number Average Value Number Average Value Number Average Value Number Average Value Number Average Value Number Average Value Number Average Value
LOANS ORIGINATED 153 $106,393 786 $86,041 645 $86,137 133 $28,495 2 $2,072,550 86 $68,722 1 $20,570 APPLICATIONS APPROVED, NOT ACCEPTED 9 $119,596 122 $83,688 122 $85,822 21 $37,407 0 $0 14 $75,854 2 $64,955 APPLICATIONS DENIED 15 $119,504 160 $83,385 541 $98,045 138 $17,486 0 $0 26 $61,392 1 $17,300 APPLICATIONS WITHDRAWN 4 $127,052 60 $90,895 372 $100,137 16 $35,171 0 $0 12 $60,642 1 $80,600 FILES CLOSED FOR INCOMPLETENESS 13 $106,718 37 $96,963 103 $114,886 0 $0 0 $0 8 $84,474 0 $0
Aggregated Statistics For Year 2005(Based on 4 full and 12 partial tracts) A) FHA, FSA/RHS & VA B) Conventional C) Refinancings D) Home Improvement Loans E) Loans on Dwellings For 5+ Families F) Non-occupant Loans on G) Loans On Manufactured Number Average Value Number Average Value Number Average Value Number Average Value Number Average Value Number Average Value Number Average Value
LOANS ORIGINATED 212 $103,500 846 $87,216 857 $84,996 119 $26,848 9 $4,724,819 102 $95,060 2 $41,215 APPLICATIONS APPROVED, NOT ACCEPTED 11 $88,009 101 $77,774 146 $88,583 21 $33,567 0 $0 11 $71,862 6 $23,317 APPLICATIONS DENIED 18 $101,400 142 $81,341 661 $98,466 140 $27,989 0 $0 34 $50,536 5 $63,622 APPLICATIONS WITHDRAWN 4 $103,370 96 $95,510 465 $108,538 64 $126,752 0 $0 28 $82,821 0 $0 FILES CLOSED FOR INCOMPLETENESS 11 $110,448 48 $98,545 92 $105,106 8 $55,238 0 $0 5 $161,044 0 $0
Aggregated Statistics For Year 2004(Based on 4 full and 12 partial tracts) A) FHA, FSA/RHS & VA B) Conventional C) Refinancings D) Home Improvement Loans E) Loans on Dwellings For 5+ Families F) Non-occupant Loans on G) Loans On Manufactured Number Average Value Number Average Value Number Average Value Number Average Value Number Average Value Number Average Value Number Average Value
LOANS ORIGINATED 208 $96,219 644 $90,961 1,000 $89,337 108 $33,305 2 $1,135,205 92 $75,413 6 $43,095 APPLICATIONS APPROVED, NOT ACCEPTED 28 $93,390 79 $88,317 160 $90,910 21 $24,411 0 $0 12 $75,052 1 $20,520 APPLICATIONS DENIED 36 $93,865 151 $85,197 542 $91,182 102 $24,842 0 $0 31 $81,609 5 $30,128 APPLICATIONS WITHDRAWN 7 $87,701 65 $91,675 359 $101,354 45 $47,954 0 $0 23 $74,948 0 $0 FILES CLOSED FOR INCOMPLETENESS 9 $97,340 27 $98,260 67 $105,233 11 $50,162 0 $0 3 $76,807 0 $0
Aggregated Statistics For Year 2003(Based on 4 full and 12 partial tracts) A) FHA, FSA/RHS & VA B) Conventional C) Refinancings D) Home Improvement Loans E) Loans on Dwellings For 5+ Families F) Non-occupant Loans on Number Average Value Number Average Value Number Average Value Number Average Value Number Average Value Number Average Value
LOANS ORIGINATED 245 $93,086 579 $93,372 2,692 $88,439 107 $22,312 1 $323,040 147 $82,589 APPLICATIONS APPROVED, NOT ACCEPTED 9 $89,946 55 $89,787 282 $93,090 20 $22,076 0 $0 12 $70,973 APPLICATIONS DENIED 27 $93,067 75 $86,239 582 $89,729 64 $20,073 0 $0 17 $93,960 APPLICATIONS WITHDRAWN 15 $91,653 42 $94,084 440 $88,292 6 $22,097 0 $0 13 $136,564 FILES CLOSED FOR INCOMPLETENESS 8 $77,138 24 $80,130 85 $100,299 10 $42,106 0 $0 5 $56,200
Aggregated Statistics For Year 2002(Based on 2 full and 10 partial tracts) A) FHA, FSA/RHS & VA B) Conventional C) Refinancings D) Home Improvement Loans E) Loans on Dwellings For 5+ Families F) Non-occupant Loans on Number Average Value Number Average Value Number Average Value Number Average Value Number Average Value Number Average Value
LOANS ORIGINATED 219 $92,725 433 $88,218 1,382 $85,571 77 $20,417 2 $3,421,665 72 $71,169 APPLICATIONS APPROVED, NOT ACCEPTED 5 $96,170 22 $92,673 143 $85,007 23 $16,024 0 $0 5 $89,498 APPLICATIONS DENIED 20 $106,777 51 $78,008 322 $85,829 42 $13,111 0 $0 12 $72,691 APPLICATIONS WITHDRAWN 6 $93,423 24 $90,795 130 $98,707 3 $8,583 0 $0 2 $33,530 FILES CLOSED FOR INCOMPLETENESS 1 $92,360 14 $69,743 126 $92,149 2 $10,000 0 $0 1 $123,710
Aggregated Statistics For Year 2001(Based on 2 full and 10 partial tracts) A) FHA, FSA/RHS & VA B) Conventional C) Refinancings D) Home Improvement Loans E) Loans on Dwellings For 5+ Families F) Non-occupant Loans on Number Average Value Number Average Value Number Average Value Number Average Value Number Average Value Number Average Value
LOANS ORIGINATED 210 $89,578 330 $88,547 991 $79,351 110 $15,494 1 $596,020 43 $68,835 APPLICATIONS APPROVED, NOT ACCEPTED 7 $81,064 31 $95,310 121 $68,439 12 $15,967 0 $0 3 $65,277 APPLICATIONS DENIED 9 $89,621 54 $69,017 376 $73,213 54 $13,439 0 $0 19 $76,009 APPLICATIONS WITHDRAWN 2 $88,055 20 $110,269 133 $74,546 13 $8,698 0 $0 4 $33,452 FILES CLOSED FOR INCOMPLETENESS 4 $72,852 16 $73,932 26 $71,644 3 $79,330 0 $0 1 $45,850
Aggregated Statistics For Year 2000(Based on 2 full and 10 partial tracts) A) FHA, FSA/RHS & VA B) Conventional C) Refinancings D) Home Improvement Loans E) Loans on Dwellings For 5+ Families F) Non-occupant Loans on Number Average Value Number Average Value Number Average Value Number Average Value Number Average Value Number Average Value
LOANS ORIGINATED 162 $86,321 344 $85,873 322 $59,396 146 $14,601 2 $713,000 35 $68,736 APPLICATIONS APPROVED, NOT ACCEPTED 6 $92,765 29 $79,819 85 $61,587 31 $18,097 0 $0 4 $56,882 APPLICATIONS DENIED 12 $88,620 109 $53,196 186 $63,118 80 $18,597 0 $0 11 $68,216 APPLICATIONS WITHDRAWN 8 $84,612 15 $53,659 86 $60,173 20 $31,010 0 $0 0 $0 FILES CLOSED FOR INCOMPLETENESS 3 $43,597 2 $96,300 24 $71,062 0 $0 0 $0 1 $43,500
Aggregated Statistics For Year 1999(Based on 1 full and 6 partial tracts) A) FHA, FSA/RHS & VA B) Conventional C) Refinancings D) Home Improvement Loans E) Loans on Dwellings For 5+ Families F) Non-occupant Loans on Number Average Value Number Average Value Number Average Value Number Average Value Number Average Value Number Average Value
LOANS ORIGINATED 134 $82,225 314 $88,564 389 $65,102 86 $14,138 2 $1,668,250 24 $77,096 APPLICATIONS APPROVED, NOT ACCEPTED 2 $76,545 24 $79,938 74 $59,652 24 $12,296 0 $0 3 $46,110 APPLICATIONS DENIED 6 $88,313 59 $53,215 152 $56,135 43 $11,745 0 $0 5 $73,772 APPLICATIONS WITHDRAWN 7 $97,967 26 $79,349 140 $65,773 12 $31,186 0 $0 2 $78,635 FILES CLOSED FOR INCOMPLETENESS 1 $59,570 4 $83,622 17 $84,581 0 $0 0 $0 1 $31,350
Private Mortgage Insurance Companies Aggregated Statistics For Year 2009(Based on 4 full and 12 partial tracts) A) Conventional B) Refinancings C) Non-occupant Loans on Number Average Value Number Average Value Number Average Value
LOANS ORIGINATED 53 $105,353 73 $107,624 1 $111,410 APPLICATIONS APPROVED, NOT ACCEPTED 13 $92,777 12 $113,199 5 $69,922 APPLICATIONS DENIED 10 $95,459 2 $126,340 2 $68,000 APPLICATIONS WITHDRAWN 5 $51,008 6 $98,395 0 $0 FILES CLOSED FOR INCOMPLETENESS 0 $0 2 $148,000 0 $0
Aggregated Statistics For Year 2008(Based on 4 full and 12 partial tracts) A) Conventional B) Refinancings C) Non-occupant Loans on Number Average Value Number Average Value Number Average Value
LOANS ORIGINATED 123 $99,656 62 $116,891 8 $68,015 APPLICATIONS APPROVED, NOT ACCEPTED 42 $101,820 33 $130,474 5 $68,416 APPLICATIONS DENIED 12 $77,302 6 $93,475 10 $63,389 APPLICATIONS WITHDRAWN 1 $67,010 3 $88,943 0 $0 FILES CLOSED FOR INCOMPLETENESS 4 $82,725 1 $118,230 1 $71,180
Aggregated Statistics For Year 2007(Based on 4 full and 12 partial tracts) A) Conventional B) Refinancings C) Non-occupant Loans on Number Average Value Number Average Value Number Average Value
LOANS ORIGINATED 280 $104,955 130 $105,228 30 $89,091 APPLICATIONS APPROVED, NOT ACCEPTED 46 $100,025 32 $107,689 8 $74,489 APPLICATIONS DENIED 4 $63,078 1 $72,890 1 $37,850 APPLICATIONS WITHDRAWN 6 $107,208 6 $132,588 2 $110,920 FILES CLOSED FOR INCOMPLETENESS 0 $0 1 $52,310 0 $0
Aggregated Statistics For Year 2006(Based on 4 full and 12 partial tracts) A) Conventional B) Refinancings C) Non-occupant Loans on Number Average Value Number Average Value Number Average Value
LOANS ORIGINATED 233 $99,871 77 $116,177 12 $74,371 APPLICATIONS APPROVED, NOT ACCEPTED 22 $101,901 13 $120,161 2 $108,885 APPLICATIONS DENIED 4 $83,578 4 $153,778 5 $74,752 APPLICATIONS WITHDRAWN 14 $116,357 12 $104,584 3 $73,157 FILES CLOSED FOR INCOMPLETENESS 0 $0 3 $129,717 0 $0
Aggregated Statistics For Year 2005(Based on 4 full and 12 partial tracts) A) Conventional B) Refinancings C) Non-occupant Loans on Number Average Value Number Average Value Number Average Value
LOANS ORIGINATED 180 $102,202 133 $102,044 20 $89,637 APPLICATIONS APPROVED, NOT ACCEPTED 33 $113,233 24 $109,870 5 $78,494 APPLICATIONS DENIED 3 $70,410 1 $73,960 0 $0 APPLICATIONS WITHDRAWN 6 $103,817 12 $100,212 1 $142,900 FILES CLOSED FOR INCOMPLETENESS 1 $36,520 2 $71,510 0 $0
Aggregated Statistics For Year 2004(Based on 4 full and 12 partial tracts) A) Conventional B) Refinancings C) Non-occupant Loans on Number Average Value Number Average Value Number Average Value
LOANS ORIGINATED 235 $100,181 151 $107,055 29 $76,074 APPLICATIONS APPROVED, NOT ACCEPTED 250 $123,841 55 $121,672 12 $81,306 APPLICATIONS DENIED 7 $97,734 0 $0 3 $83,463 APPLICATIONS WITHDRAWN 29 $127,638 8 $87,602 2 $56,960 FILES CLOSED FOR INCOMPLETENESS 15 $86,903 6 $122,690 0 $0
Aggregated Statistics For Year 2003(Based on 4 full and 12 partial tracts) A) Conventional B) Refinancings C) Non-occupant Loans on Number Average Value Number Average Value Number Average Value
LOANS ORIGINATED 247 $99,071 459 $99,271 23 $65,075 APPLICATIONS APPROVED, NOT ACCEPTED 207 $112,331 101 $99,832 15 $74,041 APPLICATIONS DENIED 10 $86,739 4 $75,572 6 $82,153 APPLICATIONS WITHDRAWN 50 $131,858 22 $93,562 1 $82,290 FILES CLOSED FOR INCOMPLETENESS 4 $160,000 1 $96,950 0 $0
Aggregated Statistics For Year 2002(Based on 2 full and 10 partial tracts) A) Conventional B) Refinancings C) Non-occupant Loans on Number Average Value Number Average Value Number Average Value
LOANS ORIGINATED 194 $96,909 203 $92,418 19 $87,775 APPLICATIONS APPROVED, NOT ACCEPTED 19 $123,892 42 $95,483 6 $69,498 APPLICATIONS DENIED 2 $96,725 1 $96,690 2 $70,610 APPLICATIONS WITHDRAWN 6 $94,593 8 $97,346 3 $86,733 FILES CLOSED FOR INCOMPLETENESS 0 $0 0 $0 0 $0
Aggregated Statistics For Year 2001(Based on 2 full and 10 partial tracts) A) Conventional B) Refinancings C) Non-occupant Loans on Number Average Value Number Average Value Number Average Value
LOANS ORIGINATED 132 $101,923 154 $97,576 7 $99,700 APPLICATIONS APPROVED, NOT ACCEPTED 21 $83,018 18 $88,465 0 $0 APPLICATIONS DENIED 1 $57,100 6 $117,908 1 $35,190 APPLICATIONS WITHDRAWN 2 $176,955 3 $88,190 0 $0 FILES CLOSED FOR INCOMPLETENESS 0 $0 1 $58,190 0 $0
Aggregated Statistics For Year 2000(Based on 2 full and 10 partial tracts) A) Conventional B) Refinancings C) Non-occupant Loans on Number Average Value Number Average Value Number Average Value
LOANS ORIGINATED 132 $86,878 28 $76,528 9 $65,199 APPLICATIONS APPROVED, NOT ACCEPTED 21 $90,562 6 $99,998 1 $70,870 APPLICATIONS DENIED 1 $44,050 0 $0 0 $0 APPLICATIONS WITHDRAWN 1 $121,100 6 $86,667 0 $0 FILES CLOSED FOR INCOMPLETENESS 0 $0 0 $0 0 $0
Aggregated Statistics For Year 1999(Based on 1 full and 6 partial tracts) A) Conventional B) Refinancings C) Non-occupant Loans on Number Average Value Number Average Value Number Average Value
LOANS ORIGINATED 138 $95,608 62 $87,876 4 $64,200 APPLICATIONS APPROVED, NOT ACCEPTED 21 $109,449 10 $105,034 0 $0 APPLICATIONS DENIED 14 $101,614 4 $108,088 0 $0 APPLICATIONS WITHDRAWN 5 $86,422 0 $0 2 $51,045 FILES CLOSED FOR INCOMPLETENESS 5 $93,242 1 $98,090 0 $0
2003 - 2018 National Fire Incident Reporting System (NFIRS) incidents See full 2006 National Fire Incident Reporting System statistics for zip code 46815, Indiana
Most common first names in zip code 46815 among deceased individuals Name Count Lived (average)
Robert 168 72.5 years Mary 128 78.4 years John 117 75.8 years William 111 73.5 years James 108 72.4 years Helen 99 81.9 years Ruth 87 81.9 years Richard 78 68.9 years Dorothy 66 80.0 years Charles 65 75.6 years
Most common last names in zip code 46815 among deceased individuals Last name Count Lived (average)
Miller 54 80.3 years Smith 38 78.2 years Johnson 33 76.7 years Anderson 24 69.7 years Martin 19 75.2 years Brown 18 82.0 years Jones 18 73.8 years Bennett 18 74.2 years Snyder 18 80.4 years Fisher 15 72.8 years
Businesses in zip code 46815
Name Count Name Count
Advance Auto Parts 1 Payless 1 Arby's 1 Pizza Hut 1 Curves 1 RadioShack 1 Dairy Queen 1 Sprint Nextel 1 Fashion Bug 1 Starbucks 2 FedEx 5 Subway 2 GNC 1 T-Mobile 2 GameStop 1 Taco Bell 1 H&R Block 1 Target 1 Kroger 1 UPS 6 McDonald's 2 Walgreens 1 Papa John's Pizza 1 Wendy's 1

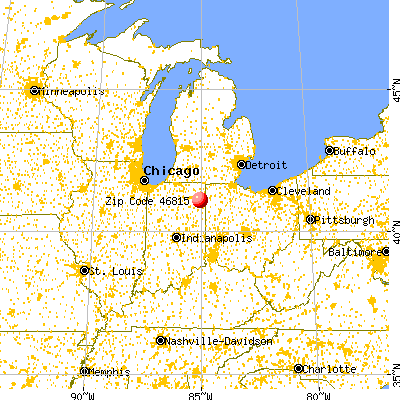


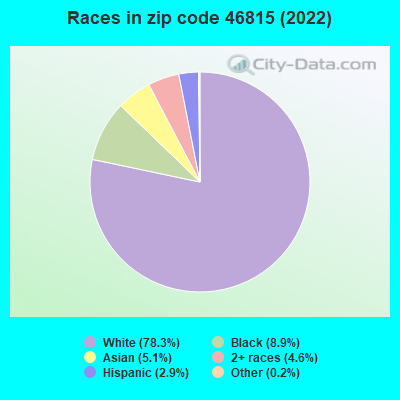


+$727
-$2,212
 Nearest zip codes: 46803, 46835, 46805, 46806, 46825, 46774.
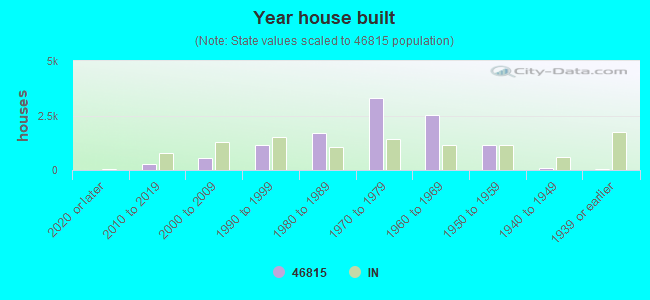

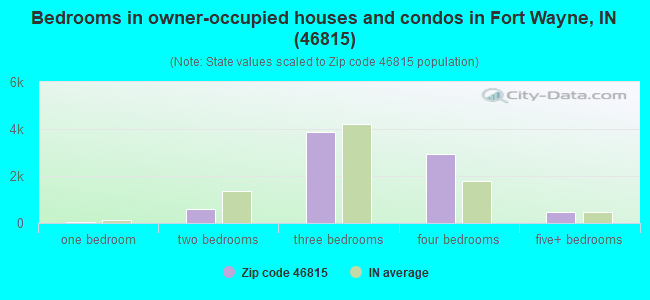
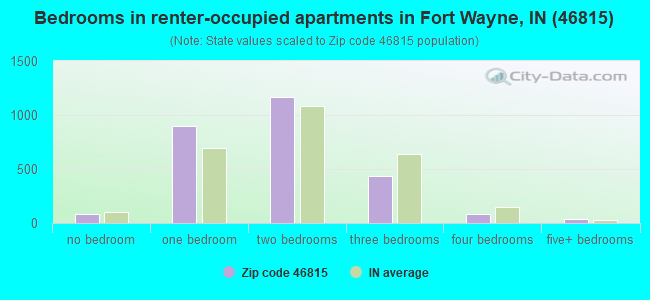
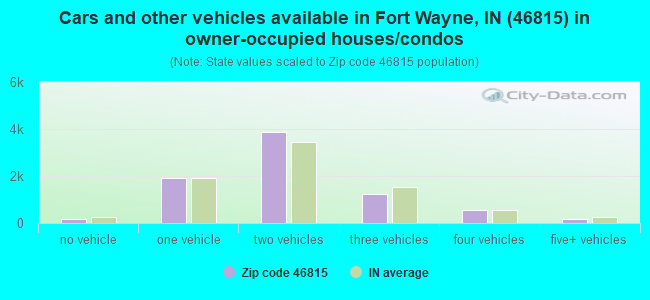
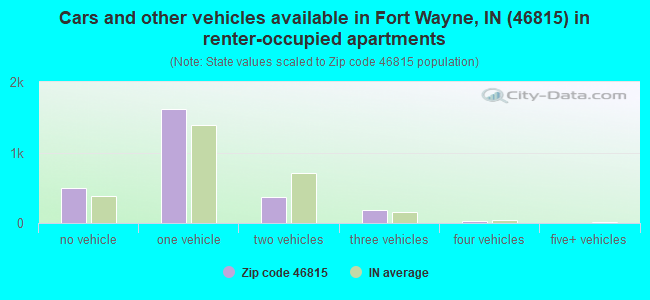


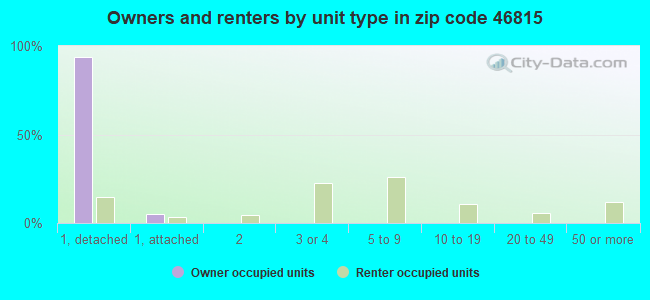
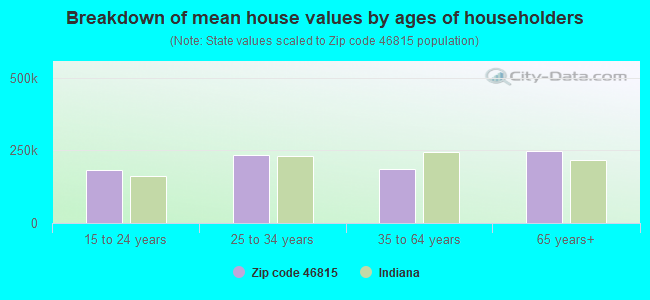


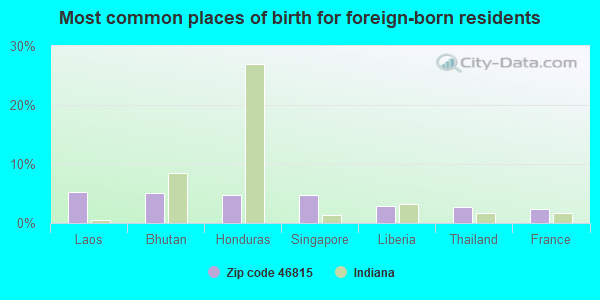
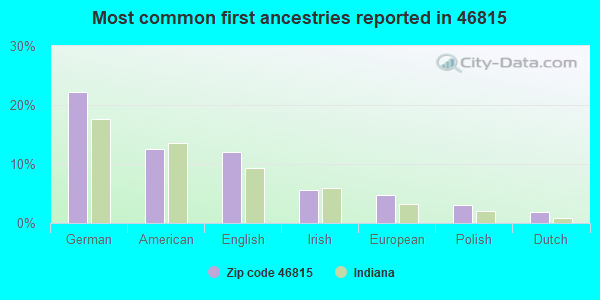
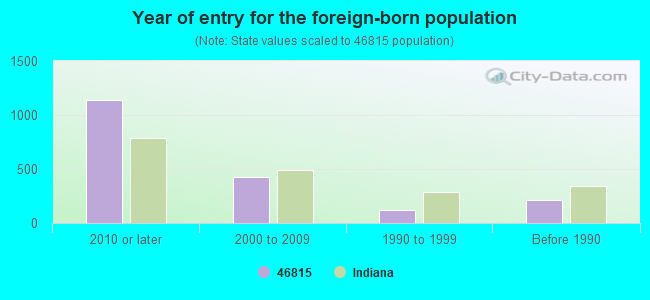


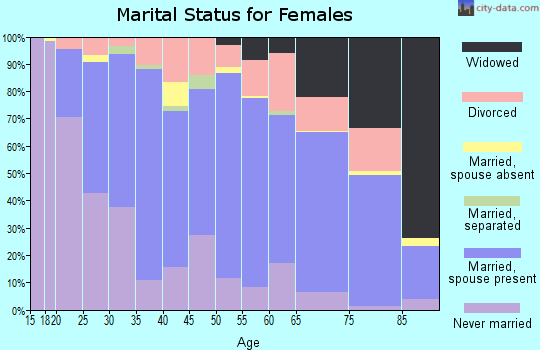
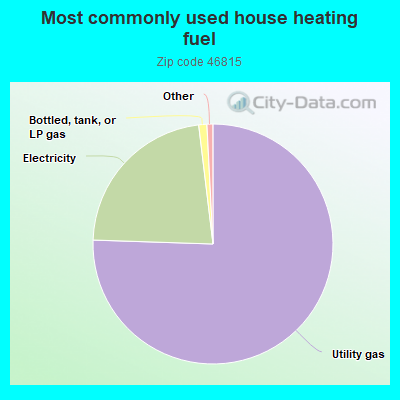
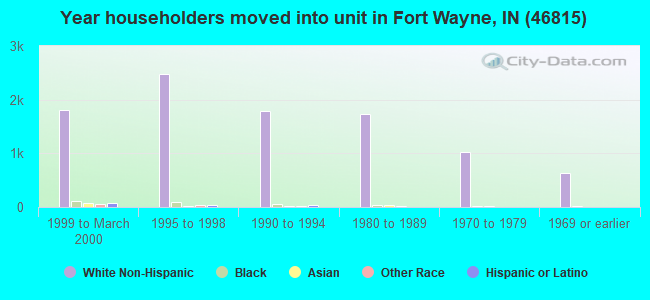
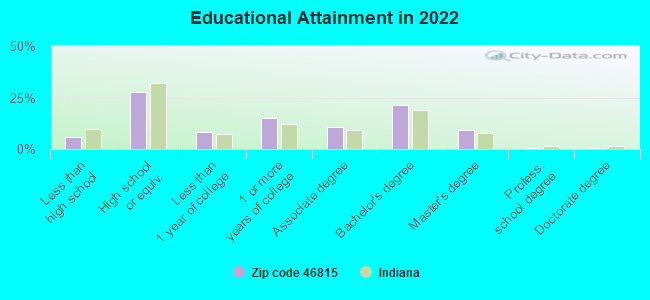
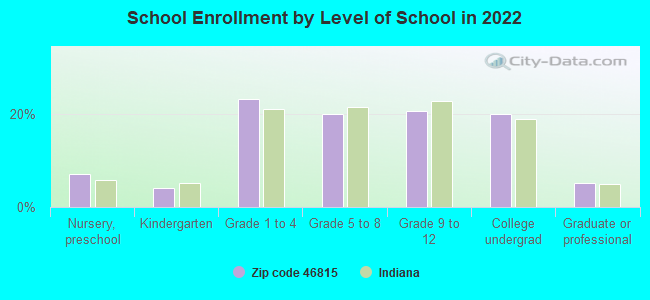
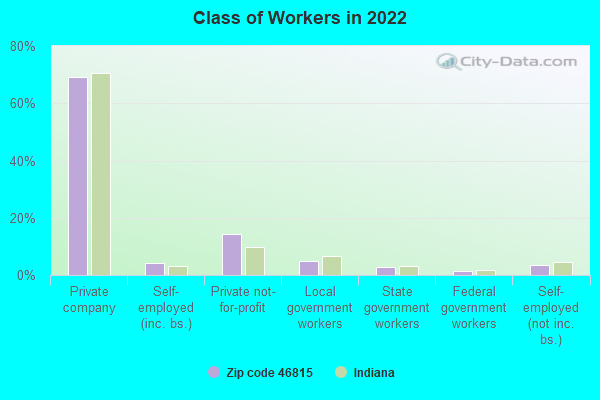
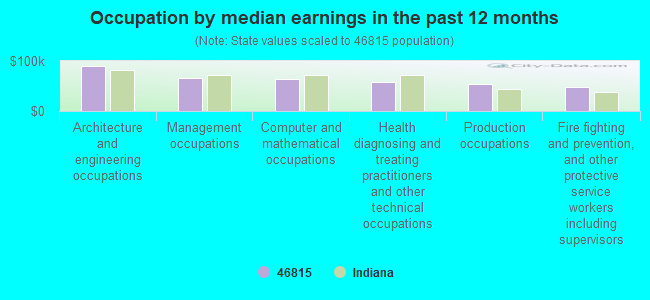
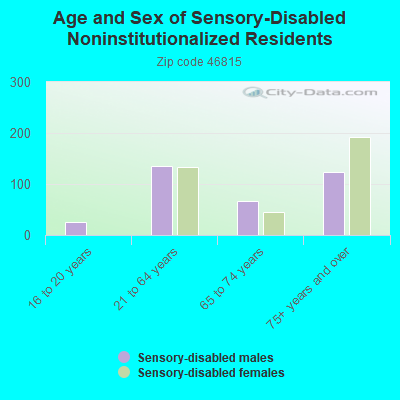
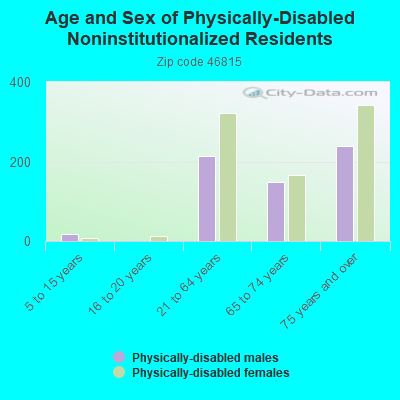
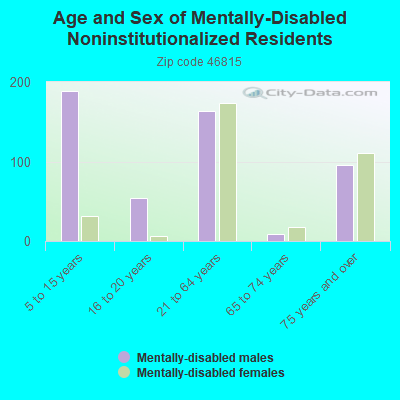
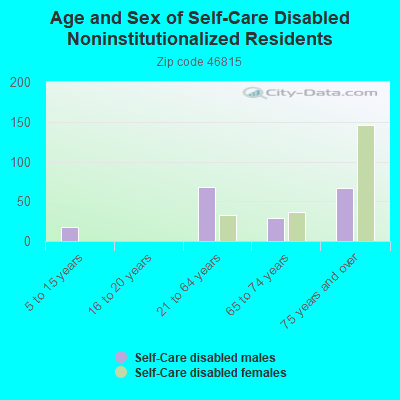
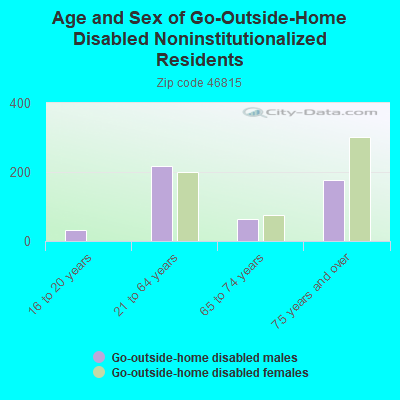
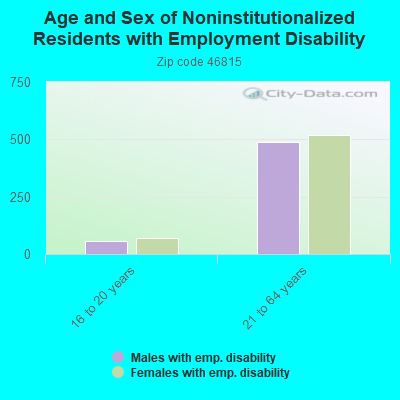
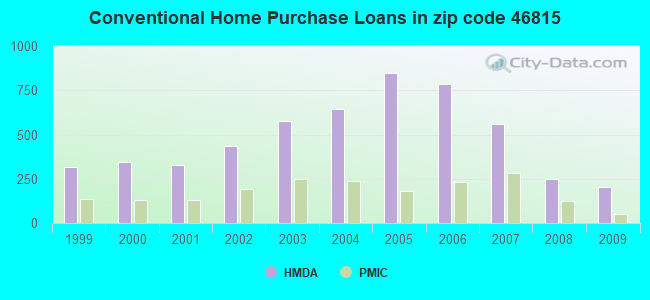
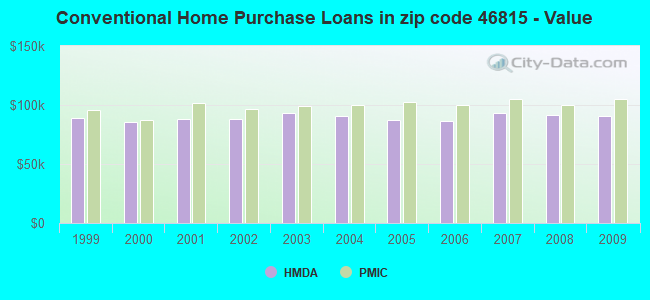
 Based on the data from the years 2003 - 2018 the average number of fire incidents per year is 42. The highest number of fires - 75 took place in 2017, and the least - 1 in 2004. The data has a rising trend.
 When looking into fire subcategories, the most reports belonged to: Outside Fires (42.5%), and Structure Fires (40.2%).