Estimated zip code population in 2022: 2,841 Zip code population in 2010: 2,548 Zip code population in 2000: 3,168
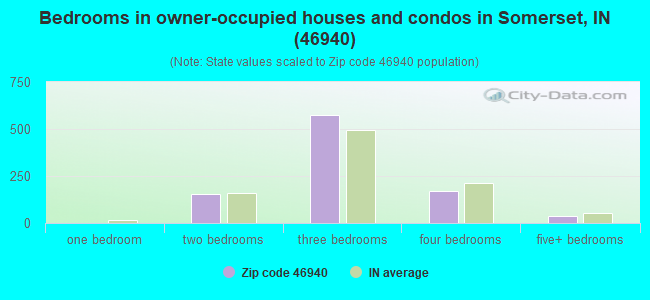
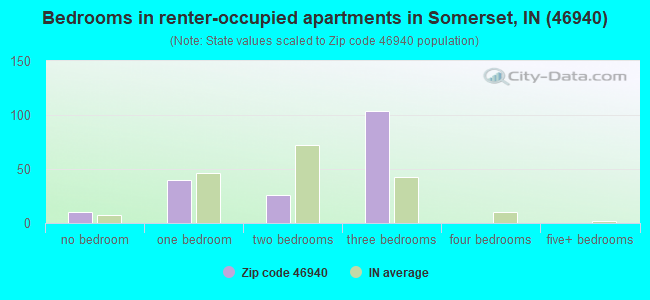
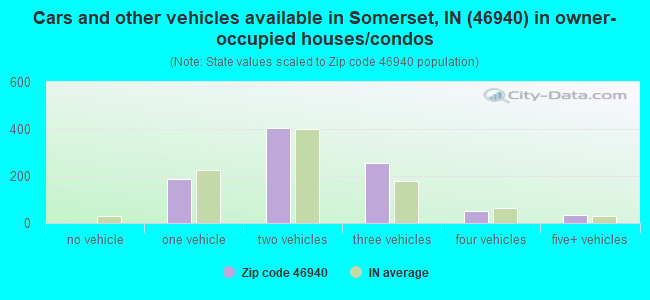
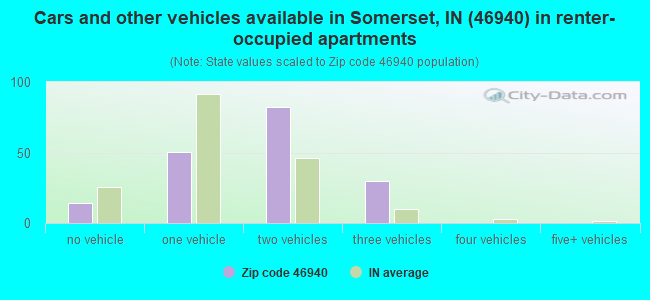
Houses and condos: 1,242 Renter-occupied apartments: 180
% of renters here:
16%
State:
29%
March 2022 cost of living index in zip code 46940: 85.2 (less than average, U.S. average is 100)
Land area: 56.8 sq. mi. Water area: 1.5 sq. mi.
Population density: 50 people per square mile
(very low).
OSM Map
General Map
Google Map
MSN Map
OSM Map
General Map
Google Map
MSN Map
OSM Map
General Map
Google Map
MSN Map
OSM Map
General Map
Google Map
MSN Map
Please wait while loading the map...
Real estate property taxes paid for housing units in 2022:
This zip code:
0.5% ($629)
Indiana:
0.7% ($1,467)
Median real estate property taxes paid for housing units with mortgages in 2022: $623 (0.6%) Median real estate property taxes paid for housing units with no mortgage in 2022: $641 (0.4%)
Business Search- 14 Million verified businesses
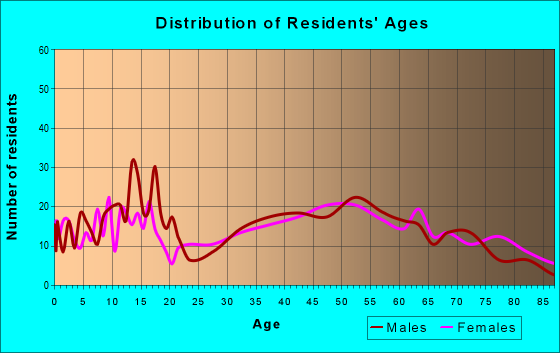
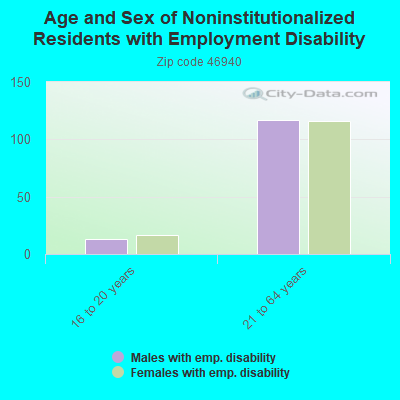
Males: 1,315
(46.3%)
Females: 1,526
(53.7%)
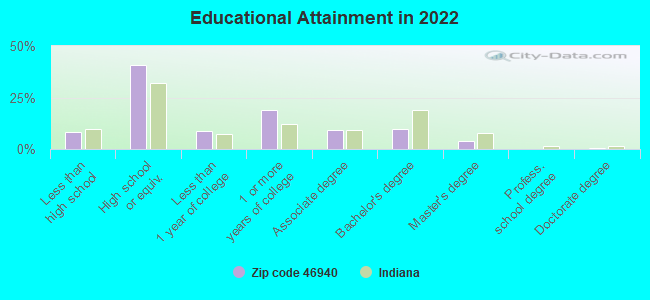
For population 25 years and over in 46940:
High school or higher: 90.1%
Bachelor's degree or higher: 13.8%
Graduate or professional degree: 4.3%
Unemployed: 2.7%
Mean travel time to work (commute): 20.8 minutes
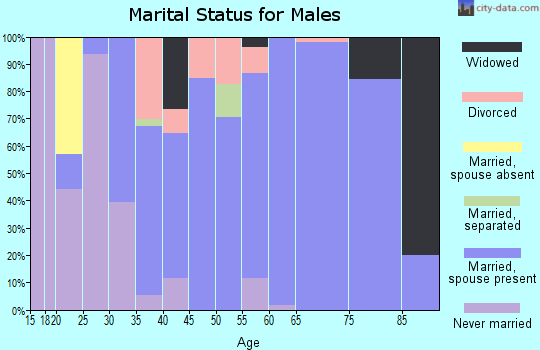
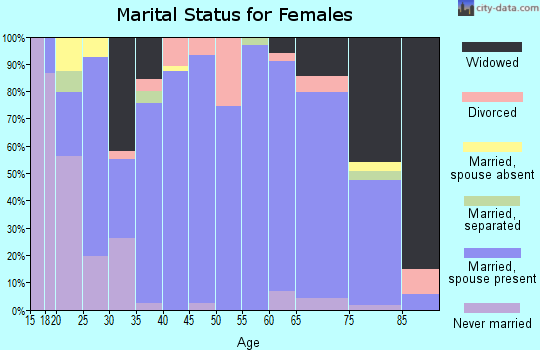
For population 15 years and over in 46940:
Never married: 21.7%
Now married: 59.3%
Separated: 0.0%
Widowed: 12.1%
Divorced: 6.9%
Zip code 46940 compared to state average:
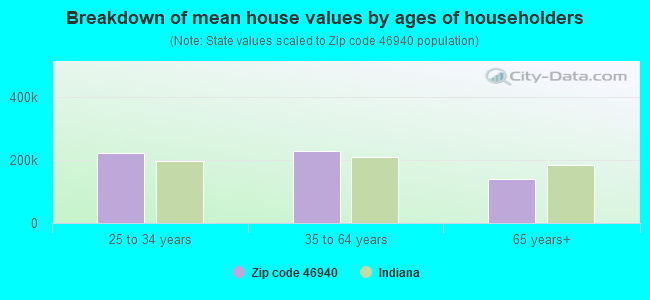
Median house value below state average.
Black race population percentage significantly below state average.
Hispanic race population percentage significantly below state average.
Median age above state average.
Foreign-born population percentage significantly below state average.
Renting percentage below state average.
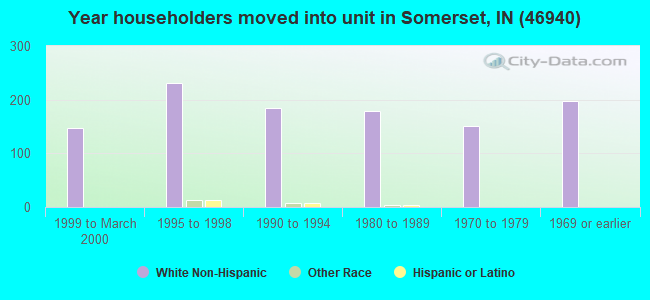
Length of stay since moving in significantly above state average.
Percentage of population with a bachelor's degree or higher below state average.
Estimated median house/condo value in 2022: $126,175
46940:
$126,175
Indiana:
$208,700
According to our research of Indiana and other state lists, there was 1 registered sex offender living in 46940 zip code as of April 27, 2024. The ratio of all residents to sex offenders in zip code 46940 is 2,692 to 1. The ratio of registered sex offenders to all residents in this zip code is much lower than the state average.
Median resident age:
This zip code:
43.8 years
Indiana median age:
38.2 years
Average household size:
This zip code:
2.4 people
Indiana:
2.4 people
Averages for the 2020 tax year for zip code 46940, filed in 2021:
Average Adjusted Gross Income (AGI) in 2020: $56,455 (Individual Income Tax Returns)
Here:
$56,455
State:
$64,978
Salary/wage: $51,743 (reported on 78.3% of returns)
Here:
$51,743
State:
$55,245
(% of AGI for various income ranges: 1034.6% for AGIs below $25k, 3633.3% for AGIs $25k-50k, 5945.3% for AGIs $50k-75k, 9188.6% for AGIs $75k-100k, 13845.8% for AGIs $100k-200k)
Taxable interest for individuals: $613 (reported on 40.0% of returns)
This zip code:
$613
Indiana:
$1,351
(% of AGI for various income ranges: 10.4% for AGIs below $25k, 16.2% for AGIs $25k-50k, 20.0% for AGIs $50k-75k, 47.1% for AGIs $75k-100k, 42.5% for AGIs $100k-200k)
Ordinary dividends: $2,588 (reported on 14.8% of returns)
Here:
$2,588
State:
$5,827
(% of AGI for various income ranges: 6.8% for AGIs below $25k, 17.1% for AGIs $25k-50k, 38.0% for AGIs $50k-75k, 88.6% for AGIs $75k-100k, 221.7% for AGIs $100k-200k)
Net capital gain/loss in AGI: +$7,106 (reported on 15.7% of returns)
Here:
+$7,106
State:
+$17,730
(% of AGI for various income ranges: 1.4% for AGIs below $25k, 17.1% for AGIs $25k-50k, 87.3% for AGIs $50k-75k, 131.4% for AGIs $75k-100k, 846.7% for AGIs $100k-200k)
Profit/loss from business: +$8,945 (reported on 9.6% of returns)
Here:
+$8,945
State:
+$12,144
(% of AGI for various income ranges: 155.0% for AGIs below $25k, 14.7% for AGIs $50k-75k, 440.0% for AGIs $100k-200k)
Taxable individual retirement arrangement distribution: $14,320 (reported on 13.0% of returns)
46940:
$14,320
Indiana:
$18,302
(% of AGI for various income ranges: 116.4% for AGIs below $25k, 101.9% for AGIs $25k-50k, 300.0% for AGIs $50k-75k, 642.9% for AGIs $75k-100k, 590.0% for AGIs $100k-200k)
Total itemized deductions: $38,167 (reported on 2.6% of returns)
Here:
$38,167
State:
$35,601
(% of AGI for various income ranges: 1635.7% for AGIs $75k-100k)
Charity contributions: $25,050 (reported on 1.7% of returns)
Here:
$25,050
State:
$15,596
(% of AGI for various income ranges: 715.7% for AGIs $75k-100k)
Taxes paid: $6,733 (reported on 2.6% of returns)
46940:
$6,733
State:
$7,542
(% of AGI for various income ranges: 288.6% for AGIs $75k-100k)
Earned income credit: $2,353 (reported on 13.0% of returns)
Here:
$2,353
State:
$2,298
(% of AGI for various income ranges: 83.2% for AGIs below $25k, 57.1% for AGIs $25k-50k)
Percentage of individuals using paid preparers for their 2020 taxes: 95.7%
Here:
96%
State:
94%
(% for various income ranges: 92.3% for AGIs below $25k, 96.3% for AGIs $25k-50k, 94.7% for AGIs $50k-75k, 100.0% for AGIs $75k-100k, 100.0% for AGIs $100k-200k, 100.0% for AGIs over 200k)
Averages for the 2012 tax year for zip code 46940, filed in 2013:
Average Adjusted Gross Income (AGI) in 2012: $55,256 (Individual Income Tax Returns)
Here:
$55,256
State:
$52,932
Salary/wage: $41,008 (reported on 83.1% of returns)
Here:
$41,008
State:
$45,173
(% of AGI for various income ranges: 63.0% for AGIs below $25k, 75.3% for AGIs $25k-50k, 78.0% for AGIs $50k-75k, 70.7% for AGIs $75k-100k, 73.7% for AGIs $100k-200k, 20.4% for AGIs over 200k)
Taxable interest for individuals: $1,002 (reported on 41.5% of returns)
This zip code:
$1,002
Indiana:
$1,311
(% of AGI for various income ranges: 1.8% for AGIs below $25k, 0.7% for AGIs $25k-50k, 0.6% for AGIs $50k-75k, 0.5% for AGIs $75k-100k, 0.3% for AGIs $100k-200k, 1.2% for AGIs over 200k)
Ordinary dividends: $1,667 (reported on 15.3% of returns)
Here:
$1,667
State:
$4,690
(% of AGI for various income ranges: 0.6% for AGIs below $25k, 0.7% for AGIs $25k-50k, 0.5% for AGIs $50k-75k, 0.4% for AGIs $75k-100k, 0.7% for AGIs $100k-200k)
Net capital gain/loss in AGI: +$12,994 (reported on 13.6% of returns)
Here:
+$12,994
State:
+$10,406
(% of AGI for various income ranges: 15.8% for AGIs $100k-200k)
Profit/loss from business: +$4,485 (reported on 11.0% of returns)
Here:
+$4,485
State:
+$11,105
(% of AGI for various income ranges: 3.3% for AGIs below $25k, 1.3% for AGIs $25k-50k, 1.5% for AGIs $50k-75k, 0.6% for AGIs $100k-200k)
Taxable individual retirement arrangement distribution: $10,262 (reported on 13.6% of returns)
46940:
$10,262
Indiana:
$13,841
(% of AGI for various income ranges: 6.0% for AGIs below $25k, 3.0% for AGIs $25k-50k, 5.0% for AGIs $50k-75k, 3.1% for AGIs $100k-200k)
Total itemized deductions: $20,356 (16% of AGI, reported on 21.2% of returns)
Here:
$20,356
State:
$20,913
Here:
15.9% of AGI
State:
18.2% of AGI
(% of AGI for various income ranges: 9.0% for AGIs $25k-50k, 6.8% for AGIs $50k-75k, 7.7% for AGIs $75k-100k, 10.8% for AGIs $100k-200k, 7.9% for AGIs over 200k)
Charity contributions: $5,389 (reported on 15.3% of returns)
Here:
$5,389
State:
$4,697
(% of AGI for various income ranges: 1.0% for AGIs $25k-50k, 1.4% for AGIs $50k-75k, 1.3% for AGIs $75k-100k, 2.1% for AGIs $100k-200k, 2.1% for AGIs over 200k)
Taxes paid: $7,164 (reported on 21.2% of returns)
46940:
$7,164
State:
$7,456
(% of AGI for various income ranges: 1.6% for AGIs $25k-50k, 2.0% for AGIs $50k-75k, 2.9% for AGIs $75k-100k, 8.4% for AGIs $100k-200k)
Earned income credit: $2,018 (reported on 14.4% of returns)
Here:
$2,018
State:
$2,265
(% of AGI for various income ranges: 4.1% for AGIs below $25k, 1.1% for AGIs $25k-50k)
Percentage of individuals using paid preparers for their 2012 taxes: 61.0%
Here:
61%
State:
53%
(% for various income ranges: 53.3% for AGIs below $25k, 58.1% for AGIs $25k-50k, 73.7% for AGIs $50k-75k, 63.6% for AGIs $75k-100k, 70.0% for AGIs $100k-200k, 100.0% for AGIs over 200k)
Averages for the 2004 tax year for zip code 46940, filed in 2005:
Average Adjusted Gross Income (AGI) in 2004: $42,425 (Individual Income Tax Returns)
Here:
$42,425
State:
$44,790
Salary/wage: $39,164 (reported on 87.0% of returns)
Here:
$39,164
State:
$39,615
(% of AGI for various income ranges: 89.7% for AGIs below $10k, 64.6% for AGIs $10k-25k, 81.1% for AGIs $25k-50k, 84.1% for AGIs $50k-75k, 85.8% for AGIs $75k-100k, 77.0% for AGIs over 100k)
Taxable interest for individuals: $1,080 (reported on 51.0% of returns)
This zip code:
$1,080
Indiana:
$1,535
(% of AGI for various income ranges: 6.1% for AGIs below $10k, 2.6% for AGIs $10k-25k, 1.3% for AGIs $25k-50k, 1.3% for AGIs $50k-75k, 0.9% for AGIs $75k-100k, 0.6% for AGIs over 100k)
Taxable dividends: $1,022 (reported on 19.7% of returns)
Here:
$1,022
State:
$2,998
(% of AGI for various income ranges: 0.7% for AGIs below $10k, 1.1% for AGIs $10k-25k, 0.3% for AGIs $25k-50k, 0.5% for AGIs $50k-75k, 0.7% for AGIs $75k-100k, 0.2% for AGIs over 100k)
Net capital gain/loss: +$1,417 (reported on 13.2% of returns)
Here:
+$1,417
State:
+$8,619
(% of AGI for various income ranges: -0.5% for AGIs below $10k, 0.6% for AGIs $10k-25k, 0.7% for AGIs $25k-50k, 0.7% for AGIs $50k-75k, 0.1% for AGIs $75k-100k, 0.2% for AGIs over 100k)
Profit/loss from business: +$4,031 (reported on 10.9% of returns)
Here:
+$4,031
State:
+$10,071
(% of AGI for various income ranges: 2.4% for AGIs below $10k, 2.8% for AGIs $10k-25k, 1.9% for AGIs $25k-50k, 0.6% for AGIs $50k-75k, 0.7% for AGIs $75k-100k)
Profit/loss from farming: +$500 (reported on 5.4% of returns)
Here:
+$500
State:
-$2,212
(% of AGI for various income ranges: 1.4% for AGIs below $10k, -0.1% for AGIs $25k-50k, 0.2% for AGIs $50k-75k, -0.0% for AGIs $75k-100k)
IRA payment deduction: $2,562 (reported on 1.4% of returns)
46940:
$2,562
Indiana:
$2,840
Total itemized deductions: $13,983 (19% of AGI, reported on 25.4% of returns)
Here:
$13,983
State:
$17,065
Here:
18.7% of AGI
State:
19.5% of AGI
(% of AGI for various income ranges: 8.7% for AGIs $10k-25k, 6.8% for AGIs $25k-50k, 7.6% for AGIs $50k-75k, 10.6% for AGIs $75k-100k, 9.7% for AGIs over 100k)
Charity contributions deductions: $3,602 (4% of AGI, reported on 19.2% of returns)
Here:
$3,602
State:
$3,550
Here:
4.5% of AGI
State:
3.8% of AGI
(% of AGI for various income ranges: 1.1% for AGIs $10k-25k, 1.2% for AGIs $25k-50k, 1.6% for AGIs $50k-75k, 2.0% for AGIs $75k-100k, 2.1% for AGIs over 100k)
Total tax: $5,332 (reported on 77.4% of returns)
46940:
$5,332
State:
$6,914
(% of AGI for various income ranges: 2.1% for AGIs below $10k, 3.6% for AGIs $10k-25k, 6.5% for AGIs $25k-50k, 8.7% for AGIs $50k-75k, 10.6% for AGIs $75k-100k, 16.9% for AGIs over 100k)
Earned income credit: $1,517 (reported on 12.1% of returns)
Here:
$1,517
State:
$1,685
Percentage of individuals using paid preparers for their 2004 taxes: 65.1%
Here:
65%
State:
59%
(% for various income ranges: 54.7% for AGIs below $10k, 70.8% for AGIs $10k-25k, 65.9% for AGIs $25k-50k, 65.2% for AGIs $50k-75k, 64.4% for AGIs $75k-100k, 66.7% for AGIs over 100k)
Household received Food Stamps/SNAP in the past 12 months: 90 Household did not receive Food Stamps/SNAP in the past 12 months: 1,021
Women who had a birth in the past 12 months: 14 (8 now married, 6 unmarried) Women who did not have a birth in the past 12 months: 522 (255 now married, 267 unmarried)
Housing units in zip code 46940 with a mortgage: 502 (38 second mortgage, 2 home equity loan, 26 both second mortgage and home equity loan) Houses without a mortgage: 16
Median monthly owner costs for units with a mortgage: $904 Median monthly owner costs for units without a mortgage: $426
Residents with income below the poverty level in 2022:
This zip code:
15.3%
Whole state:
12.6%
Residents with income below 50% of the poverty level in 2022:
This zip code:
9.0%
Whole state:
6.3%
Median number of rooms in houses and condos:
Here:
6.4
State:
6.6
Median number of rooms in apartments:
Here:
5.5
State:
4.3
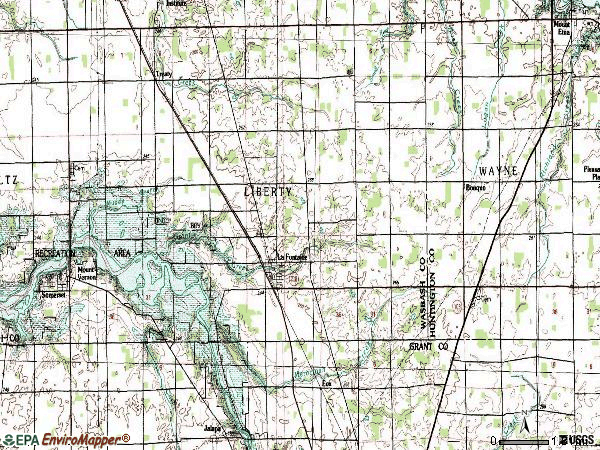
Notable locations in this zip code not listed on our city pages
Cemeteries: America Cemetery (1), Meshingomesia Cemetery (2), Harper Cemetery (3), Gardner Cemetery (4), Rennaker Cemetery (5), Waggoner Cemetery (6), Hale Cemetery (7). Display/hide their locations on the map
Creeks: Pee Dee Creek (A), Tenmile Creek (B), Grant Creek (C), Cart Creek (D), Metocinah Creek (E), Badger Creek (F). Display/hide their locations on the map
In group quarters: 113 (-1 institutionalized population)
Size of family households: 400 2-persons, 148 3-persons, 138 4-persons, 76 5-persons, 20 6-persons
Size of nonfamily households: 293 1-person, 34 2-persons
343 married couples with children.
266 single-parent households (164 men, 102 women).
98.6% of residents of 46940 zip code speak English at home.
0.2% of residents speak Spanish at home (100% very well).
0.5% of residents speak other Indo-European language at home (77% very well, 23% not well).
0.2% of residents speak Asian or Pacific Island language at home (67% very well, 33% well).
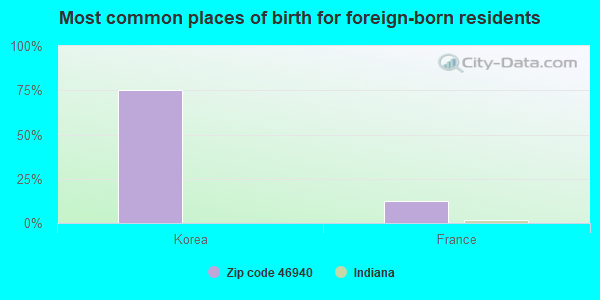
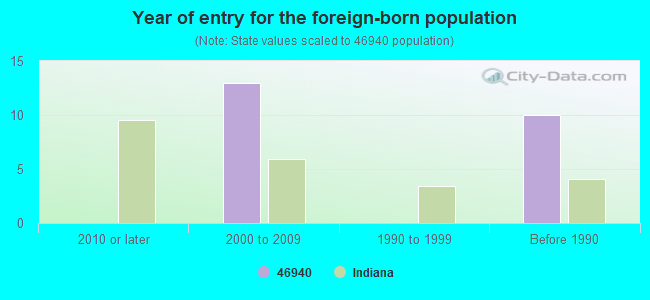
Foreign born population: 8 (0.3%) (25.9% of them are naturalized citizens)
This zip code:
0.3%
Whole state:
6.1%
75%Korea
12%France
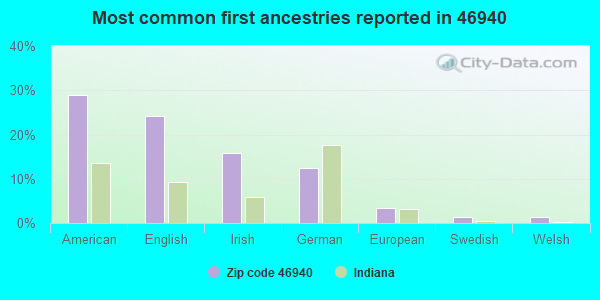
29%American
24%English
16%Irish
12%German
3%European
1%Swedish
1%Welsh
Year of entry for the foreign-born population
02010 or later
132000 to 2009
01990 to 1999
10Before 1990
Facilities with environmental interests located in this zip code:
SALAMONIE MOBILE HOME PARK (6060 SOUTH 800 EAST in LA FONTAINE, IN)
STATE MASTER (Indiana facility tracking) National Pollutant Discharge Elimination System NON-MAJOR (Tracking pollutant discharge elimination systems) - permit COMMUNITY WATER SYSTEM (SDWIS) Business SIC classification: OPERATORS OF RESIDENTIAL MOBILE HOME SITES Organizations: PETER M STEFANATOS 14963 72103 (CONTACT/OPERATOR)
Alternative names: SALAMONIE MOBILE HOME PK
NEW SCHOONEBECK, LLC (1858 EAST 800 SOUTH in LA FONTAINE, IN)
ENFORCEMENT/COMPLIANCE ACTIVITY (Integrated Compliance Information System) STATE MASTER (Indiana facility tracking)
Housing units lacking complete plumbing facilities: 0.1% Housing units lacking complete kitchen facilities: 2.3%
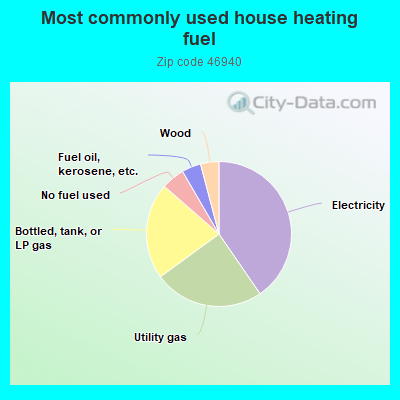
40.5%Electricity
24.6%Utility gas
21.5%Bottled, tank, or LP gas
5.2%No fuel used
4.3%Fuel oil, kerosene, etc.
4.1%Wood
Population in 1990: 2,947. Population change in the 1990s: +221 (+7.5%).
Place of birth for U.S.-born residents:
This state: 2,383
Northeast: 33
Midwest: 117
South: 210
West: 46
68% of the 46940 zip code residents lived in the same house 5 years ago. Out of people who lived in different houses, 47% lived in this county. Out of people who lived in different counties, 50% lived in Indiana.
91% of the 46940 zip code residents lived in the same house 1 year ago. Out of people who lived in different houses, 43% moved from this county. Out of people who lived in different houses, 57% moved from different county within same state.
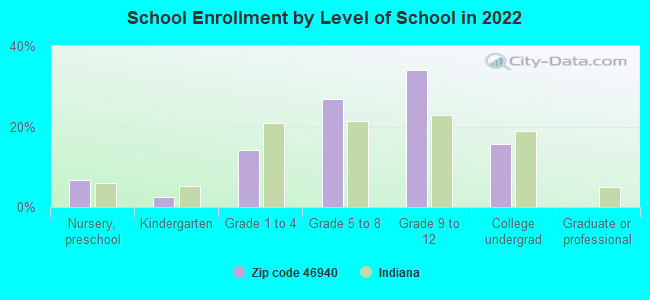
Private vs. public school enrollment:
Students in private schools in grades 1 to 8 (elementary and middle school):
Here:
0.0%
Indiana:
14.9%
Students in private schools in grades 9 to 12 (high school):
Here:
0.0%
Indiana:
11.4%
Students in private undergraduate colleges:
Here:
0.0%
Indiana:
22.3%
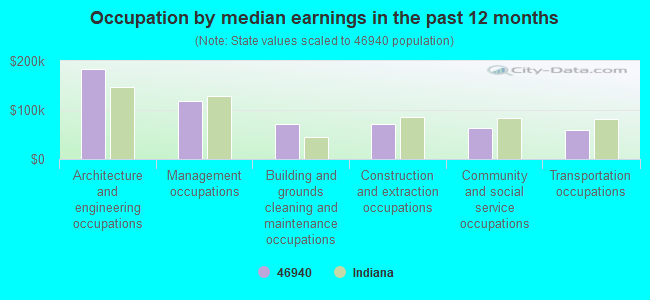
Occupation by median earnings in the past 12 months ($)
184,069Architecture and engineering occupations
117,771Management occupations
72,346Building and grounds cleaning and maintenance occupations
71,795Construction and extraction occupations
62,639Community and social service occupations
59,754Transportation occupations
Companies with federal contracts located in this zip code:
TEEJAY ENTERPRISES INC (11 W BRANSON ST in LA FONTAINE, IN; small business)
$30,000 with Bureau of the Census for ADP Software. Signed on 2000-08-15. Completion date: 2000-08-15.
Top industries in this zip code by the number of employees in 2005:
Health Care and Social Assistance: Nursing Care Facilities (100-249 employees: 1 establishment)
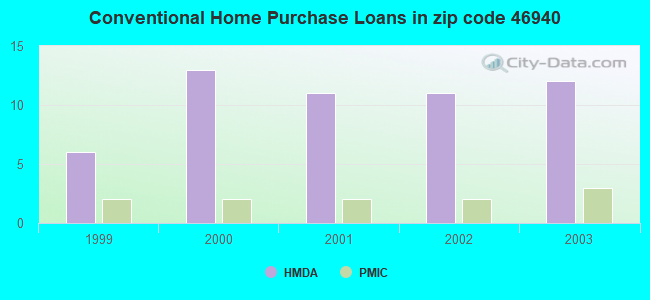
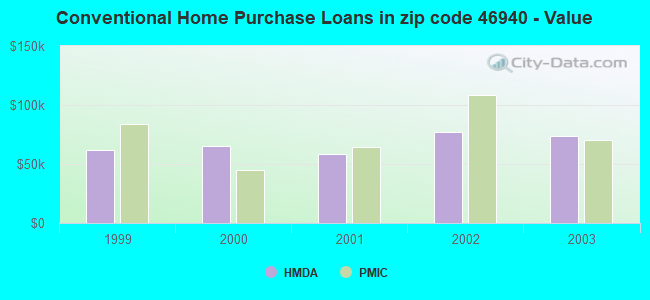
Detailed PMIC statistics for the following Tracts:9921.00
2002 - 2018 National Fire Incident Reporting System (NFIRS) incidents
According to the data from the years 2002 - 2018 the average number of fire incidents per year is 9. The highest number of fire incidents - 21 took place in 2002, and the least - 0 in 2014. The data has a dropping trend.
When looking into fire subcategories, the most reports belonged to: Structure Fires (46.5%), and Outside Fires (37.4%).
Fire incident types reported to NFIRS in Zip Code 46940


+$500
-$2,212
(% of AGI for various income ranges: 1.4% for AGIs below $10k, -0.1% for AGIs $25k-50k, 0.2% for AGIs $50k-75k, -0.0% for AGIs $75k-100k) Nearest zip codes: 46952, 46941, 46984, 46987, 46702, 46992.


 According to the data from the years 2002 - 2018 the average number of fire incidents per year is 9. The highest number of fire incidents - 21 took place in 2002, and the least - 0 in 2014. The data has a dropping trend.
 When looking into fire subcategories, the most reports belonged to: Structure Fires (46.5%), and Outside Fires (37.4%).