Estimated zip code population in 2022: 2,072 Zip code population in 2010: 2,304 Zip code population in 2000: 2,432
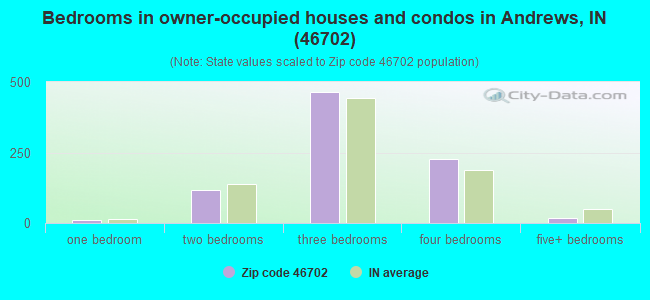
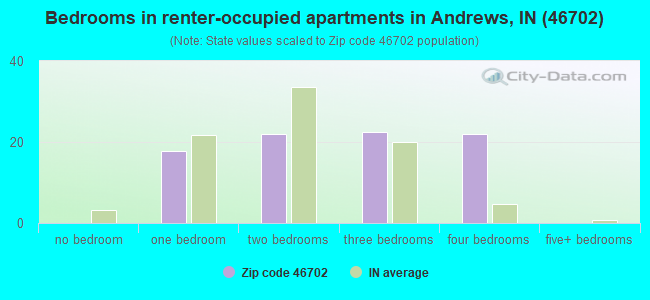
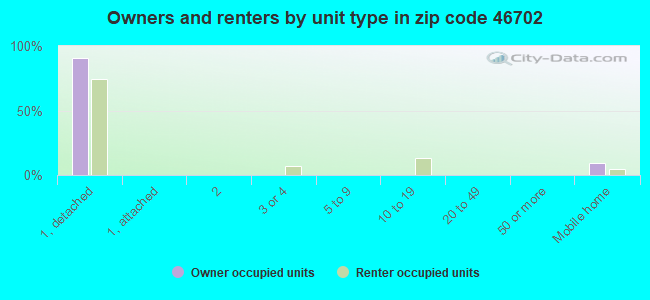
Houses and condos: 994 Renter-occupied apartments: 83
% of renters here:
9%
State:
29%
March 2022 cost of living index in zip code 46702: 85.1 (less than average, U.S. average is 100)
Land area: 45.5 sq. mi. Water area: 0.9 sq. mi.
Population density: 46 people per square mile
(very low).
OSM Map
General Map
Google Map
MSN Map
OSM Map
General Map
Google Map
MSN Map
OSM Map
General Map
Google Map
MSN Map
OSM Map
General Map
Google Map
MSN Map
Please wait while loading the map...
Real estate property taxes paid for housing units in 2022:
This zip code:
0.8% ($1,126)
Indiana:
0.7% ($1,467)
Median real estate property taxes paid for housing units with mortgages in 2022: $1,270 (0.7%) Median real estate property taxes paid for housing units with no mortgage in 2022: $921 (1.1%)
Business Search- 14 Million verified businesses
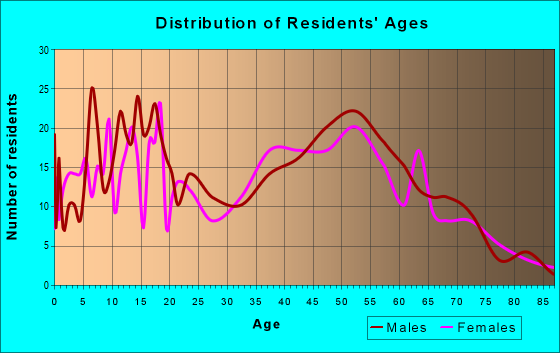
Males: 1,013
(48.9%)
Females: 1,059
(51.1%)
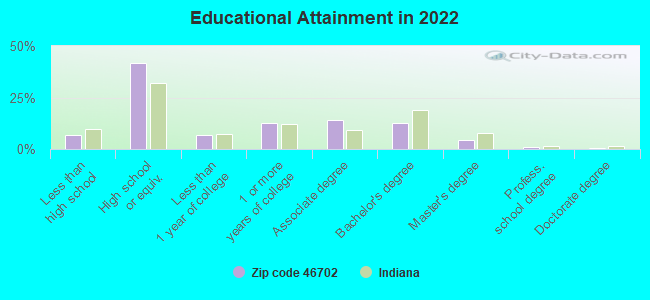
For population 25 years and over in 46702:
High school or higher: 92.5%
Bachelor's degree or higher: 18.4%
Graduate or professional degree: 6.0%
Unemployed: 0.4%
Mean travel time to work (commute): 25.1 minutes
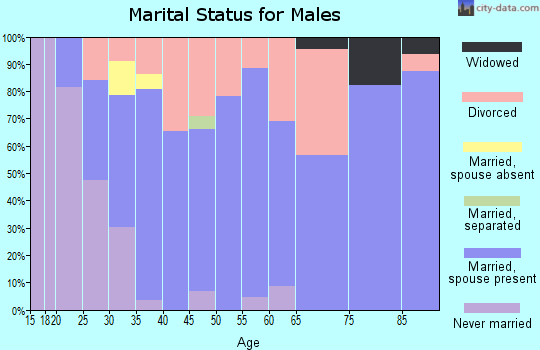
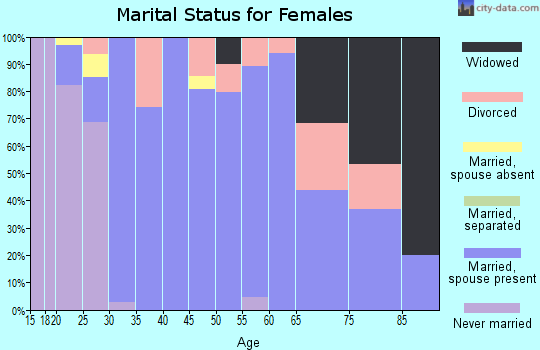
For population 15 years and over in 46702:
Never married: 23.6%
Now married: 60.0%
Separated: 0.2%
Widowed: 4.5%
Divorced: 11.8%
Zip code 46702 compared to state average:
Median house value below state average.
Unemployed percentage significantly below state average.
Black race population percentage significantly below state average.
Hispanic race population percentage below state average.
Median age above state average.
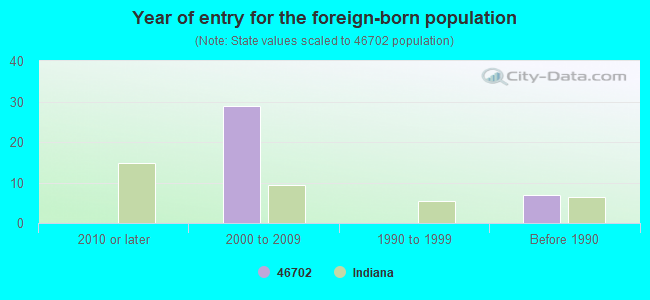
Foreign-born population percentage significantly below state average.
Renting percentage significantly below state average.
Length of stay since moving in significantly above state average.
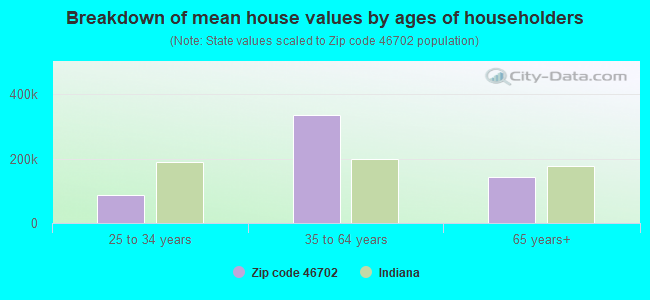
Estimated median house/condo value in 2022: $136,860
46702:
$136,860
Indiana:
$208,700
Median resident age:
This zip code:
45.2 years
Indiana median age:
38.2 years
Average household size:
This zip code:
2.3 people
Indiana:
2.4 people
Averages for the 2020 tax year for zip code 46702, filed in 2021:
Average Adjusted Gross Income (AGI) in 2020: $50,075 (Individual Income Tax Returns)
Here:
$50,075
State:
$64,978
Salary/wage: $45,924 (reported on 81.8% of returns)
Here:
$45,924
State:
$55,245
(% of AGI for various income ranges: 1012.5% for AGIs below $25k, 3543.9% for AGIs $25k-50k, 6060.7% for AGIs $50k-75k, 10152.9% for AGIs $75k-100k, 20211.4% for AGIs $100k-200k)
Taxable interest for individuals: $789 (reported on 25.5% of returns)
This zip code:
$789
Indiana:
$1,351
(% of AGI for various income ranges: 15.4% for AGIs below $25k, 19.6% for AGIs $25k-50k, 9.3% for AGIs $50k-75k, 15.7% for AGIs $75k-100k, 154.3% for AGIs $100k-200k)
Ordinary dividends: $1,900 (reported on 12.7% of returns)
Here:
$1,900
State:
$5,827
(% of AGI for various income ranges: 23.6% for AGIs below $25k, 15.7% for AGIs $25k-50k, 16.0% for AGIs $50k-75k, 200.0% for AGIs $100k-200k)
Net capital gain/loss in AGI: +$9,046 (reported on 11.8% of returns)
Here:
+$9,046
State:
+$17,730
(% of AGI for various income ranges: 20.0% for AGIs below $25k, 30.9% for AGIs $25k-50k, 46.0% for AGIs $50k-75k, 1400.0% for AGIs $100k-200k)
Profit/loss from business: +$5,208 (reported on 11.8% of returns)
Here:
+$5,208
State:
+$12,144
(% of AGI for various income ranges: 75.0% for AGIs below $25k, 39.6% for AGIs $25k-50k, 193.3% for AGIs $50k-75k, 122.9% for AGIs $100k-200k)
Taxable individual retirement arrangement distribution: $12,000 (reported on 10.0% of returns)
46702:
$12,000
Indiana:
$18,302
(% of AGI for various income ranges: 73.2% for AGIs below $25k, 90.4% for AGIs $25k-50k, 216.0% for AGIs $50k-75k, 832.9% for AGIs $100k-200k)
Total itemized deductions: $30,850 (reported on 1.8% of returns)
Here:
$30,850
State:
$35,601
(% of AGI for various income ranges: 881.4% for AGIs $75k-100k)
Taxes paid: $6,933 (reported on 2.7% of returns)
46702:
$6,933
State:
$7,542
(% of AGI for various income ranges: 297.1% for AGIs $75k-100k)
Earned income credit: $1,988 (reported on 14.5% of returns)
Here:
$1,988
State:
$2,298
(% of AGI for various income ranges: 67.1% for AGIs below $25k, 56.5% for AGIs $25k-50k)
Percentage of individuals using paid preparers for their 2020 taxes: 93.6%
Here:
94%
State:
94%
(% for various income ranges: 94.9% for AGIs below $25k, 92.9% for AGIs $25k-50k, 94.7% for AGIs $50k-75k, 90.0% for AGIs $75k-100k, 91.7% for AGIs $100k-200k, 100.0% for AGIs over 200k)
Averages for the 2012 tax year for zip code 46702, filed in 2013:
Average Adjusted Gross Income (AGI) in 2012: $40,521 (Individual Income Tax Returns)
Here:
$40,521
State:
$52,932
Salary/wage: $36,909 (reported on 86.5% of returns)
Here:
$36,909
State:
$45,173
(% of AGI for various income ranges: 76.5% for AGIs below $25k, 84.1% for AGIs $25k-50k, 80.4% for AGIs $50k-75k, 80.0% for AGIs $75k-100k, 71.6% for AGIs $100k-200k)
Taxable interest for individuals: $559 (reported on 30.8% of returns)
This zip code:
$559
Indiana:
$1,311
(% of AGI for various income ranges: 1.1% for AGIs below $25k, 0.6% for AGIs $25k-50k, 0.2% for AGIs $50k-75k, 0.3% for AGIs $75k-100k, 0.3% for AGIs $100k-200k)
Ordinary dividends: $1,408 (reported on 12.5% of returns)
Here:
$1,408
State:
$4,690
(% of AGI for various income ranges: 1.1% for AGIs below $25k, 0.1% for AGIs $25k-50k, 0.5% for AGIs $50k-75k, 0.8% for AGIs $75k-100k)
Profit/loss from business: +$3,283 (reported on 11.5% of returns)
Here:
+$3,283
State:
+$11,105
(% of AGI for various income ranges: 2.1% for AGIs below $25k, 1.4% for AGIs $25k-50k, 1.4% for AGIs $50k-75k)
Taxable individual retirement arrangement distribution: $9,800 (reported on 7.7% of returns)
46702:
$9,800
Indiana:
$13,841
(% of AGI for various income ranges: 2.7% for AGIs below $25k, 3.8% for AGIs $25k-50k, 3.6% for AGIs $75k-100k)
Total itemized deductions: $16,205 (21% of AGI, reported on 19.2% of returns)
Here:
$16,205
State:
$20,913
Here:
20.7% of AGI
State:
18.2% of AGI
(% of AGI for various income ranges: 7.2% for AGIs $25k-50k, 7.8% for AGIs $50k-75k, 8.9% for AGIs $75k-100k, 11.5% for AGIs $100k-200k)
Charity contributions: $3,433 (reported on 11.5% of returns)
Here:
$3,433
State:
$4,697
(% of AGI for various income ranges: 0.7% for AGIs below $25k, 0.9% for AGIs $50k-75k, 1.2% for AGIs $75k-100k, 2.0% for AGIs $100k-200k)
Taxes paid: $5,485 (reported on 19.2% of returns)
46702:
$5,485
State:
$7,456
(% of AGI for various income ranges: 1.4% for AGIs $25k-50k, 2.3% for AGIs $50k-75k, 3.3% for AGIs $75k-100k, 5.2% for AGIs $100k-200k)
Earned income credit: $2,155 (reported on 21.2% of returns)
Here:
$2,155
State:
$2,265
(% of AGI for various income ranges: 6.7% for AGIs below $25k, 1.3% for AGIs $25k-50k)
Percentage of individuals using paid preparers for their 2012 taxes: 63.5%
Here:
63%
State:
53%
(% for various income ranges: 60.9% for AGIs below $25k, 65.4% for AGIs $25k-50k, 64.7% for AGIs $50k-75k, 66.7% for AGIs $75k-100k, 66.7% for AGIs $100k-200k)
Averages for the 2004 tax year for zip code 46702, filed in 2005:
Average Adjusted Gross Income (AGI) in 2004: $36,768 (Individual Income Tax Returns)
Here:
$36,768
State:
$44,790
Salary/wage: $34,690 (reported on 89.5% of returns)
Here:
$34,690
State:
$39,615
(% of AGI for various income ranges: 83.5% for AGIs below $10k, 79.2% for AGIs $10k-25k, 87.3% for AGIs $25k-50k, 89.0% for AGIs $50k-75k, 87.4% for AGIs $75k-100k, 69.5% for AGIs over 100k)
Taxable interest for individuals: $698 (reported on 40.4% of returns)
This zip code:
$698
Indiana:
$1,535
(% of AGI for various income ranges: 2.4% for AGIs below $10k, 2.3% for AGIs $10k-25k, 0.9% for AGIs $25k-50k, 0.2% for AGIs $50k-75k, 0.5% for AGIs $75k-100k, 0.3% for AGIs over 100k)
Taxable dividends: $803 (reported on 16.8% of returns)
Here:
$803
State:
$2,998
(% of AGI for various income ranges: 1.0% for AGIs below $10k, 1.2% for AGIs $10k-25k, 0.1% for AGIs $25k-50k, 0.1% for AGIs $50k-75k, 0.3% for AGIs $75k-100k, 0.8% for AGIs over 100k)
Net capital gain/loss: +$1,425 (reported on 11.4% of returns)
Here:
+$1,425
State:
+$8,619
(% of AGI for various income ranges: 0.2% for AGIs $10k-25k, 0.6% for AGIs $25k-50k, 0.3% for AGIs $50k-75k, -0.2% for AGIs $75k-100k, 1.5% for AGIs over 100k)
Profit/loss from business: +$3,618 (reported on 10.4% of returns)
Here:
+$3,618
State:
+$10,071
(% of AGI for various income ranges: -6.5% for AGIs below $10k, 0.3% for AGIs $10k-25k, 1.5% for AGIs $25k-50k, 2.0% for AGIs $50k-75k, 0.9% for AGIs $75k-100k)
IRA payment deduction: $1,867 (reported on 1.4% of returns)
46702:
$1,867
Indiana:
$2,840
Total itemized deductions: $14,504 (22% of AGI, reported on 21.9% of returns)
Here:
$14,504
State:
$17,065
Here:
21.8% of AGI
State:
19.5% of AGI
(% of AGI for various income ranges: 5.5% for AGIs $10k-25k, 6.0% for AGIs $25k-50k, 9.3% for AGIs $50k-75k, 13.0% for AGIs $75k-100k, 12.4% for AGIs over 100k)
Charity contributions deductions: $3,017 (4% of AGI, reported on 16.7% of returns)
Here:
$3,017
State:
$3,550
Here:
4.2% of AGI
State:
3.8% of AGI
(% of AGI for various income ranges: 0.9% for AGIs $25k-50k, 0.9% for AGIs $50k-75k, 2.3% for AGIs $75k-100k, 3.8% for AGIs over 100k)
Total tax: $4,024 (reported on 73.4% of returns)
46702:
$4,024
State:
$6,914
(% of AGI for various income ranges: 1.9% for AGIs below $10k, 3.3% for AGIs $10k-25k, 6.0% for AGIs $25k-50k, 7.8% for AGIs $50k-75k, 10.4% for AGIs $75k-100k, 15.3% for AGIs over 100k)
Earned income credit: $1,671 (reported on 15.5% of returns)
Here:
$1,671
State:
$1,685
Percentage of individuals using paid preparers for their 2004 taxes: 62.5%
Here:
63%
State:
59%
(% for various income ranges: 46.4% for AGIs below $10k, 68.2% for AGIs $10k-25k, 63.2% for AGIs $25k-50k, 68.0% for AGIs $50k-75k, 70.3% for AGIs $75k-100k, 68.4% for AGIs over 100k)
Household received Food Stamps/SNAP in the past 12 months: 76 Household did not receive Food Stamps/SNAP in the past 12 months: 834
Women who had a birth in the past 12 months: 8 (5 now married, 2 unmarried) Women who did not have a birth in the past 12 months: 357 (168 now married, 188 unmarried)
Housing units in zip code 46702 with a mortgage: 536 (49 second mortgage, 16 home equity loan, 31 both second mortgage and home equity loan) Median monthly owner costs for units with a mortgage: $1,261 Median monthly owner costs for units without a mortgage: $479
Residents with income below the poverty level in 2022:
This zip code:
3.6%
Whole state:
12.6%
Residents with income below 50% of the poverty level in 2022:
This zip code:
1.6%
Whole state:
6.3%
Median number of rooms in houses and condos:
Here:
7.1
State:
6.6
Median number of rooms in apartments:
Here:
5.8
State:
4.3
Notable locations in this zip code not listed on our city pages
Notable locations in zip code 46702: Dallas Township Volunteer Fire Department (A), Andrews - Dallas Township Volunteer Fire Department (B). Display/hide their locations on the map
Parks in zip code 46702 include: Mount Hope State Recreation Area (1), Mount Etna State Recreation Area (2), Lost Bridge State Recreation Area (3). Display/hide their locations on the map
Size of family households: 402 2-persons, 134 3-persons, 47 4-persons, 47 5-persons, 21 6-persons, 29 7-or-more-persons
Size of nonfamily households: 211 1-person, 21 2-persons
240 married couples with children.
104 single-parent households (25 men, 79 women).
98.2% of residents of 46702 zip code speak English at home.
0.3% of residents speak Spanish at home (50% very well, 50% well).
0.6% of residents speak Asian or Pacific Island language at home (100% very well).
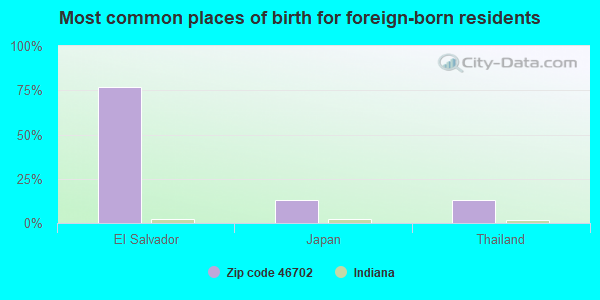
Foreign born population: 40 (2.0%) (100.0% of them are naturalized citizens)
This zip code:
2.0%
Whole state:
6.1%
77%El Salvador
13%Japan
13%Thailand
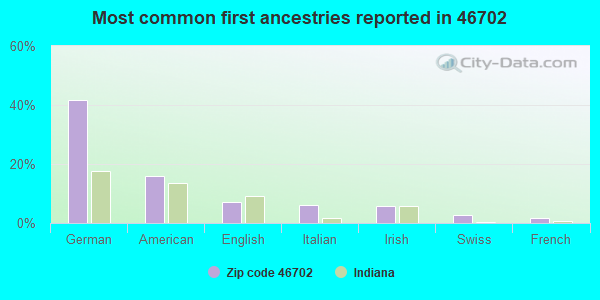
42%German
16%American
7%English
6%Italian
6%Irish
3%Swiss
2%French
Year of entry for the foreign-born population
02010 or later
292000 to 2009
01990 to 1999
7Before 1990
Facilities with environmental interests located in this zip code:
ANDREWS MUNICIPAL WWTP (800 N MAIN ST in ANDREWS, IN)
STATE MASTER (Indiana facility tracking) - CRTK-1390, EPCRA, UST-16413, UNDERGROUND STORAGE TANK PROGRAM, UST-20751, National Pollutant Discharge Elimination System NON-MAJOR (Tracking pollutant discharge elimination systems) - permit Business SIC classification: SEWERAGE SYSTEMS Organizations: SHADY ALLEN CERT OPER (CONTACT/OPERATOR)
, TOWN COUNCIL PRESIDENT (CONTACT/OWNER)
Alternative names: ANDREWS MUNICIPAL STP, ANDREWS TOWN OF
SALAMONIE RESERVOIR (9214 W LOST BRIDGE W in ANDREWS, IN)
STATE MASTER (Indiana facility tracking) - LUST-199209502, LEAKING STORAGE TANK, UST-16550, UNDERGROUND STORAGE TANK PROGRAM, CRTK-6566, EPCRA National Pollutant Discharge Elimination System NON-MAJOR (Tracking pollutant discharge elimination systems) - permit Business SIC classification: LAND, MINERAL, WILDLIFE, AND FOREST CONSERVATION Organizations: TIM H BAUMBAUER (CONTACT/OPERATOR)
, IDNR (CONTACT/OWNER)
Alternative names: LOST BRIDGE WEST S.R.A., LOST BRIDGE WEST ST. REC. AREA
ANDREWS ELEMENTARY SCHOOL (MCKEEVER ST in ANDREWS, IN)
(Geographic Names Information System) (National Center for Education Statistics) - STATE ID-3021 Organizations: HUNTINGTON CO COM SCH CORP (SCHOOL DISTRICT)
DANA CORPORATION (303 N. JACKSON ST. in ANDREWS, IN)
STATE MASTER (Indiana facility tracking) Conditionally Exempt Small Quantity Generators, less than 100 kg/month of hazardous waste (Resource Conservation and Recovery Act (tracking hazardous waste)) HAZARDOUS WASTE BIENNIAL REPORTER (Resource Conservation and Recovery Act (tracking hazardous waste)) TRI REPORTER (Tracking of toxic chemicals releasing facilities) Business SIC classification: MOTOR VEHICLE PARTS AND ACCESSORIES Organizations: DANA COUPLED PRODUCTS DIV (CONTACT/OPERATOR)
, PREFERRED TECHNICAL GROUP INC (CONTACT/OPERATOR)
, COUPLED PRODUCTS INC (CONTACT/OWNER)
Alternative names: PREFERRED TECHNICAL GROUP
PREFERRED TECHNICAL GROUP (303 NORTH JACKSON STREET in ANDREWS, IN)
COMPLIANCE ACTIVITY (Tracking inspections of insecticide, fungicide, and rodenticide, and toxic substances) Business SIC classification: MOTOR VEHICLE PARTS AND ACCESSORIES
Housing units lacking complete plumbing facilities: 2.3% Housing units lacking complete kitchen facilities: 4.4%
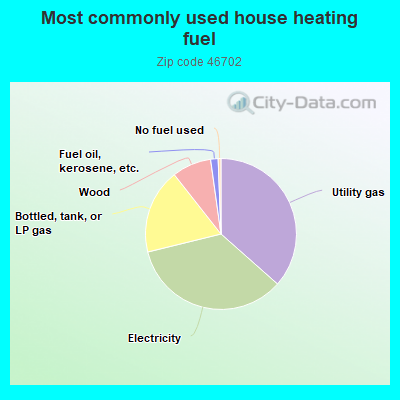
36.5%Utility gas
34.6%Electricity
18.2%Bottled, tank, or LP gas
8.4%Wood
1.6%Fuel oil, kerosene, etc.
0.6%No fuel used
Population in 1990: 2,138. Population change in the 1990s: +294 (+13.8%).
Place of birth for U.S.-born residents:
This state: 1,619
Northeast: 22
Midwest: 129
South: 210
West: 36
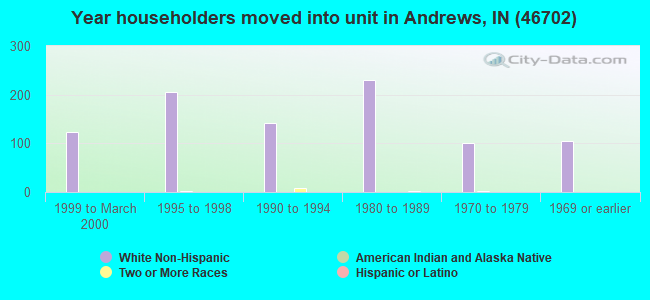
69% of the 46702 zip code residents lived in the same house 5 years ago. Out of people who lived in different houses, 62% lived in this county. Out of people who lived in different counties, 50% lived in Indiana.
94% of the 46702 zip code residents lived in the same house 1 year ago. Out of people who lived in different houses, 51% moved from this county. Out of people who lived in different houses, 46% moved from different county within same state. Out of people who lived in different houses, 8% moved from different state.
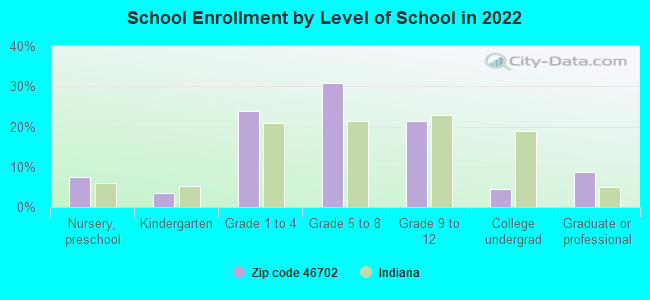
Private vs. public school enrollment:
Students in private schools in grades 1 to 8 (elementary and middle school):
Here:
0.0%
Indiana:
14.9%
Students in private schools in grades 9 to 12 (high school): 8
Here:
11.3%
Indiana:
11.4%
Students in private undergraduate colleges:
Here:
0.0%
Indiana:
22.3%
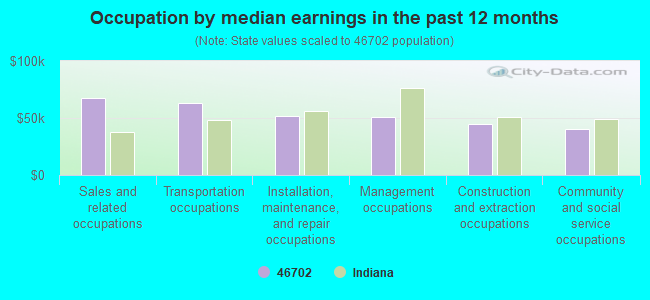
Occupation by median earnings in the past 12 months ($)
67,206Sales and related occupations
63,013Transportation occupations
51,567Installation, maintenance, and repair occupations
50,980Management occupations
44,970Construction and extraction occupations
40,566Community and social service occupations
Top industries in this zip code by the number of employees in 2005:
Other Services (except Public Administration): Labor Unions and Similar Labor Organizations (10-19 employees: 1 establishment)
Other Services (except Public Administration): Religious Organizations (10-19: 1)
Mining: Construction Sand and Gravel Mining (5-9: 1)
Construction: New Single-Family Housing Construction (except Operative Builders) (5-9: 1)
Accommodation and Food Services: Drinking Places (Alcoholic Beverages) (1-4: 2)
Construction: Site Preparation Contractors (1-4: 1)
Other Services (except Public Administration): Commercial and Industrial Machinery and Equipment (except Automotive and Electronic) Repair and Maintenance (1-4: 1)
Fatal accident statistics in 2014:
Fatal accident count: 1
Vehicles involved in fatal accidents: 1
Fatal accidents caused by drunken drivers: 0
Fatalities: 1
Persons involved in fatal accidents: 1
Pedestrians involved in fatal accidents: 0
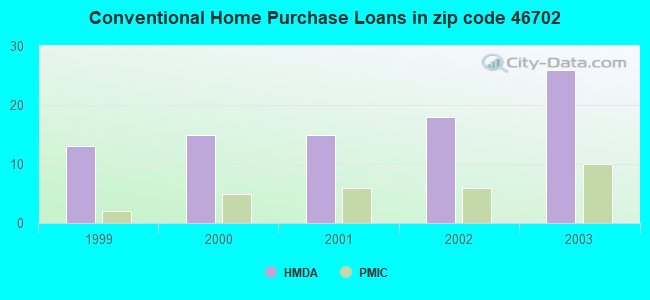
Home Mortgage Disclosure Act Aggregated Statistics For Year 2003 (Based on 2 partial tracts)
A) FHA, FSA/RHS & VA Home Purchase Loans
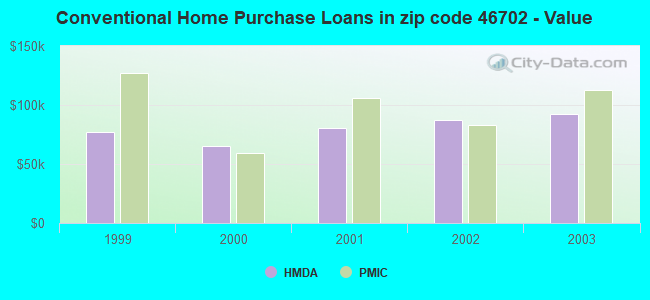
B) Conventional Home Purchase Loans
C) Refinancings
D) Home Improvement Loans
F) Non-occupant Loans on < 5 Family Dwellings (A B C & D)
Number
Average Value
Number
Average Value
Number
Average Value
Number
Average Value
Number
Average Value
LOANS ORIGINATED
3
$117,490
26
$92,779
109
$90,363
9
$22,790
4
$72,540
APPLICATIONS APPROVED, NOT ACCEPTED
0
$0
4
$80,728
11
$82,443
1
$30,470
0
$0
APPLICATIONS DENIED
1
$63,670
8
$47,242
30
$92,112
5
$21,740
0
$0
APPLICATIONS WITHDRAWN
0
$0
2
$266,740
12
$83,872
0
$0
0
$0
FILES CLOSED FOR INCOMPLETENESS
0
$0
1
$216,030
3
$94,750
0
$0
0
$0
Aggregated Statistics For Year 2002 (Based on 2 partial tracts)
A) FHA, FSA/RHS & VA Home Purchase Loans
B) Conventional Home Purchase Loans
C) Refinancings
D) Home Improvement Loans
F) Non-occupant Loans on < 5 Family Dwellings (A B C & D)
Number
Average Value
Number
Average Value
Number
Average Value
Number
Average Value
Number
Average Value
LOANS ORIGINATED
5
$90,506
18
$87,044
88
$88,986
5
$39,932
4
$32,405
APPLICATIONS APPROVED, NOT ACCEPTED
0
$0
3
$64,733
10
$77,134
1
$37,750
0
$0
APPLICATIONS DENIED
0
$0
5
$64,036
28
$77,657
2
$13,415
2
$38,660
APPLICATIONS WITHDRAWN
0
$0
4
$79,702
7
$85,893
0
$0
0
$0
FILES CLOSED FOR INCOMPLETENESS
0
$0
1
$74,130
6
$94,447
0
$0
0
$0
Aggregated Statistics For Year 2001 (Based on 2 partial tracts)
A) FHA, FSA/RHS & VA Home Purchase Loans
B) Conventional Home Purchase Loans
C) Refinancings
D) Home Improvement Loans
F) Non-occupant Loans on < 5 Family Dwellings (A B C & D)
Number
Average Value
Number
Average Value
Number
Average Value
Number
Average Value
Number
Average Value
LOANS ORIGINATED
6
$81,788
15
$80,621
78
$76,418
11
$11,411
4
$38,202
APPLICATIONS APPROVED, NOT ACCEPTED
0
$0
2
$64,810
10
$81,637
1
$15,010
0
$0
APPLICATIONS DENIED
0
$0
4
$58,328
36
$72,692
3
$5,913
0
$0
APPLICATIONS WITHDRAWN
0
$0
1
$53,670
14
$62,503
1
$22,740
1
$65,950
FILES CLOSED FOR INCOMPLETENESS
0
$0
0
$0
3
$83,530
0
$0
0
$0
Aggregated Statistics For Year 2000 (Based on 2 partial tracts)
A) FHA, FSA/RHS & VA Home Purchase Loans
B) Conventional Home Purchase Loans
C) Refinancings
D) Home Improvement Loans
F) Non-occupant Loans on < 5 Family Dwellings (A B C & D)
Number
Average Value
Number
Average Value
Number
Average Value
Number
Average Value
Number
Average Value
LOANS ORIGINATED
4
$69,358
15
$65,279
35
$60,956
12
$15,388
2
$50,940
APPLICATIONS APPROVED, NOT ACCEPTED
0
$0
2
$75,270
10
$57,214
6
$15,312
0
$0
APPLICATIONS DENIED
0
$0
7
$51,783
30
$54,803
8
$20,694
1
$16,830
APPLICATIONS WITHDRAWN
1
$70,040
2
$61,170
14
$48,209
0
$0
0
$0
FILES CLOSED FOR INCOMPLETENESS
0
$0
0
$0
3
$54,880
0
$0
0
$0
Aggregated Statistics For Year 1999 (Based on 1 partial tract)
A) FHA, FSA/RHS & VA Home Purchase Loans
B) Conventional Home Purchase Loans
C) Refinancings
D) Home Improvement Loans
F) Non-occupant Loans on < 5 Family Dwellings (A B C & D)
Detailed PMIC statistics for the following Tracts:9920.00
2002 - 2018 National Fire Incident Reporting System (NFIRS) incidents
Based on the data from the years 2002 - 2018 the average number of fire incidents per year is 17. The highest number of fires - 35 took place in 2012, and the least - 0 in 2015. The data has a declining trend.
When looking into fire subcategories, the most reports belonged to: Other (54.0%), and Structure Fires (31.7%).
Fire incident types reported to NFIRS in Zip Code 46702
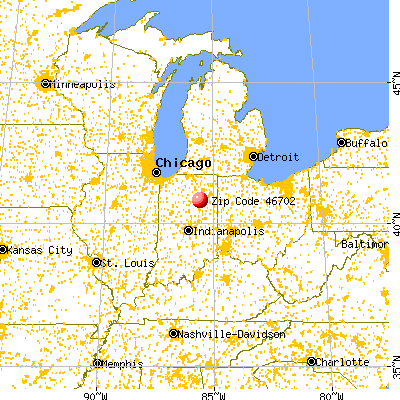


 Nearest zip codes: 46941, 46990, 46750, 46940, 46992, 46962.
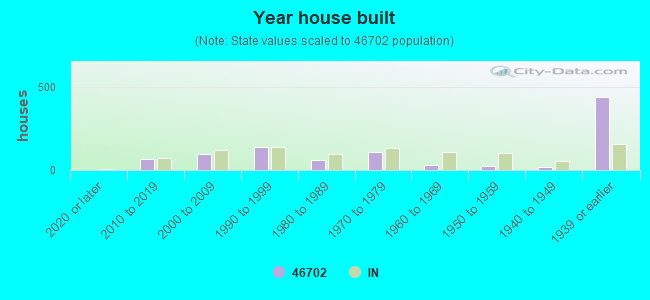


 Based on the data from the years 2002 - 2018 the average number of fire incidents per year is 17. The highest number of fires - 35 took place in 2012, and the least - 0 in 2015. The data has a declining trend.
 When looking into fire subcategories, the most reports belonged to: Other (54.0%), and Structure Fires (31.7%).