Estimated zip code population in 2022: 1,841 Zip code population in 2010: 2,295 Zip code population in 2000: 2,086
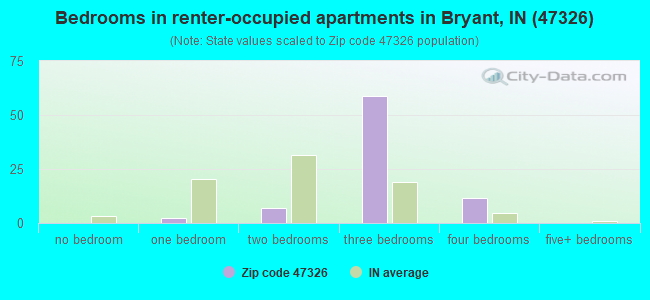
Houses and condos: 565 Renter-occupied apartments: 80
% of renters here:
14%
State:
29%
March 2022 cost of living index in zip code 47326: 85.9 (less than average, U.S. average is 100)
Land area: 66.9 sq. mi. Water area: 0.1 sq. mi.
Population density: 28 people per square mile
(very low).
OSM Map
General Map
Google Map
MSN Map
OSM Map
General Map
Google Map
MSN Map
OSM Map
General Map
Google Map
MSN Map
OSM Map
General Map
Google Map
MSN Map
Please wait while loading the map...
Real estate property taxes paid for housing units in 2022:
This zip code:
1.0% ($543)
Indiana:
0.7% ($1,467)
Median real estate property taxes paid for housing units with mortgages in 2022: $1,293 (0.6%) Median real estate property taxes paid for housing units with no mortgage in 2022: $451 (0.6%)
According to our research of Indiana and other state lists, there was 1 registered sex offender living in 47326 zip code as of May 07, 2024. The ratio of all residents to sex offenders in zip code 47326 is 2,361 to 1. The ratio of registered sex offenders to all residents in this zip code is much lower than the state average.
Median resident age:
This zip code:
29.9 years
Indiana median age:
38.2 years
Average household size:
This zip code:
3.3 people
Indiana:
2.4 people
Averages for the 2020 tax year for zip code 47326, filed in 2021:
Average Adjusted Gross Income (AGI) in 2020: $49,362 (Individual Income Tax Returns)
Here:
$49,362
State:
$64,978
Salary/wage: $42,813 (reported on 65.4% of returns)
Here:
$42,813
State:
$55,245
(% of AGI for various income ranges: 1305.0% for AGIs below $25k, 4464.2% for AGIs $25k-50k, 7825.0% for AGIs $50k-75k, 10090.0% for AGIs $75k-100k, 23456.7% for AGIs $100k-200k)
Taxable interest for individuals: $689 (reported on 23.5% of returns)
This zip code:
$689
Indiana:
$1,351
(% of AGI for various income ranges: 23.3% for AGIs below $25k, 15.8% for AGIs $25k-50k, 31.7% for AGIs $50k-75k, 65.0% for AGIs $75k-100k, 130.0% for AGIs $100k-200k)
Ordinary dividends: $1,030 (reported on 12.3% of returns)
Here:
$1,030
State:
$5,827
(% of AGI for various income ranges: 23.3% for AGIs $25k-50k, 45.0% for AGIs $50k-75k, 160.0% for AGIs $100k-200k)
Net capital gain/loss in AGI: +$9,527 (reported on 13.6% of returns)
Here:
+$9,527
State:
+$17,730
(% of AGI for various income ranges: 111.7% for AGIs $25k-50k, 436.7% for AGIs $50k-75k, 2173.3% for AGIs $100k-200k)
Profit/loss from business: +$29,592 (reported on 32.1% of returns)
Here:
+$29,592
State:
+$12,144
(% of AGI for various income ranges: 1314.2% for AGIs below $25k, 2420.8% for AGIs $25k-50k, 2110.0% for AGIs $50k-75k, 1730.0% for AGIs $75k-100k, 4180.0% for AGIs $100k-200k)
Taxable individual retirement arrangement distribution: $9,986 (reported on 8.6% of returns)
47326:
$9,986
Indiana:
$18,302
(% of AGI for various income ranges: 98.3% for AGIs below $25k, 147.5% for AGIs $25k-50k, 673.3% for AGIs $50k-75k)
Earned income credit: $2,190 (reported on 12.3% of returns)
Here:
$2,190
State:
$2,298
(% of AGI for various income ranges: 104.2% for AGIs below $25k, 78.3% for AGIs $25k-50k)
Percentage of individuals using paid preparers for their 2020 taxes: 93.8%
Here:
94%
State:
94%
(% for various income ranges: 93.1% for AGIs below $25k, 92.0% for AGIs $25k-50k, 100.0% for AGIs $50k-75k, 100.0% for AGIs $75k-100k, 88.9% for AGIs $100k-200k)
Averages for the 2012 tax year for zip code 47326, filed in 2013:
Average Adjusted Gross Income (AGI) in 2012: $39,792 (Individual Income Tax Returns)
Here:
$39,792
State:
$52,932
Salary/wage: $35,584 (reported on 69.6% of returns)
Here:
$35,584
State:
$45,173
(% of AGI for various income ranges: 53.9% for AGIs below $25k, 63.7% for AGIs $25k-50k, 77.7% for AGIs $50k-75k, 77.8% for AGIs $75k-100k, 41.2% for AGIs $100k-200k)
Taxable interest for individuals: $1,178 (reported on 29.1% of returns)
This zip code:
$1,178
Indiana:
$1,311
(% of AGI for various income ranges: 1.1% for AGIs below $25k, 0.9% for AGIs $25k-50k, 1.1% for AGIs $50k-75k, 1.0% for AGIs $100k-200k)
Ordinary dividends: $711 (reported on 11.4% of returns)
Here:
$711
State:
$4,690
(% of AGI for various income ranges: 0.1% for AGIs below $25k, 0.3% for AGIs $25k-50k, 0.8% for AGIs $75k-100k)
Net capital gain/loss in AGI: +$1,256 (reported on 11.4% of returns)
Here:
+$1,256
State:
+$10,406
(% of AGI for various income ranges: 1.2% for AGIs $25k-50k, 0.9% for AGIs $75k-100k)
Profit/loss from business: +$17,870 (reported on 25.3% of returns)
Here:
+$17,870
State:
+$11,105
(% of AGI for various income ranges: 31.1% for AGIs below $25k, 17.5% for AGIs $25k-50k, 11.2% for AGIs $50k-75k)
Taxable individual retirement arrangement distribution: $8,186 (reported on 8.9% of returns)
47326:
$8,186
Indiana:
$13,841
(% of AGI for various income ranges: 3.6% for AGIs below $25k, 1.7% for AGIs $25k-50k, 3.7% for AGIs $50k-75k)
Total itemized deductions: $18,240 (20% of AGI, reported on 12.7% of returns)
Here:
$18,240
State:
$20,913
Here:
19.6% of AGI
State:
18.2% of AGI
(% of AGI for various income ranges: 6.7% for AGIs $25k-50k, 8.8% for AGIs $50k-75k, 8.8% for AGIs $100k-200k)
Charity contributions: $3,114 (reported on 8.9% of returns)
Here:
$3,114
State:
$4,697
Taxes paid: $6,110 (reported on 12.7% of returns)
47326:
$6,110
State:
$7,456
(% of AGI for various income ranges: 1.0% for AGIs $25k-50k, 2.7% for AGIs $50k-75k, 4.5% for AGIs $100k-200k)
Earned income credit: $2,300 (reported on 15.2% of returns)
Here:
$2,300
State:
$2,265
(% of AGI for various income ranges: 4.2% for AGIs below $25k, 1.1% for AGIs $25k-50k)
Percentage of individuals using paid preparers for their 2012 taxes: 75.9%
Here:
76%
State:
53%
(% for various income ranges: 75.0% for AGIs below $25k, 76.2% for AGIs $25k-50k, 75.0% for AGIs $50k-75k, 80.0% for AGIs $75k-100k, 80.0% for AGIs $100k-200k)
Averages for the 2004 tax year for zip code 47326, filed in 2005:
Average Adjusted Gross Income (AGI) in 2004: $31,069 (Individual Income Tax Returns)
Here:
$31,069
State:
$44,790
Salary/wage: $32,458 (reported on 74.6% of returns)
Here:
$32,458
State:
$39,615
(% of AGI for various income ranges: 145.8% for AGIs below $10k, 54.6% for AGIs $10k-25k, 80.2% for AGIs $25k-50k, 89.3% for AGIs $50k-75k, 75.1% for AGIs $75k-100k, 67.1% for AGIs over 100k)
Taxable interest for individuals: $1,169 (reported on 42.1% of returns)
This zip code:
$1,169
Indiana:
$1,535
(% of AGI for various income ranges: 7.1% for AGIs below $10k, 3.6% for AGIs $10k-25k, 1.1% for AGIs $25k-50k, 0.9% for AGIs $50k-75k, 2.0% for AGIs $75k-100k, 0.7% for AGIs over 100k)
Taxable dividends: $520 (reported on 12.7% of returns)
Here:
$520
State:
$2,998
(% of AGI for various income ranges: 0.6% for AGIs $10k-25k, 0.2% for AGIs $25k-50k, 0.1% for AGIs $50k-75k, 0.2% for AGIs $75k-100k)
Net capital gain/loss: +$2,488 (reported on 10.0% of returns)
Here:
+$2,488
State:
+$8,619
Profit/loss from business: +$13,441 (reported on 23.4% of returns)
Here:
+$13,441
State:
+$10,071
(% of AGI for various income ranges: 53.2% for AGIs below $10k, 31.1% for AGIs $10k-25k, 8.7% for AGIs $25k-50k, 4.5% for AGIs $50k-75k)
IRA payment deduction: $3,438 (reported on 2.0% of returns)
47326:
$3,438
Indiana:
$2,840
Total itemized deductions: $13,700 (20% of AGI, reported on 10.0% of returns)
Here:
$13,700
State:
$17,065
Here:
19.8% of AGI
State:
19.5% of AGI
(% of AGI for various income ranges: 2.8% for AGIs $10k-25k, 3.7% for AGIs $25k-50k, 5.0% for AGIs $50k-75k, 10.3% for AGIs over 100k)
Charity contributions deductions: $3,192 (4% of AGI, reported on 6.5% of returns)
Here:
$3,192
State:
$3,550
Here:
3.9% of AGI
State:
3.8% of AGI
Total tax: $3,291 (reported on 66.1% of returns)
47326:
$3,291
State:
$6,914
(% of AGI for various income ranges: 4.0% for AGIs below $10k, 4.0% for AGIs $10k-25k, 5.9% for AGIs $25k-50k, 7.5% for AGIs $50k-75k, 10.6% for AGIs $75k-100k, 10.5% for AGIs over 100k)
Earned income credit: $1,586 (reported on 12.3% of returns)
Here:
$1,586
State:
$1,685
Percentage of individuals using paid preparers for their 2004 taxes: 70.3%
Here:
70%
State:
59%
(% for various income ranges: 60.4% for AGIs below $10k, 77.3% for AGIs $10k-25k, 68.5% for AGIs $25k-50k, 71.8% for AGIs $50k-75k, 84.0% for AGIs $75k-100k, 70.0% for AGIs over 100k)
Household received Food Stamps/SNAP in the past 12 months: 17 Household did not receive Food Stamps/SNAP in the past 12 months: 538
Women who had a birth in the past 12 months: 32 (26 now married, 7 unmarried) Women who did not have a birth in the past 12 months: 320 (194 now married, 127 unmarried)
Housing units in zip code 47326 with a mortgage: 193 (30 second mortgage, 6 both second mortgage and home equity loan) Median monthly owner costs for units with a mortgage: $1,223 Median monthly owner costs for units without a mortgage: $338
Residents with income below the poverty level in 2022:
This zip code:
11.4%
Whole state:
12.6%
Residents with income below 50% of the poverty level in 2022:
This zip code:
9.9%
Whole state:
6.3%
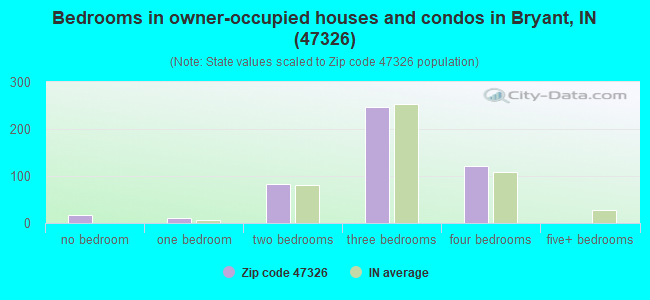
Median number of rooms in houses and condos:
Here:
6.2
State:
6.6
Median number of rooms in apartments:
Here:
7.5
State:
4.3
Notable locations in this zip code not listed on our city pages
Churches in zip code 47326 include: Limberlost Church (A), Oakland Church (B), Pleasant Grove Church (C), River Side Mission (D), Saint Marys Church (E), Sardinia Church (F), Union Chapel (G), White Oak Church (H). Display/hide their locations on the map
Cemeteries: West Grove Cemetery (1), Borris Cemetery (2), Gravel Hill Cemetery (3), Pingrey Cemetery (4), Daugherty Cemetery (5), Old Baptist Cemetery (6). Display/hide their locations on the map
In group quarters: 1 (-1 institutionalized population)
Size of family households: 212 2-persons, 57 3-persons, 26 4-persons, 62 5-persons, 53 6-persons, 43 7-or-more-persons
Size of nonfamily households: 80 1-person, 23 2-persons
570 married couples with children.
14 single-parent households (14 women).
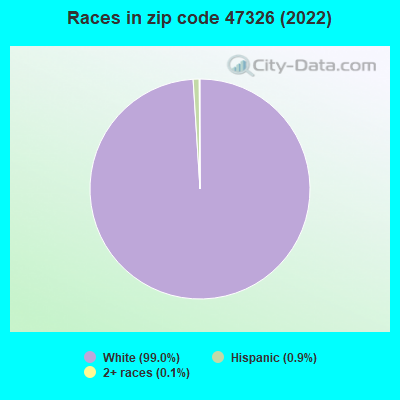
77.1% of residents of 47326 zip code speak English at home.
0.8% of residents speak Spanish at home (100% very well).
26.0% of residents speak other Indo-European language at home (76% very well, 17% well, 8% not well).
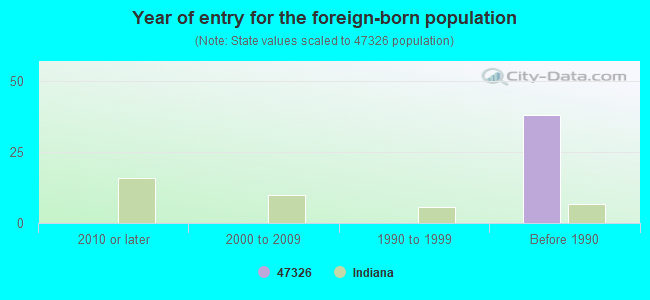
Foreign born population: 0 (0.0%)
:
0.0%
Whole state:
6.1%
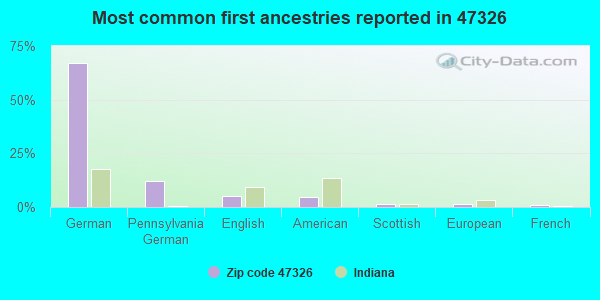
67%German
12%Pennsylvania German
5%English
5%American
1%Scottish
1%European
1%French
Year of entry for the foreign-born population
02010 or later
02000 to 2009
01990 to 1999
38Before 1990
Facilities with environmental interests located in this zip code:
BLOOMFIELD ELEMENTARY (350 E 500 N in BRYANT, IN)
(Geographic Names Information System) STATE MASTER (Indiana facility tracking) (National Center for Education Statistics) - STATE ID-3241 Organizations: JAY SCHOOL CORP (SCHOOL DISTRICT)
LIMBERLOST AGRICULTURE CENTER (980 E SR 67 in BRYANT, IN)
STATE MASTER (Indiana facility tracking) - CRTK-1575, EPCRA, SPILL-198905066, RELEASE ASSESSMENT COMPLIANCE ACTIVITY (Tracking inspections of insecticide, fungicide, and rodenticide, and toxic substances) Alternative names: LIMBER LOST AG CTR
BEARCREEK FARMS, INC. (8341 NORTH 400 EAST in BRYANT, IN)
STATE MASTER (Indiana facility tracking) National Pollutant Discharge Elimination System NON-MAJOR (Tracking pollutant discharge elimination systems) - permit Business SIC classification: LAND SUBDIVIDERS AND DEVELOPERS, EXCEPT CEMETERIES Organizations: ROBT J GREEN 12332 010199 (CONTACT/OPERATOR)
, MR DONALD C STRONG (CONTACT/OWNER)
Alternative names: BEAR CREEK FARMS, INC.
BRYANT MUNICIPAL STP (CR 40 S & CR 175 E in BRYANT, IN)
STATE MASTER (Indiana facility tracking) National Pollutant Discharge Elimination System NON-MAJOR (Tracking pollutant discharge elimination systems) - permit Business SIC classification: SEWERAGE SYSTEMS Organizations: GR KIRBY EM 7657285642 (CONTACT/OPERATOR)
, BRYANT TOWN COUNCIL (CONTACT/OWNER)
Alternative names: BRYANT MUNICIPAL WWTP
PINEGROVE SCHOOL (RR 1 BOX 14 in BRYANT, IN)
STATE MASTER (Indiana facility tracking) COMPLIANCE ACTIVITY (Tracking inspections of insecticide, fungicide, and rodenticide, and toxic substances)
Housing units lacking complete plumbing facilities: 10.3% Housing units lacking complete kitchen facilities: 11.4%
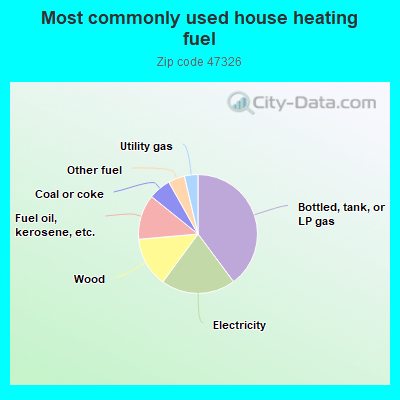
40.1%Bottled, tank, or LP gas
20.4%Electricity
13.6%Wood
12.3%Fuel oil, kerosene, etc.
6.1%Coal or coke
4.5%Other fuel
3.7%Utility gas
Population in 1990: 1,350. Population change in the 1990s: +736 (+54.5%).
Place of birth for U.S.-born residents:
This state: 1,487
Midwest: 219
South: 78
West: 2
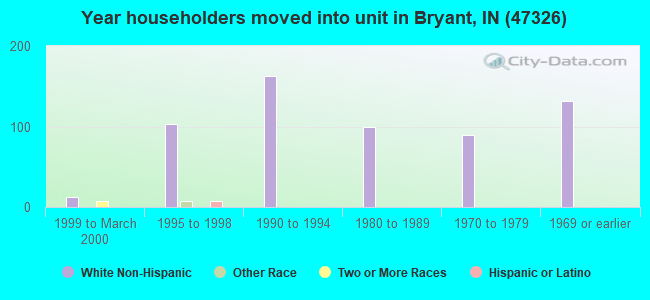
81% of the 47326 zip code residents lived in the same house 5 years ago. Out of people who lived in different houses, 58% lived in this county. Out of people who lived in different counties, 50% lived in Indiana.
97% of the 47326 zip code residents lived in the same house 1 year ago. Out of people who lived in different houses, 37% moved from this county. Out of people who lived in different houses, 77% moved from different county within same state.
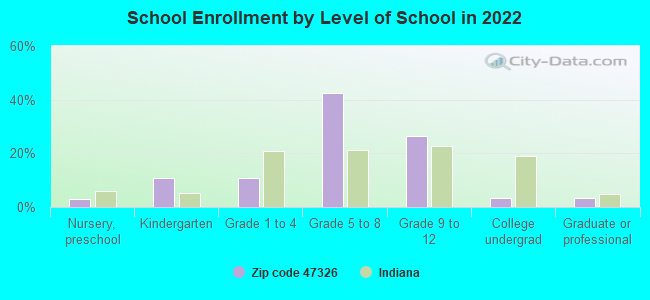
Private vs. public school enrollment:
Students in private schools in grades 1 to 8 (elementary and middle school): 30
Here:
11.9%
Indiana:
14.9%
Students in private schools in grades 9 to 12 (high school):
Here:
0.0%
Indiana:
11.4%
Students in private undergraduate colleges:
Here:
0.0%
Indiana:
22.3%
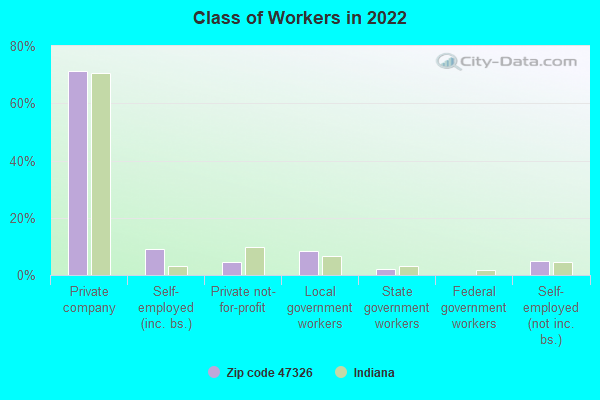
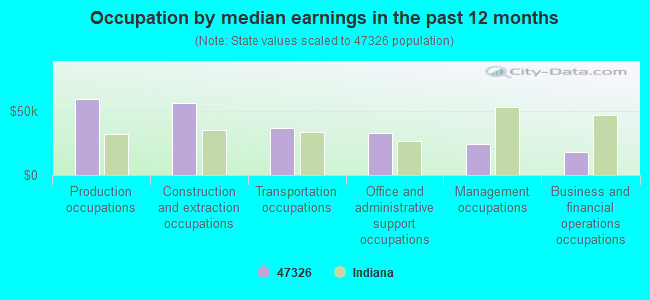
Occupation by median earnings in the past 12 months ($)
59,567Production occupations
56,570Construction and extraction occupations
36,924Transportation occupations
32,937Office and administrative support occupations
24,661Management occupations
17,943Business and financial operations occupations
Top industries in this zip code by the number of employees in 2005:
Management of Companies and Enterprises: Corporate, Subsidiary, and Regional Managing Offices (10-19: 1)
Other Services (except Public Administration): Commercial and Industrial Machinery and Equipment (except Automotive and Electronic) Repair and Maintenance (10-19: 1)
Arts, Entertainment, and Recreation: Theater Companies and Dinner Theaters (10-19: 1)
Construction: New Single-Family Housing Construction (except Operative Builders) (5-9: 1)
Accommodation and Food Services: Hotels (except Casino Hotels) and Motels (5-9: 1)
Fatal accident statistics in 2013:
Fatal accident count: 2
Vehicles involved in fatal accidents: 3
Fatal accidents caused by drunken drivers: 1
Fatalities: 2
Persons involved in fatal accidents: 4
Pedestrians involved in fatal accidents: 0
2002 - 2018 National Fire Incident Reporting System (NFIRS) incidents
Based on the data from the years 2002 - 2018 the average number of fires per year is 15. The highest number of fire incidents - 41 took place in 2010, and the least - 0 in 2014. The data has a growing trend.
When looking into fire subcategories, the most reports belonged to: Structure Fires (45.2%), and Outside Fires (36.4%).
Fire incident types reported to NFIRS in Zip Code 47326

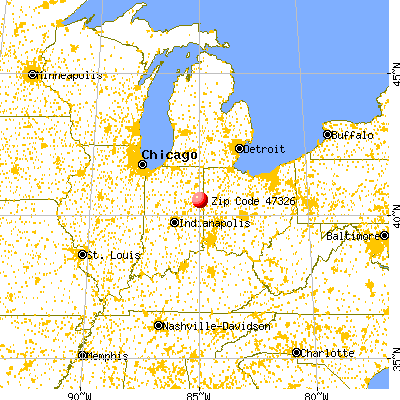


 Nearest zip codes: 46740, 46711, 47371, 47369, 46772, 47381.
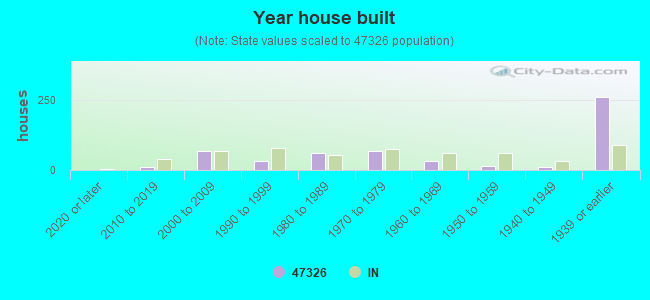


 Based on the data from the years 2002 - 2018 the average number of fires per year is 15. The highest number of fire incidents - 41 took place in 2010, and the least - 0 in 2014. The data has a growing trend.
 When looking into fire subcategories, the most reports belonged to: Structure Fires (45.2%), and Outside Fires (36.4%).