Estimated zip code population in 2022: 21,888 Zip code population in 2010: 24,776 Zip code population in 2000: 24,813
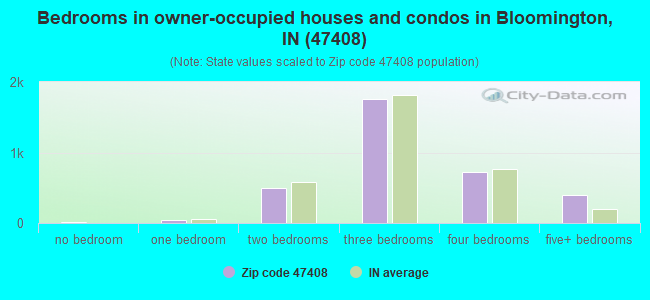
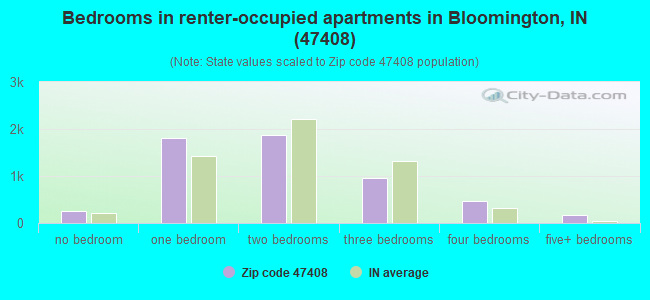
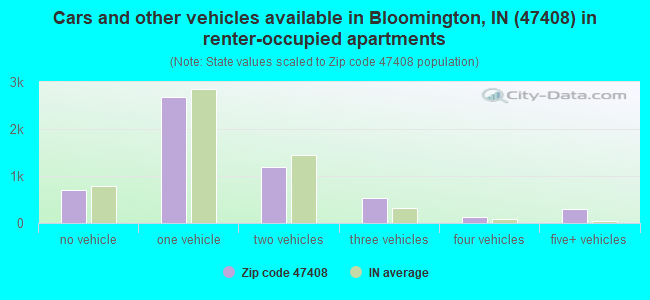
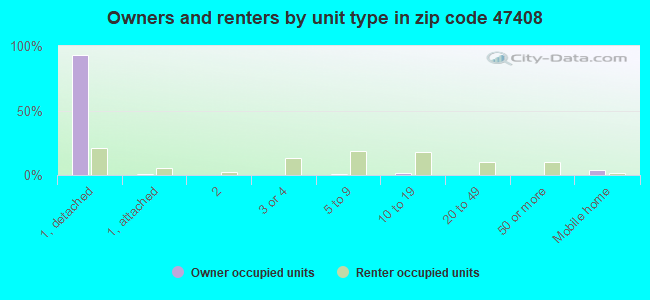
Houses and condos: 10,733 Renter-occupied apartments: 5,544
% of renters here:
62%
State:
29%
March 2022 cost of living index in zip code 47408: 89.9 (less than average, U.S. average is 100)
Land area: 66.4 sq. mi. Water area: 0.2 sq. mi.
Population density: 330 people per square mile
(very low).
OSM Map
General Map
Google Map
MSN Map
OSM Map
General Map
Google Map
MSN Map
OSM Map
General Map
Google Map
MSN Map
OSM Map
General Map
Google Map
MSN Map
Please wait while loading the map...
Real estate property taxes paid for housing units in 2022:
This zip code:
0.7% ($2,116)
Indiana:
0.7% ($1,467)
Median real estate property taxes paid for housing units with mortgages in 2022: $2,314 (0.7%) Median real estate property taxes paid for housing units with no mortgage in 2022: $1,855 (0.7%)
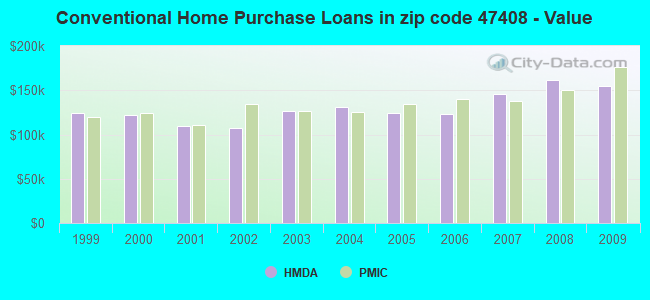
Estimated median house/condo value in 2022: $309,072
47408:
$309,072
Indiana:
$208,700
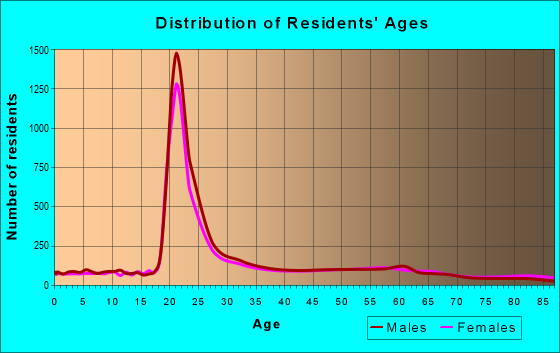
Median resident age:
This zip code:
24.6 years
Indiana median age:
38.2 years
Average household size:
This zip code:
2.1 people
Indiana:
2.4 people
Averages for the 2020 tax year for zip code 47408, filed in 2021:
Average Adjusted Gross Income (AGI) in 2020: $69,677 (Individual Income Tax Returns)
Here:
$69,677
State:
$64,978
Salary/wage: $53,291 (reported on 80.3% of returns)
Here:
$53,291
State:
$55,245
(% of AGI for various income ranges: 1164.7% for AGIs below $25k, 3562.0% for AGIs $25k-50k, 5927.8% for AGIs $50k-75k, 8782.0% for AGIs $75k-100k, 15982.4% for AGIs $100k-200k, 74416.7% for AGIs over 200k)
Taxable interest for individuals: $1,965 (reported on 33.8% of returns)
This zip code:
$1,965
Indiana:
$1,351
(% of AGI for various income ranges: 12.5% for AGIs below $25k, 26.4% for AGIs $25k-50k, 50.6% for AGIs $50k-75k, 97.0% for AGIs $75k-100k, 252.2% for AGIs $100k-200k, 1911.7% for AGIs over 200k)
Ordinary dividends: $9,120 (reported on 25.1% of returns)
Here:
$9,120
State:
$5,827
(% of AGI for various income ranges: 19.6% for AGIs below $25k, 53.0% for AGIs $25k-50k, 196.4% for AGIs $50k-75k, 271.0% for AGIs $75k-100k, 805.7% for AGIs $100k-200k, 7857.5% for AGIs over 200k)
Net capital gain/loss in AGI: +$15,503 (reported on 23.1% of returns)
Here:
+$15,503
State:
+$17,730
(% of AGI for various income ranges: 48.9% for AGIs below $25k, 43.9% for AGIs $25k-50k, 156.7% for AGIs $50k-75k, 369.0% for AGIs $75k-100k, 922.6% for AGIs $100k-200k, 15033.3% for AGIs over 200k)
Profit/loss from business: +$11,112 (reported on 16.0% of returns)
Here:
+$11,112
State:
+$12,144
(% of AGI for various income ranges: 81.1% for AGIs below $25k, 78.9% for AGIs $25k-50k, 233.0% for AGIs $50k-75k, 316.8% for AGIs $75k-100k, 594.1% for AGIs $100k-200k, 3770.0% for AGIs over 200k)
Taxable individual retirement arrangement distribution: $26,003 (reported on 12.1% of returns)
47408:
$26,003
Indiana:
$18,302
(% of AGI for various income ranges: 37.9% for AGIs below $25k, 123.0% for AGIs $25k-50k, 383.6% for AGIs $50k-75k, 583.5% for AGIs $75k-100k, 1633.3% for AGIs $100k-200k, 6175.8% for AGIs over 200k)
Self-employed (Keogh) retirement plans: $26,300 (reported on 0.4% of returns)
47408:
$26,300
Indiana:
$27,160
(% of AGI for various income ranges: 657.5% for AGIs over 200k)
Total itemized deductions: $43,167 (reported on 6.8% of returns)
Here:
$43,167
State:
$35,601
(% of AGI for various income ranges: 30.4% for AGIs below $25k, 60.7% for AGIs $25k-50k, 372.7% for AGIs $50k-75k, 422.2% for AGIs $75k-100k, 981.9% for AGIs $100k-200k, 9304.2% for AGIs over 200k)
Charity contributions: $23,200 (reported on 5.5% of returns)
Here:
$23,200
State:
$15,596
(% of AGI for various income ranges: 11.2% for AGIs $25k-50k, 62.5% for AGIs $50k-75k, 142.8% for AGIs $75k-100k, 327.4% for AGIs $100k-200k, 5605.0% for AGIs over 200k)
Taxes paid: $7,429 (reported on 6.8% of returns)
47408:
$7,429
State:
$7,542
(% of AGI for various income ranges: 2.2% for AGIs below $25k, 8.6% for AGIs $25k-50k, 49.1% for AGIs $50k-75k, 78.8% for AGIs $75k-100k, 239.5% for AGIs $100k-200k, 1400.8% for AGIs over 200k)
Earned income credit: $1,524 (reported on 10.8% of returns)
Here:
$1,524
State:
$2,298
(% of AGI for various income ranges: 35.0% for AGIs below $25k, 33.9% for AGIs $25k-50k)
Percentage of individuals using paid preparers for their 2020 taxes: 92.7%
Here:
93%
State:
94%
(% for various income ranges: 92.5% for AGIs below $25k, 93.9% for AGIs $25k-50k, 92.2% for AGIs $50k-75k, 93.4% for AGIs $75k-100k, 91.6% for AGIs $100k-200k, 92.7% for AGIs over 200k)
Averages for the 2012 tax year for zip code 47408, filed in 2013:
Average Adjusted Gross Income (AGI) in 2012: $56,601 (Individual Income Tax Returns)
Here:
$56,601
State:
$52,932
Salary/wage: $42,282 (reported on 82.2% of returns)
Here:
$42,282
State:
$45,173
(% of AGI for various income ranges: 83.2% for AGIs below $25k, 77.4% for AGIs $25k-50k, 67.5% for AGIs $50k-75k, 65.1% for AGIs $75k-100k, 62.9% for AGIs $100k-200k, 42.9% for AGIs over 200k)
Taxable interest for individuals: $2,335 (reported on 33.9% of returns)
This zip code:
$2,335
Indiana:
$1,311
(% of AGI for various income ranges: 1.1% for AGIs below $25k, 0.8% for AGIs $25k-50k, 1.2% for AGIs $50k-75k, 1.1% for AGIs $75k-100k, 1.2% for AGIs $100k-200k, 2.1% for AGIs over 200k)
Ordinary dividends: $8,100 (reported on 24.8% of returns)
Here:
$8,100
State:
$4,690
(% of AGI for various income ranges: 2.1% for AGIs below $25k, 1.8% for AGIs $25k-50k, 2.8% for AGIs $50k-75k, 2.9% for AGIs $75k-100k, 3.8% for AGIs $100k-200k, 5.0% for AGIs over 200k)
Net capital gain/loss in AGI: +$18,704 (reported on 18.6% of returns)
Here:
+$18,704
State:
+$10,406
(% of AGI for various income ranges: 0.3% for AGIs below $25k, 0.5% for AGIs $25k-50k, 0.8% for AGIs $50k-75k, 0.9% for AGIs $75k-100k, 2.2% for AGIs $100k-200k, 17.8% for AGIs over 200k)
Profit/loss from business: +$10,132 (reported on 15.3% of returns)
Here:
+$10,132
State:
+$11,105
(% of AGI for various income ranges: 4.0% for AGIs below $25k, 3.7% for AGIs $25k-50k, 3.4% for AGIs $50k-75k, 2.6% for AGIs $75k-100k, 3.0% for AGIs $100k-200k, 1.6% for AGIs over 200k)
Taxable individual retirement arrangement distribution: $19,172 (reported on 11.8% of returns)
47408:
$19,172
Indiana:
$13,841
(% of AGI for various income ranges: 2.2% for AGIs below $25k, 3.3% for AGIs $25k-50k, 3.5% for AGIs $50k-75k, 5.1% for AGIs $75k-100k, 5.3% for AGIs $100k-200k, 3.4% for AGIs over 200k)
Self-employment retirement plans: $15,500 (reported on 0.7% of returns)
47408:
$15,500
Indiana:
$21,482
Total itemized deductions: $24,166 (17% of AGI, reported on 25.4% of returns)
Here:
$24,166
State:
$20,913
Here:
17.4% of AGI
State:
18.2% of AGI
(% of AGI for various income ranges: 6.6% for AGIs below $25k, 7.3% for AGIs $25k-50k, 10.6% for AGIs $50k-75k, 11.7% for AGIs $75k-100k, 12.5% for AGIs $100k-200k, 12.0% for AGIs over 200k)
Charity contributions: $6,572 (reported on 20.8% of returns)
Here:
$6,572
State:
$4,697
(% of AGI for various income ranges: 0.4% for AGIs below $25k, 1.1% for AGIs $25k-50k, 1.8% for AGIs $50k-75k, 2.3% for AGIs $75k-100k, 2.6% for AGIs $100k-200k, 3.7% for AGIs over 200k)
Taxes paid: $8,170 (reported on 25.3% of returns)
47408:
$8,170
State:
$7,456
(% of AGI for various income ranges: 1.0% for AGIs below $25k, 1.6% for AGIs $25k-50k, 2.6% for AGIs $50k-75k, 3.5% for AGIs $75k-100k, 4.6% for AGIs $100k-200k, 4.9% for AGIs over 200k)
Earned income credit: $1,407 (reported on 13.4% of returns)
Here:
$1,407
State:
$2,265
(% of AGI for various income ranges: 2.7% for AGIs below $25k, 0.7% for AGIs $25k-50k)
Percentage of individuals using paid preparers for their 2012 taxes: 39.6%
Here:
40%
State:
53%
(% for various income ranges: 29.8% for AGIs below $25k, 39.4% for AGIs $25k-50k, 49.4% for AGIs $50k-75k, 49.1% for AGIs $75k-100k, 56.5% for AGIs $100k-200k, 73.1% for AGIs over 200k)
Averages for the 2004 tax year for zip code 47408, filed in 2005:
Average Adjusted Gross Income (AGI) in 2004: $42,844 (Individual Income Tax Returns)
Here:
$42,844
State:
$44,790
Salary/wage: $35,553 (reported on 82.8% of returns)
Here:
$35,553
State:
$39,615
(% of AGI for various income ranges: 112.8% for AGIs below $10k, 81.3% for AGIs $10k-25k, 78.0% for AGIs $25k-50k, 71.9% for AGIs $50k-75k, 70.9% for AGIs $75k-100k, 57.7% for AGIs over 100k)
Taxable interest for individuals: $1,763 (reported on 47.6% of returns)
This zip code:
$1,763
Indiana:
$1,535
(% of AGI for various income ranges: 4.7% for AGIs below $10k, 2.1% for AGIs $10k-25k, 1.9% for AGIs $25k-50k, 1.9% for AGIs $50k-75k, 1.5% for AGIs $75k-100k, 2.0% for AGIs over 100k)
Taxable dividends: $5,071 (reported on 27.2% of returns)
Here:
$5,071
State:
$2,998
(% of AGI for various income ranges: 3.7% for AGIs below $10k, 1.9% for AGIs $10k-25k, 2.2% for AGIs $25k-50k, 2.6% for AGIs $50k-75k, 2.5% for AGIs $75k-100k, 4.4% for AGIs over 100k)
Net capital gain/loss: +$8,446 (reported on 21.6% of returns)
Here:
+$8,446
State:
+$8,619
(% of AGI for various income ranges: -0.4% for AGIs below $10k, 0.5% for AGIs $10k-25k, 1.0% for AGIs $25k-50k, 1.1% for AGIs $50k-75k, 2.0% for AGIs $75k-100k, 8.6% for AGIs over 100k)
Profit/loss from business: +$9,961 (reported on 14.1% of returns)
Here:
+$9,961
State:
+$10,071
(% of AGI for various income ranges: -4.5% for AGIs below $10k, 3.3% for AGIs $10k-25k, 2.8% for AGIs $25k-50k, 3.7% for AGIs $50k-75k, 2.4% for AGIs $75k-100k, 4.1% for AGIs over 100k)
Profit/loss from farming: +$18 (reported on 0.7% of returns)
Here:
+$18
State:
-$2,212
(% of AGI for various income ranges: 0.2% for AGIs below $10k, -0.1% for AGIs $25k-50k, 0.0% for AGIs $50k-75k, 0.1% for AGIs $75k-100k)
IRA payment deduction: $2,741 (reported on 2.4% of returns)
47408:
$2,741
Indiana:
$2,840
(% of AGI for various income ranges: 0.2% for AGIs $10k-25k, 0.3% for AGIs $25k-50k, 0.2% for AGIs $50k-75k, 0.1% for AGIs $75k-100k, 0.1% for AGIs over 100k)
Self-employed pension: $17,542 (reported on 0.8% of returns)
Here:
$17,542
Indiana:
$15,305
Total itemized deductions: $16,720 (19% of AGI, reported on 31.8% of returns)
Here:
$16,720
State:
$17,065
Here:
19.4% of AGI
State:
19.5% of AGI
(% of AGI for various income ranges: 9.3% for AGIs below $10k, 7.0% for AGIs $10k-25k, 10.5% for AGIs $25k-50k, 14.3% for AGIs $50k-75k, 14.3% for AGIs $75k-100k, 13.2% for AGIs over 100k)
Charity contributions deductions: $4,491 (4% of AGI, reported on 24.2% of returns)
Here:
$4,491
State:
$3,550
Here:
4.4% of AGI
State:
3.8% of AGI
(% of AGI for various income ranges: 0.7% for AGIs below $10k, 0.7% for AGIs $10k-25k, 1.3% for AGIs $25k-50k, 2.2% for AGIs $50k-75k, 2.9% for AGIs $75k-100k, 3.5% for AGIs over 100k)
Total tax: $7,400 (reported on 73.0% of returns)
47408:
$7,400
State:
$6,914
(% of AGI for various income ranges: 2.4% for AGIs below $10k, 4.8% for AGIs $10k-25k, 7.4% for AGIs $25k-50k, 9.4% for AGIs $50k-75k, 10.9% for AGIs $75k-100k, 18.8% for AGIs over 100k)
Earned income credit: $1,077 (reported on 10.3% of returns)
Here:
$1,077
State:
$1,685
Percentage of individuals using paid preparers for their 2004 taxes: 42.6%
Here:
43%
State:
59%
(% for various income ranges: 35.6% for AGIs below $10k, 38.2% for AGIs $10k-25k, 43.5% for AGIs $25k-50k, 48.5% for AGIs $50k-75k, 49.3% for AGIs $75k-100k, 62.1% for AGIs over 100k)
Likely homosexual households (counted as self-reported same-sex unmarried-partner households)
Lesbian couples: 0.8% of all households
Gay men: 0.5% of all households
Household received Food Stamps/SNAP in the past 12 months: 377 Household did not receive Food Stamps/SNAP in the past 12 months: 8,669
Women who had a birth in the past 12 months: 94 (85 now married, 12 unmarried) Women who did not have a birth in the past 12 months: 6,190 (1,251 now married, 4,913 unmarried)
Housing units in zip code 47408 with a mortgage: 2,163 (238 second mortgage, 3 home equity loan, 209 both second mortgage and home equity loan) Houses without a mortgage: 23
Median monthly owner costs for units with a mortgage: $1,459 Median monthly owner costs for units without a mortgage: $472
Residents with income below the poverty level in 2022:
This zip code:
32.4%
Whole state:
12.6%
Residents with income below 50% of the poverty level in 2022:
This zip code:
12.5%
Whole state:
6.3%
Median number of rooms in houses and condos:
Here:
6.9
State:
6.6
Median number of rooms in apartments:
Here:
3.7
State:
4.3
Notable locations in this zip code not listed on our city pages
Notable locations in zip code 47408: Indiana University Stadium (A), Wheeler Mission Campground (B), Benton Township Volunteer Fire (C), Bloomington Township Fire Department Station 5 (D), Bloomington Fire Department (E), Bloomington Fire Department Station 1 (F), Bloomington Fire Department Station 4 (G), Bloomington Fire Department Station 3 (H), Benton Township Volunteer Fire Department (I), Bloomington Township Department of Fire and Rescue Station 5 Headquarters (J). Display/hide their locations on the map
Churches in zip code 47408 include: Bethel Church (A), Bethel Lane Church (B), Brummett Creek Church (C), Little Union Church (D), Mount Gilead Church (E), New Prospect Church (F), Dolan Ridge Mission (G), Saint Marks Church (H). Display/hide their locations on the map
Reservoirs: Bryant Creek Lake (A), University Lake (B), Beanblossom Lake (C), Lazy Lake (D), Bethal Lake (E), Schact Lake (F), Griffy Reservoir (G). Display/hide their locations on the map
1,684 married couples with children.
533 single-parent households (182 men, 351 women).
86.0% of residents of 47408 zip code speak English at home.
2.2% of residents speak Spanish at home (62% very well, 10% well, 27% not well, 2% not at all).
6.8% of residents speak other Indo-European language at home (83% very well, 11% well, 7% not well).
4.0% of residents speak Asian or Pacific Island language at home (61% very well, 33% well, 6% not well).
1.0% of residents speak other language at home (95% very well, 5% well).
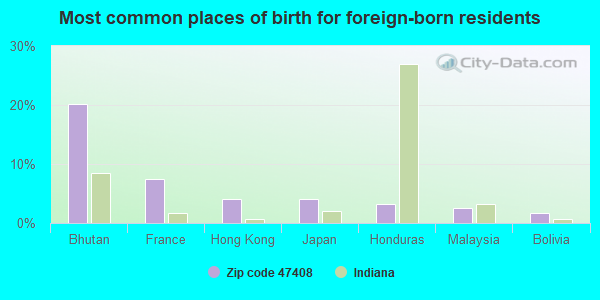
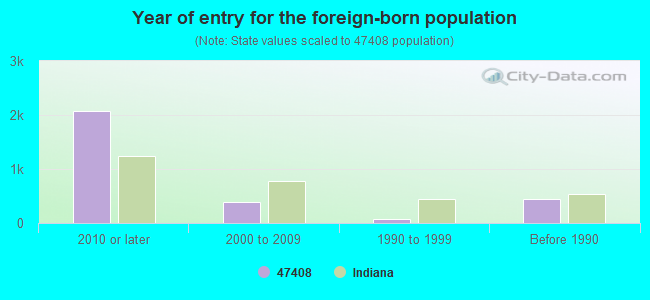
Foreign born population: 2,635 (12.0%) (30.6% of them are naturalized citizens)
Facilities with environmental interests located in this zip code:
MONROE COUNTY SWMD (7740 N FISH RD in BLOOMINGTON, IN)
(Integrated Compliance Information System) - ICIS-05-1982-0031, FORMAL ENFORCEMENT ACTION STATE MASTER (Indiana facility tracking) - CRTK-19820, EPCRA, CRTK-3018, LUST-199505517, LEAKING STORAGE TANK, UST-8326, UNDERGROUND STORAGE TANK PROGRAM CRITERIA AND HAZARDOUS AIR POLLUTANT INVENTORY (Inventory of air pollution sources) Business SIC classification: REFUSE SYSTEMS Business NAICS classification: SOLID WASTE LANDFILL. Alternative names: MONROE COUNTY LANDFILL, MONROE COUNTY SOLID WASTE MANAGEMENT DISTRICT, WASTE CONTROL INC
AXSOMS CUSTOM SERVICE (1100 N WALNUT in BLOOMINGTON, IN)
STATE MASTER (Indiana facility tracking) - LUST-199912559, LEAKING STORAGE TANK, UST-9573, UNDERGROUND STORAGE TANK PROGRAM (Resource Conservation and Recovery Act (tracking hazardous waste)) Alternative names: SUNOCO SERVICE STATION
MARLIN ELEMENTARY SCHOOL (1655 E BETHEL LN in BLOOMINGTON, IN)
(Geographic Names Information System) (National Center for Education Statistics) - STATE ID-6213 Organizations: MONROE COUNTY COM SCH CORP (SCHOOL DISTRICT)
SHELTON BODY SHOP (7723 N FOX HOLLOW RD in BLOOMINGTON, IN)
STATE MASTER (Indiana facility tracking) Conditionally Exempt Small Quantity Generators, less than 100 kg/month of hazardous waste (Resource Conservation and Recovery Act (tracking hazardous waste)) - notification Organizations: HAROLD W SHELTON (CONTACT/OWNER)
Housing units lacking complete plumbing facilities: 1.5% Housing units lacking complete kitchen facilities: 0.7%
47.3%Electricity
46.5%Utility gas
4.6%Bottled, tank, or LP gas
0.6%Wood
0.5%No fuel used
Population in 1990: 30,907.
Place of birth for U.S.-born residents:
This state: 11,286
Northeast: 1,258
Midwest: 3,382
South: 2,076
West: 1,265
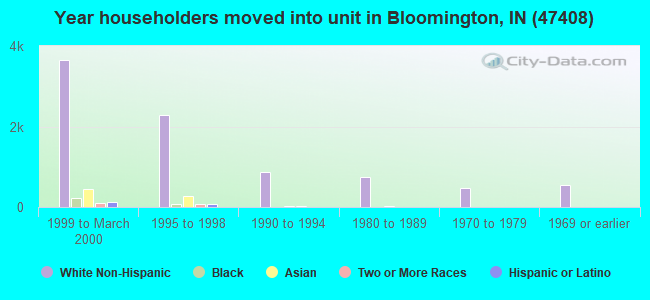
31% of the 47408 zip code residents lived in the same house 5 years ago. Out of people who lived in different houses, 23% lived in this county. Out of people who lived in different counties, 50% lived in Indiana.
82% of the 47408 zip code residents lived in the same house 1 year ago. Out of people who lived in different houses, 60% moved from this county. Out of people who lived in different houses, 13% moved from different county within same state. Out of people who lived in different houses, 19% moved from different state. Out of people who lived in different houses, 5% moved from abroad.
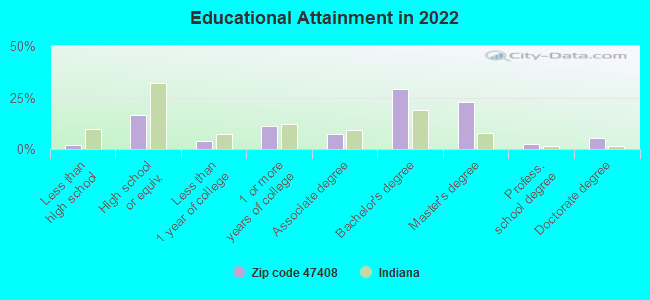
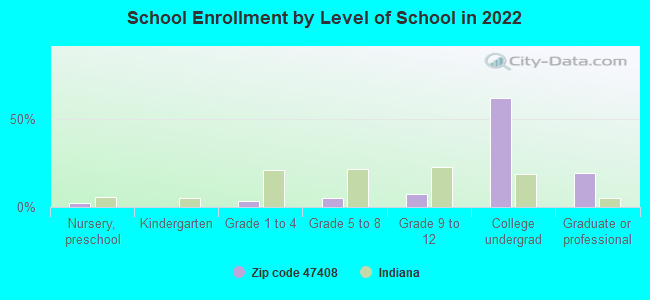
Private vs. public school enrollment:
Students in private schools in grades 1 to 8 (elementary and middle school): 287
Here:
30.5%
Indiana:
14.9%
Students in private schools in grades 9 to 12 (high school): 61
Here:
7.4%
Indiana:
11.4%
Students in private undergraduate colleges: 107
Here:
1.6%
Indiana:
22.3%
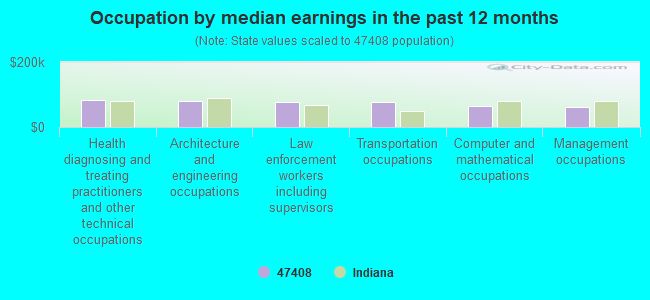
Occupation by median earnings in the past 12 months ($)
83,891Health diagnosing and treating practitioners and other technical occupations
80,296Architecture and engineering occupations
77,342Law enforcement workers including supervisors
77,009Transportation occupations
65,461Computer and mathematical occupations
62,040Management occupations
Companies with federal contracts located in this zip code (BLOOMINGTON, IN):
INDIANA UNIVERSITY FOUNDATION (1500 N STATE ROAD 46 BYP) 225 employees, $129814491 revenue: $569,000 in 69 contractsfrom 1999 to 2002
Contracts for Other Special Studies and Analyses by National Highway Traffic Safety Administration Signed by year:2000: $264,000; 2001: $202,000; 2002: $10,000; 2003: $0; 2004: $0; 2005: $0; 2006: $0.
Biggest contracts:
$96,000 with National Highway Traffic Safety Administration for Other Special Studies and Analyses. Signed on 2000-12-15. Completion date: 2001-02-15.
$77,000, same as above.Signed on 2000-09-15. Completion date: 2000-11-15.
$17,000, same as above.Signed on 2000-07-15. Completion date: 2000-09-15.
$15,000, same as above.Signed on 2000-11-15. Completion date: 2001-02-15.
CREATIVE WORK DESIGNS INC (4309 MORNINGSIDE DR; small business) : $220,545 in 4 contractsfrom 2001 to 2003
$84,000 with Air Force for Educational Studies and Analyses. Signed on 2003-02-11. Completion date: 2003-09-30.
$84,000, same as above.Signed on 2003-02-11. Completion date: 2003-02-28.
$47,000, same as above.Signed on 2001-09-27. Completion date: 2002-09-30.
$5,545 with Army for Lectures For Training. Taking place in TX. Signed on 2002-05-07. Completion date: 2002-05-06.
STONE BELT ARC INC (2815 E 10TH ST) : $50,290 in 142 contractsfrom 2003 to 2006
Contracts for Hose, Pipe, Tube, Lubrication, and Railing Fittings, Hosiery, Handwear, and Clothing Accessories, Men's, Individual Equipment, Tool and Hardware Boxes by Defense Logistics Agency, Federal Supply Service Signed by year:2000: $0; 2001: $0; 2002: $0; 2003: $1,074; 2004: $3,071; 2005: $24,761; 2006: $21,384.
Biggest contracts:
$9,900 with Defense Logistics Agency for Hose, Pipe, Tube, Lubrication, and Railing Fittings. Signed on 2005-10-29. Completion date: 2006-04-26.
$9,900 with Defense Logistics Agency for Hosiery, Handwear, and Clothing Accessories, Men's. Signed on 2006-04-28. Completion date: 2006-05-31.
$5,814 with Defense Logistics Agency for Individual Equipment. Signed on 2006-04-03. Completion date: 2006-06-03.
$5,814, same as above.Signed on 2005-06-14. Completion date: 2005-09-11.
P E I, INC (7630 N FOX HOLLOW RD; small business)
$27,297 with Air Force for Fuel Cell Power Units, Components,and Accessories. Taking place in HI. Signed on 2004-02-25. Completion date: 2004-04-19.
ALEXANDERS CAMPER SALES (5111 E STATE ROAD 45; small business)
$4,785 with Navy for Miscellaneous Vehicular Components. Signed on 2005-06-15. Completion date: 2005-07-13.
MCD MACHINE INC (1718 E WINESAP CT; small business)
$3,600 with Navy for Miscellaneous Aircraft Accessories and Components. Signed on 2006-03-03. Completion date: 2006-03-21.
Top industries in this zip code by the number of employees in 2005:
2003 - 2018 National Fire Incident Reporting System (NFIRS) incidents
Based on the data from the years 2003 - 2018 the average number of fires per year is 66. The highest number of fires - 119 took place in 2010, and the least - 18 in 2018. The data has a decreasing trend.
When looking into fire subcategories, the most incidents belonged to: Outside Fires (58.8%), and Structure Fires (25.1%).
Fire incident types reported to NFIRS in Zip Code 47408


+$18
-$2,212
(% of AGI for various income ranges: 0.2% for AGIs below $10k, -0.1% for AGIs $25k-50k, 0.0% for AGIs $50k-75k, 0.1% for AGIs $75k-100k) Nearest zip codes: 47406, 47405, 47468, 47404, 47401, 47429.
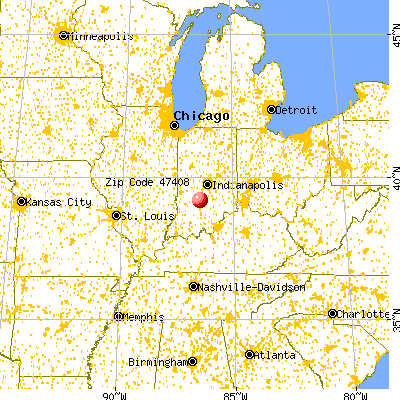


 Based on the data from the years 2003 - 2018 the average number of fires per year is 66. The highest number of fires - 119 took place in 2010, and the least - 18 in 2018. The data has a decreasing trend.
 When looking into fire subcategories, the most incidents belonged to: Outside Fires (58.8%), and Structure Fires (25.1%).