Bloomington, Indiana Submit your own pictures of this city and show them to the world
OSM Map
General Map
Google Map
MSN Map
OSM Map
General Map
Google Map
MSN Map
OSM Map
General Map
Google Map
MSN Map
OSM Map
General Map
Google Map
MSN Map
Please wait while loading the map...
Population in 2022: 79,107 (99% urban, 1% rural). Population change since 2000: +14.2%Males: 39,208 Females: 39,899
March 2022 cost of living index in Bloomington: 88.5 (less than average, U.S. average is 100) Percentage of residents living in poverty in 2022: 30.0%for White Non-Hispanic residents , 37.7% for Black residents , 24.2% for Hispanic or Latino residents , 5.0% for American Indian residents , 23.7% for other race residents , 34.1% for two or more races residents )
Profiles of local businesses
Business Search - 14 Million verified businesses
Data:
Median household income ($)
Median household income (% change since 2000)
Household income diversity
Ratio of average income to average house value (%)
Ratio of average income to average rent
Median household income ($) - White
Median household income ($) - Black or African American
Median household income ($) - Asian
Median household income ($) - Hispanic or Latino
Median household income ($) - American Indian and Alaska Native
Median household income ($) - Multirace
Median household income ($) - Other Race
Median household income for houses/condos with a mortgage ($)
Median household income for apartments without a mortgage ($)
Races - White alone (%)
Races - White alone (% change since 2000)
Races - Black alone (%)
Races - Black alone (% change since 2000)
Races - American Indian alone (%)
Races - American Indian alone (% change since 2000)
Races - Asian alone (%)
Races - Asian alone (% change since 2000)
Races - Hispanic (%)
Races - Hispanic (% change since 2000)
Races - Native Hawaiian and Other Pacific Islander alone (%)
Races - Native Hawaiian and Other Pacific Islander alone (% change since 2000)
Races - Two or more races (%)
Races - Two or more races (% change since 2000)
Races - Other race alone (%)
Races - Other race alone (% change since 2000)
Racial diversity
Unemployment (%)
Unemployment (% change since 2000)
Unemployment (%) - White
Unemployment (%) - Black or African American
Unemployment (%) - Asian
Unemployment (%) - Hispanic or Latino
Unemployment (%) - American Indian and Alaska Native
Unemployment (%) - Multirace
Unemployment (%) - Other Race
Population density (people per square mile)
Population - Males (%)
Population - Females (%)
Population - Males (%) - White
Population - Males (%) - Black or African American
Population - Males (%) - Asian
Population - Males (%) - Hispanic or Latino
Population - Males (%) - American Indian and Alaska Native
Population - Males (%) - Multirace
Population - Males (%) - Other Race
Population - Females (%) - White
Population - Females (%) - Black or African American
Population - Females (%) - Asian
Population - Females (%) - Hispanic or Latino
Population - Females (%) - American Indian and Alaska Native
Population - Females (%) - Multirace
Population - Females (%) - Other Race
Coronavirus confirmed cases (Apr 27, 2024)
Deaths caused by coronavirus (Apr 27, 2024)
Coronavirus confirmed cases (per 100k population) (Apr 27, 2024)
Deaths caused by coronavirus (per 100k population) (Apr 27, 2024)
Daily increase in number of cases (Apr 27, 2024)
Weekly increase in number of cases (Apr 27, 2024)
Cases doubled (in days) (Apr 27, 2024)
Hospitalized patients (Apr 18, 2022)
Negative test results (Apr 18, 2022)
Total test results (Apr 18, 2022)
COVID Vaccine doses distributed (per 100k population) (Sep 19, 2023)
COVID Vaccine doses administered (per 100k population) (Sep 19, 2023)
COVID Vaccine doses distributed (Sep 19, 2023)
COVID Vaccine doses administered (Sep 19, 2023)
Likely homosexual households (%)
Likely homosexual households (% change since 2000)
Likely homosexual households - Lesbian couples (%)
Likely homosexual households - Lesbian couples (% change since 2000)
Likely homosexual households - Gay men (%)
Likely homosexual households - Gay men (% change since 2000)
Cost of living index
Median gross rent ($)
Median contract rent ($)
Median monthly housing costs ($)
Median house or condo value ($)
Median house or condo value ($ change since 2000)
Mean house or condo value by units in structure - 1, detached ($)
Mean house or condo value by units in structure - 1, attached ($)
Mean house or condo value by units in structure - 2 ($)
Mean house or condo value by units in structure by units in structure - 3 or 4 ($)
Mean house or condo value by units in structure - 5 or more ($)
Mean house or condo value by units in structure - Boat, RV, van, etc. ($)
Mean house or condo value by units in structure - Mobile home ($)
Median house or condo value ($) - White
Median house or condo value ($) - Black or African American
Median house or condo value ($) - Asian
Median house or condo value ($) - Hispanic or Latino
Median house or condo value ($) - American Indian and Alaska Native
Median house or condo value ($) - Multirace
Median house or condo value ($) - Other Race
Median resident age
Resident age diversity
Median resident age - Males
Median resident age - Females
Median resident age - White
Median resident age - Black or African American
Median resident age - Asian
Median resident age - Hispanic or Latino
Median resident age - American Indian and Alaska Native
Median resident age - Multirace
Median resident age - Other Race
Median resident age - Males - White
Median resident age - Males - Black or African American
Median resident age - Males - Asian
Median resident age - Males - Hispanic or Latino
Median resident age - Males - American Indian and Alaska Native
Median resident age - Males - Multirace
Median resident age - Males - Other Race
Median resident age - Females - White
Median resident age - Females - Black or African American
Median resident age - Females - Asian
Median resident age - Females - Hispanic or Latino
Median resident age - Females - American Indian and Alaska Native
Median resident age - Females - Multirace
Median resident age - Females - Other Race
Commute - mean travel time to work (minutes)
Travel time to work - Less than 5 minutes (%)
Travel time to work - Less than 5 minutes (% change since 2000)
Travel time to work - 5 to 9 minutes (%)
Travel time to work - 5 to 9 minutes (% change since 2000)
Travel time to work - 10 to 19 minutes (%)
Travel time to work - 10 to 19 minutes (% change since 2000)
Travel time to work - 20 to 29 minutes (%)
Travel time to work - 20 to 29 minutes (% change since 2000)
Travel time to work - 30 to 39 minutes (%)
Travel time to work - 30 to 39 minutes (% change since 2000)
Travel time to work - 40 to 59 minutes (%)
Travel time to work - 40 to 59 minutes (% change since 2000)
Travel time to work - 60 to 89 minutes (%)
Travel time to work - 60 to 89 minutes (% change since 2000)
Travel time to work - 90 or more minutes (%)
Travel time to work - 90 or more minutes (% change since 2000)
Marital status - Never married (%)
Marital status - Now married (%)
Marital status - Separated (%)
Marital status - Widowed (%)
Marital status - Divorced (%)
Median family income ($)
Median family income (% change since 2000)
Median non-family income ($)
Median non-family income (% change since 2000)
Median per capita income ($)
Median per capita income (% change since 2000)
Median family income ($) - White
Median family income ($) - Black or African American
Median family income ($) - Asian
Median family income ($) - Hispanic or Latino
Median family income ($) - American Indian and Alaska Native
Median family income ($) - Multirace
Median family income ($) - Other Race
Median year house/condo built
Median year apartment built
Year house built - Built 2005 or later (%)
Year house built - Built 2000 to 2004 (%)
Year house built - Built 1990 to 1999 (%)
Year house built - Built 1980 to 1989 (%)
Year house built - Built 1970 to 1979 (%)
Year house built - Built 1960 to 1969 (%)
Year house built - Built 1950 to 1959 (%)
Year house built - Built 1940 to 1949 (%)
Year house built - Built 1939 or earlier (%)
Average household size
Household density (households per square mile)
Average household size - White
Average household size - Black or African American
Average household size - Asian
Average household size - Hispanic or Latino
Average household size - American Indian and Alaska Native
Average household size - Multirace
Average household size - Other Race
Occupied housing units (%)
Vacant housing units (%)
Owner occupied housing units (%)
Renter occupied housing units (%)
Vacancy status - For rent (%)
Vacancy status - For sale only (%)
Vacancy status - Rented or sold, not occupied (%)
Vacancy status - For seasonal, recreational, or occasional use (%)
Vacancy status - For migrant workers (%)
Vacancy status - Other vacant (%)
Residents with income below the poverty level (%)
Residents with income below 50% of the poverty level (%)
Children below poverty level (%)
Poor families by family type - Married-couple family (%)
Poor families by family type - Male, no wife present (%)
Poor families by family type - Female, no husband present (%)
Poverty status for native-born residents (%)
Poverty status for foreign-born residents (%)
Poverty among high school graduates not in families (%)
Poverty among people who did not graduate high school not in families (%)
Residents with income below the poverty level (%) - White
Residents with income below the poverty level (%) - Black or African American
Residents with income below the poverty level (%) - Asian
Residents with income below the poverty level (%) - Hispanic or Latino
Residents with income below the poverty level (%) - American Indian and Alaska Native
Residents with income below the poverty level (%) - Multirace
Residents with income below the poverty level (%) - Other Race
Air pollution - Air Quality Index (AQI)
Air pollution - CO
Air pollution - NO2
Air pollution - SO2
Air pollution - Ozone
Air pollution - PM10
Air pollution - PM25
Air pollution - Pb
Crime - Murders per 100,000 population
Crime - Rapes per 100,000 population
Crime - Robberies per 100,000 population
Crime - Assaults per 100,000 population
Crime - Burglaries per 100,000 population
Crime - Thefts per 100,000 population
Crime - Auto thefts per 100,000 population
Crime - Arson per 100,000 population
Crime - City-data.com crime index
Crime - Violent crime index
Crime - Property crime index
Crime - Murders per 100,000 population (5 year average)
Crime - Rapes per 100,000 population (5 year average)
Crime - Robberies per 100,000 population (5 year average)
Crime - Assaults per 100,000 population (5 year average)
Crime - Burglaries per 100,000 population (5 year average)
Crime - Thefts per 100,000 population (5 year average)
Crime - Auto thefts per 100,000 population (5 year average)
Crime - Arson per 100,000 population (5 year average)
Crime - City-data.com crime index (5 year average)
Crime - Violent crime index (5 year average)
Crime - Property crime index (5 year average)
1996 Presidential Elections Results (%) - Democratic Party (Clinton)
1996 Presidential Elections Results (%) - Republican Party (Dole)
1996 Presidential Elections Results (%) - Other
2000 Presidential Elections Results (%) - Democratic Party (Gore)
2000 Presidential Elections Results (%) - Republican Party (Bush)
2000 Presidential Elections Results (%) - Other
2004 Presidential Elections Results (%) - Democratic Party (Kerry)
2004 Presidential Elections Results (%) - Republican Party (Bush)
2004 Presidential Elections Results (%) - Other
2008 Presidential Elections Results (%) - Democratic Party (Obama)
2008 Presidential Elections Results (%) - Republican Party (McCain)
2008 Presidential Elections Results (%) - Other
2012 Presidential Elections Results (%) - Democratic Party (Obama)
2012 Presidential Elections Results (%) - Republican Party (Romney)
2012 Presidential Elections Results (%) - Other
2016 Presidential Elections Results (%) - Democratic Party (Clinton)
2016 Presidential Elections Results (%) - Republican Party (Trump)
2016 Presidential Elections Results (%) - Other
2020 Presidential Elections Results (%) - Democratic Party (Biden)
2020 Presidential Elections Results (%) - Republican Party (Trump)
2020 Presidential Elections Results (%) - Other
Ancestries Reported - Arab (%)
Ancestries Reported - Czech (%)
Ancestries Reported - Danish (%)
Ancestries Reported - Dutch (%)
Ancestries Reported - English (%)
Ancestries Reported - French (%)
Ancestries Reported - French Canadian (%)
Ancestries Reported - German (%)
Ancestries Reported - Greek (%)
Ancestries Reported - Hungarian (%)
Ancestries Reported - Irish (%)
Ancestries Reported - Italian (%)
Ancestries Reported - Lithuanian (%)
Ancestries Reported - Norwegian (%)
Ancestries Reported - Polish (%)
Ancestries Reported - Portuguese (%)
Ancestries Reported - Russian (%)
Ancestries Reported - Scotch-Irish (%)
Ancestries Reported - Scottish (%)
Ancestries Reported - Slovak (%)
Ancestries Reported - Subsaharan African (%)
Ancestries Reported - Swedish (%)
Ancestries Reported - Swiss (%)
Ancestries Reported - Ukrainian (%)
Ancestries Reported - United States (%)
Ancestries Reported - Welsh (%)
Ancestries Reported - West Indian (%)
Ancestries Reported - Other (%)
Educational Attainment - No schooling completed (%)
Educational Attainment - Less than high school (%)
Educational Attainment - High school or equivalent (%)
Educational Attainment - Less than 1 year of college (%)
Educational Attainment - 1 or more years of college (%)
Educational Attainment - Associate degree (%)
Educational Attainment - Bachelor's degree (%)
Educational Attainment - Master's degree (%)
Educational Attainment - Professional school degree (%)
Educational Attainment - Doctorate degree (%)
School Enrollment - Nursery, preschool (%)
School Enrollment - Kindergarten (%)
School Enrollment - Grade 1 to 4 (%)
School Enrollment - Grade 5 to 8 (%)
School Enrollment - Grade 9 to 12 (%)
School Enrollment - College undergrad (%)
School Enrollment - Graduate or professional (%)
School Enrollment - Not enrolled in school (%)
School enrollment - Public schools (%)
School enrollment - Private schools (%)
School enrollment - Not enrolled (%)
Median number of rooms in houses and condos
Median number of rooms in apartments
Housing units lacking complete plumbing facilities (%)
Housing units lacking complete kitchen facilities (%)
Density of houses
Urban houses (%)
Rural houses (%)
Households with people 60 years and over (%)
Households with people 65 years and over (%)
Households with people 75 years and over (%)
Households with one or more nonrelatives (%)
Households with no nonrelatives (%)
Population in households (%)
Family households (%)
Nonfamily households (%)
Population in families (%)
Family households with own children (%)
Median number of bedrooms in owner occupied houses
Mean number of bedrooms in owner occupied houses
Median number of bedrooms in renter occupied houses
Mean number of bedrooms in renter occupied houses
Median number of vehichles in owner occupied houses
Mean number of vehichles in owner occupied houses
Median number of vehichles in renter occupied houses
Mean number of vehichles in renter occupied houses
Mortgage status - with mortgage (%)
Mortgage status - with second mortgage (%)
Mortgage status - with home equity loan (%)
Mortgage status - with both second mortgage and home equity loan (%)
Mortgage status - without a mortgage (%)
Average family size
Average family size - White
Average family size - Black or African American
Average family size - Asian
Average family size - Hispanic or Latino
Average family size - American Indian and Alaska Native
Average family size - Multirace
Average family size - Other Race
Geographical mobility - Same house 1 year ago (%)
Geographical mobility - Moved within same county (%)
Geographical mobility - Moved from different county within same state (%)
Geographical mobility - Moved from different state (%)
Geographical mobility - Moved from abroad (%)
Place of birth - Born in state of residence (%)
Place of birth - Born in other state (%)
Place of birth - Native, outside of US (%)
Place of birth - Foreign born (%)
Housing units in structures - 1, detached (%)
Housing units in structures - 1, attached (%)
Housing units in structures - 2 (%)
Housing units in structures - 3 or 4 (%)
Housing units in structures - 5 to 9 (%)
Housing units in structures - 10 to 19 (%)
Housing units in structures - 20 to 49 (%)
Housing units in structures - 50 or more (%)
Housing units in structures - Mobile home (%)
Housing units in structures - Boat, RV, van, etc. (%)
House/condo owner moved in on average (years ago)
Renter moved in on average (years ago)
Year householder moved into unit - Moved in 1999 to March 2000 (%)
Year householder moved into unit - Moved in 1995 to 1998 (%)
Year householder moved into unit - Moved in 1990 to 1994 (%)
Year householder moved into unit - Moved in 1980 to 1989 (%)
Year householder moved into unit - Moved in 1970 to 1979 (%)
Year householder moved into unit - Moved in 1969 or earlier (%)
Means of transportation to work - Drove car alone (%)
Means of transportation to work - Carpooled (%)
Means of transportation to work - Public transportation (%)
Means of transportation to work - Bus or trolley bus (%)
Means of transportation to work - Streetcar or trolley car (%)
Means of transportation to work - Subway or elevated (%)
Means of transportation to work - Railroad (%)
Means of transportation to work - Ferryboat (%)
Means of transportation to work - Taxicab (%)
Means of transportation to work - Motorcycle (%)
Means of transportation to work - Bicycle (%)
Means of transportation to work - Walked (%)
Means of transportation to work - Other means (%)
Working at home (%)
Industry diversity
Most Common Industries - Agriculture, forestry, fishing and hunting, and mining (%)
Most Common Industries - Agriculture, forestry, fishing and hunting (%)
Most Common Industries - Mining, quarrying, and oil and gas extraction (%)
Most Common Industries - Construction (%)
Most Common Industries - Manufacturing (%)
Most Common Industries - Wholesale trade (%)
Most Common Industries - Retail trade (%)
Most Common Industries - Transportation and warehousing, and utilities (%)
Most Common Industries - Transportation and warehousing (%)
Most Common Industries - Utilities (%)
Most Common Industries - Information (%)
Most Common Industries - Finance and insurance, and real estate and rental and leasing (%)
Most Common Industries - Finance and insurance (%)
Most Common Industries - Real estate and rental and leasing (%)
Most Common Industries - Professional, scientific, and management, and administrative and waste management services (%)
Most Common Industries - Professional, scientific, and technical services (%)
Most Common Industries - Management of companies and enterprises (%)
Most Common Industries - Administrative and support and waste management services (%)
Most Common Industries - Educational services, and health care and social assistance (%)
Most Common Industries - Educational services (%)
Most Common Industries - Health care and social assistance (%)
Most Common Industries - Arts, entertainment, and recreation, and accommodation and food services (%)
Most Common Industries - Arts, entertainment, and recreation (%)
Most Common Industries - Accommodation and food services (%)
Most Common Industries - Other services, except public administration (%)
Most Common Industries - Public administration (%)
Occupation diversity
Most Common Occupations - Management, business, science, and arts occupations (%)
Most Common Occupations - Management, business, and financial occupations (%)
Most Common Occupations - Management occupations (%)
Most Common Occupations - Business and financial operations occupations (%)
Most Common Occupations - Computer, engineering, and science occupations (%)
Most Common Occupations - Computer and mathematical occupations (%)
Most Common Occupations - Architecture and engineering occupations (%)
Most Common Occupations - Life, physical, and social science occupations (%)
Most Common Occupations - Education, legal, community service, arts, and media occupations (%)
Most Common Occupations - Community and social service occupations (%)
Most Common Occupations - Legal occupations (%)
Most Common Occupations - Education, training, and library occupations (%)
Most Common Occupations - Arts, design, entertainment, sports, and media occupations (%)
Most Common Occupations - Healthcare practitioners and technical occupations (%)
Most Common Occupations - Health diagnosing and treating practitioners and other technical occupations (%)
Most Common Occupations - Health technologists and technicians (%)
Most Common Occupations - Service occupations (%)
Most Common Occupations - Healthcare support occupations (%)
Most Common Occupations - Protective service occupations (%)
Most Common Occupations - Fire fighting and prevention, and other protective service workers including supervisors (%)
Most Common Occupations - Law enforcement workers including supervisors (%)
Most Common Occupations - Food preparation and serving related occupations (%)
Most Common Occupations - Building and grounds cleaning and maintenance occupations (%)
Most Common Occupations - Personal care and service occupations (%)
Most Common Occupations - Sales and office occupations (%)
Most Common Occupations - Sales and related occupations (%)
Most Common Occupations - Office and administrative support occupations (%)
Most Common Occupations - Natural resources, construction, and maintenance occupations (%)
Most Common Occupations - Farming, fishing, and forestry occupations (%)
Most Common Occupations - Construction and extraction occupations (%)
Most Common Occupations - Installation, maintenance, and repair occupations (%)
Most Common Occupations - Production, transportation, and material moving occupations (%)
Most Common Occupations - Production occupations (%)
Most Common Occupations - Transportation occupations (%)
Most Common Occupations - Material moving occupations (%)
People in Group quarters - Institutionalized population (%)
People in Group quarters - Correctional institutions (%)
People in Group quarters - Federal prisons and detention centers (%)
People in Group quarters - Halfway houses (%)
People in Group quarters - Local jails and other confinement facilities (including police lockups) (%)
People in Group quarters - Military disciplinary barracks (%)
People in Group quarters - State prisons (%)
People in Group quarters - Other types of correctional institutions (%)
People in Group quarters - Nursing homes (%)
People in Group quarters - Hospitals/wards, hospices, and schools for the handicapped (%)
People in Group quarters - Hospitals/wards and hospices for chronically ill (%)
People in Group quarters - Hospices or homes for chronically ill (%)
People in Group quarters - Military hospitals or wards for chronically ill (%)
People in Group quarters - Other hospitals or wards for chronically ill (%)
People in Group quarters - Hospitals or wards for drug/alcohol abuse (%)
People in Group quarters - Mental (Psychiatric) hospitals or wards (%)
People in Group quarters - Schools, hospitals, or wards for the mentally retarded (%)
People in Group quarters - Schools, hospitals, or wards for the physically handicapped (%)
People in Group quarters - Institutions for the deaf (%)
People in Group quarters - Institutions for the blind (%)
People in Group quarters - Orthopedic wards and institutions for the physically handicapped (%)
People in Group quarters - Wards in general hospitals for patients who have no usual home elsewhere (%)
People in Group quarters - Wards in military hospitals for patients who have no usual home elsewhere (%)
People in Group quarters - Juvenile institutions (%)
People in Group quarters - Long-term care (%)
People in Group quarters - Homes for abused, dependent, and neglected children (%)
People in Group quarters - Residential treatment centers for emotionally disturbed children (%)
People in Group quarters - Training schools for juvenile delinquents (%)
People in Group quarters - Short-term care, detention or diagnostic centers for delinquent children (%)
People in Group quarters - Type of juvenile institution unknown (%)
People in Group quarters - Noninstitutionalized population (%)
People in Group quarters - College dormitories (includes college quarters off campus) (%)
People in Group quarters - Military quarters (%)
People in Group quarters - On base (%)
People in Group quarters - Barracks, unaccompanied personnel housing (UPH), (Enlisted/Officer), ;and similar group living quarters for military personnel (%)
People in Group quarters - Transient quarters for temporary residents (%)
People in Group quarters - Military ships (%)
People in Group quarters - Group homes (%)
People in Group quarters - Homes or halfway houses for drug/alcohol abuse (%)
People in Group quarters - Homes for the mentally ill (%)
People in Group quarters - Homes for the mentally retarded (%)
People in Group quarters - Homes for the physically handicapped (%)
People in Group quarters - Other group homes (%)
People in Group quarters - Religious group quarters (%)
People in Group quarters - Dormitories (%)
People in Group quarters - Agriculture workers' dormitories on farms (%)
People in Group quarters - Job Corps and vocational training facilities (%)
People in Group quarters - Other workers' dormitories (%)
People in Group quarters - Crews of maritime vessels (%)
People in Group quarters - Other nonhousehold living situations (%)
People in Group quarters - Other noninstitutional group quarters (%)
Residents speaking English at home (%)
Residents speaking English at home - Born in the United States (%)
Residents speaking English at home - Native, born elsewhere (%)
Residents speaking English at home - Foreign born (%)
Residents speaking Spanish at home (%)
Residents speaking Spanish at home - Born in the United States (%)
Residents speaking Spanish at home - Native, born elsewhere (%)
Residents speaking Spanish at home - Foreign born (%)
Residents speaking other language at home (%)
Residents speaking other language at home - Born in the United States (%)
Residents speaking other language at home - Native, born elsewhere (%)
Residents speaking other language at home - Foreign born (%)
Class of Workers - Employee of private company (%)
Class of Workers - Self-employed in own incorporated business (%)
Class of Workers - Private not-for-profit wage and salary workers (%)
Class of Workers - Local government workers (%)
Class of Workers - State government workers (%)
Class of Workers - Federal government workers (%)
Class of Workers - Self-employed workers in own not incorporated business and Unpaid family workers (%)
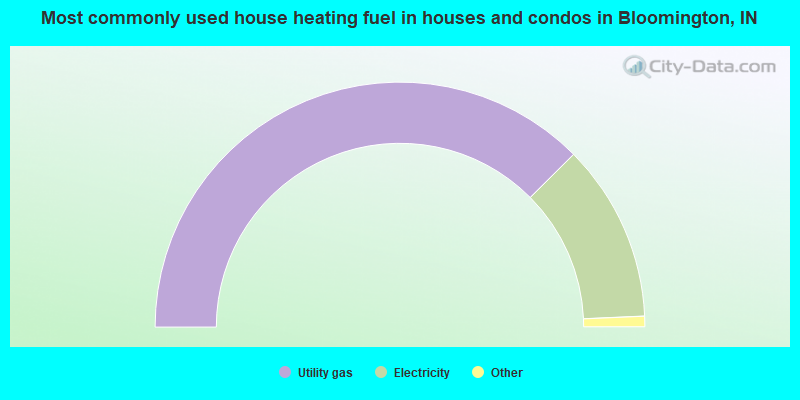
House heating fuel used in houses and condos - Utility gas (%)
House heating fuel used in houses and condos - Bottled, tank, or LP gas (%)
House heating fuel used in houses and condos - Electricity (%)
House heating fuel used in houses and condos - Fuel oil, kerosene, etc. (%)
House heating fuel used in houses and condos - Coal or coke (%)
House heating fuel used in houses and condos - Wood (%)
House heating fuel used in houses and condos - Solar energy (%)
House heating fuel used in houses and condos - Other fuel (%)
House heating fuel used in houses and condos - No fuel used (%)
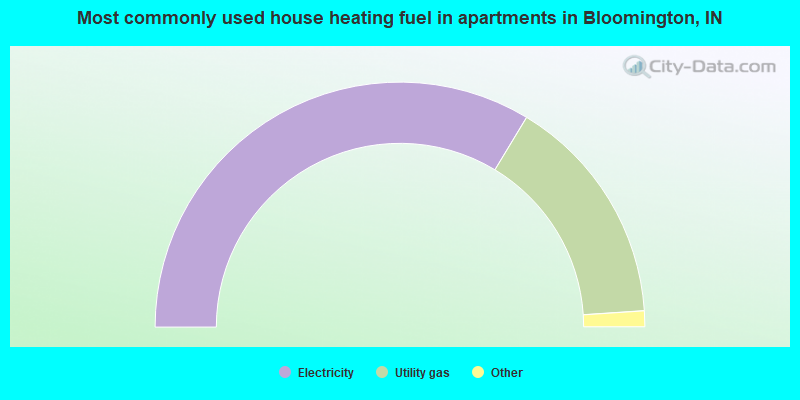
House heating fuel used in apartments - Utility gas (%)
House heating fuel used in apartments - Bottled, tank, or LP gas (%)
House heating fuel used in apartments - Electricity (%)
House heating fuel used in apartments - Fuel oil, kerosene, etc. (%)
House heating fuel used in apartments - Coal or coke (%)
House heating fuel used in apartments - Wood (%)
House heating fuel used in apartments - Solar energy (%)
House heating fuel used in apartments - Other fuel (%)
House heating fuel used in apartments - No fuel used (%)
Armed forces status - In Armed Forces (%)
Armed forces status - Civilian (%)
Armed forces status - Civilian - Veteran (%)
Armed forces status - Civilian - Nonveteran (%)
Fatal accidents locations in years 2005-2021
Fatal accidents locations in 2005
Fatal accidents locations in 2006
Fatal accidents locations in 2007
Fatal accidents locations in 2008
Fatal accidents locations in 2009
Fatal accidents locations in 2010
Fatal accidents locations in 2011
Fatal accidents locations in 2012
Fatal accidents locations in 2013
Fatal accidents locations in 2014
Fatal accidents locations in 2015
Fatal accidents locations in 2016
Fatal accidents locations in 2017
Fatal accidents locations in 2018
Fatal accidents locations in 2019
Fatal accidents locations in 2020
Fatal accidents locations in 2021
Alcohol use - People drinking some alcohol every month (%)
Alcohol use - People not drinking at all (%)
Alcohol use - Average days/month drinking alcohol
Alcohol use - Average drinks/week
Alcohol use - Average days/year people drink much
Audiometry - Average condition of hearing (%)
Audiometry - People that can hear a whisper from across a quiet room (%)
Audiometry - People that can hear normal voice from across a quiet room (%)
Audiometry - Ears ringing, roaring, buzzing (%)
Audiometry - Had a job exposure to loud noise (%)
Audiometry - Had off-work exposure to loud noise (%)
Blood Pressure & Cholesterol - Has high blood pressure (%)
Blood Pressure & Cholesterol - Checking blood pressure at home (%)
Blood Pressure & Cholesterol - Frequently checking blood cholesterol (%)
Blood Pressure & Cholesterol - Has high cholesterol level (%)
Consumer Behavior - Money monthly spent on food at supermarket/grocery store
Consumer Behavior - Money monthly spent on food at other stores
Consumer Behavior - Money monthly spent on eating out
Consumer Behavior - Money monthly spent on carryout/delivered foods
Consumer Behavior - Income spent on food at supermarket/grocery store (%)
Consumer Behavior - Income spent on food at other stores (%)
Consumer Behavior - Income spent on eating out (%)
Consumer Behavior - Income spent on carryout/delivered foods (%)
Current Health Status - General health condition (%)
Current Health Status - Blood donors (%)
Current Health Status - Has blood ever tested for HIV virus (%)
Current Health Status - Left-handed people (%)
Dermatology - People using sunscreen (%)
Diabetes - Diabetics (%)
Diabetes - Had a blood test for high blood sugar (%)
Diabetes - People taking insulin (%)
Diet Behavior & Nutrition - Diet health (%)
Diet Behavior & Nutrition - Milk product consumption (# of products/month)
Diet Behavior & Nutrition - Meals not home prepared (#/week)
Diet Behavior & Nutrition - Meals from fast food or pizza place (#/week)
Diet Behavior & Nutrition - Ready-to-eat foods (#/month)
Diet Behavior & Nutrition - Frozen meals/pizza (#/month)
Drug Use - People that ever used marijuana or hashish (%)
Drug Use - Ever used hard drugs (%)
Drug Use - Ever used any form of cocaine (%)
Drug Use - Ever used heroin (%)
Drug Use - Ever used methamphetamine (%)
Health Insurance - People covered by health insurance (%)
Kidney Conditions-Urology - Avg. # of times urinating at night
Medical Conditions - People with asthma (%)
Medical Conditions - People with anemia (%)
Medical Conditions - People with psoriasis (%)
Medical Conditions - People with overweight (%)
Medical Conditions - Elderly people having difficulties in thinking or remembering (%)
Medical Conditions - People who ever received blood transfusion (%)
Medical Conditions - People having trouble seeing even with glass/contacts (%)
Medical Conditions - People with arthritis (%)
Medical Conditions - People with gout (%)
Medical Conditions - People with congestive heart failure (%)
Medical Conditions - People with coronary heart disease (%)
Medical Conditions - People with angina pectoris (%)
Medical Conditions - People who ever had heart attack (%)
Medical Conditions - People who ever had stroke (%)
Medical Conditions - People with emphysema (%)
Medical Conditions - People with thyroid problem (%)
Medical Conditions - People with chronic bronchitis (%)
Medical Conditions - People with any liver condition (%)
Medical Conditions - People who ever had cancer or malignancy (%)
Mental Health - People who have little interest in doing things (%)
Mental Health - People feeling down, depressed, or hopeless (%)
Mental Health - People who have trouble sleeping or sleeping too much (%)
Mental Health - People feeling tired or having little energy (%)
Mental Health - People with poor appetite or overeating (%)
Mental Health - People feeling bad about themself (%)
Mental Health - People who have trouble concentrating on things (%)
Mental Health - People moving or speaking slowly or too fast (%)
Mental Health - People having thoughts they would be better off dead (%)
Oral Health - Average years since last visit a dentist
Oral Health - People embarrassed because of mouth (%)
Oral Health - People with gum disease (%)
Oral Health - General health of teeth and gums (%)
Oral Health - Average days a week using dental floss/device
Oral Health - Average days a week using mouthwash for dental problem
Oral Health - Average number of teeth
Pesticide Use - Households using pesticides to control insects (%)
Pesticide Use - Households using pesticides to kill weeds (%)
Physical Activity - People doing vigorous-intensity work activities (%)
Physical Activity - People doing moderate-intensity work activities (%)
Physical Activity - People walking or bicycling (%)
Physical Activity - People doing vigorous-intensity recreational activities (%)
Physical Activity - People doing moderate-intensity recreational activities (%)
Physical Activity - Average hours a day doing sedentary activities
Physical Activity - Average hours a day watching TV or videos
Physical Activity - Average hours a day using computer
Physical Functioning - People having limitations keeping them from working (%)
Physical Functioning - People limited in amount of work they can do (%)
Physical Functioning - People that need special equipment to walk (%)
Physical Functioning - People experiencing confusion/memory problems (%)
Physical Functioning - People requiring special healthcare equipment (%)
Prescription Medications - Average number of prescription medicines taking
Preventive Aspirin Use - Adults 40+ taking low-dose aspirin (%)
Reproductive Health - Vaginal deliveries (%)
Reproductive Health - Cesarean deliveries (%)
Reproductive Health - Deliveries resulted in a live birth (%)
Reproductive Health - Pregnancies resulted in a delivery (%)
Reproductive Health - Women breastfeeding newborns (%)
Reproductive Health - Women that had a hysterectomy (%)
Reproductive Health - Women that had both ovaries removed (%)
Reproductive Health - Women that have ever taken birth control pills (%)
Reproductive Health - Women taking birth control pills (%)
Reproductive Health - Women that have ever used Depo-Provera or injectables (%)
Reproductive Health - Women that have ever used female hormones (%)
Sexual Behavior - People 18+ that ever had sex (vaginal, anal, or oral) (%)
Sexual Behavior - Males 18+ that ever had vaginal sex with a woman (%)
Sexual Behavior - Males 18+ that ever performed oral sex on a woman (%)
Sexual Behavior - Males 18+ that ever had anal sex with a woman (%)
Sexual Behavior - Males 18+ that ever had any sex with a man (%)
Sexual Behavior - Females 18+ that ever had vaginal sex with a man (%)
Sexual Behavior - Females 18+ that ever performed oral sex on a man (%)
Sexual Behavior - Females 18+ that ever had anal sex with a man (%)
Sexual Behavior - Females 18+ that ever had any kind of sex with a woman (%)
Sexual Behavior - Average age people first had sex
Sexual Behavior - Average number of female sex partners in lifetime (males 18+)
Sexual Behavior - Average number of female vaginal sex partners in lifetime (males 18+)
Sexual Behavior - Average age people first performed oral sex on a woman (18+)
Sexual Behavior - Average number of woman performed oral sex on in lifetime (18+)
Sexual Behavior - Average number of male sex partners in lifetime (males 18+)
Sexual Behavior - Average number of male anal sex partners in lifetime (males 18+)
Sexual Behavior - Average age people first performed oral sex on a man (18+)
Sexual Behavior - Average number of male oral sex partners in lifetime (18+)
Sexual Behavior - People using protection when performing oral sex (%)
Sexual Behavior - Average number of times people have vaginal or anal sex a year
Sexual Behavior - People having sex without condom (%)
Sexual Behavior - Average number of male sex partners in lifetime (females 18+)
Sexual Behavior - Average number of male vaginal sex partners in lifetime (females 18+)
Sexual Behavior - Average number of female sex partners in lifetime (females 18+)
Sexual Behavior - Circumcised males 18+ (%)
Sleep Disorders - Average hours sleeping at night
Sleep Disorders - People that has trouble sleeping (%)
Smoking-Cigarette Use - People smoking cigarettes (%)
Taste & Smell - People 40+ having problems with smell (%)
Taste & Smell - People 40+ having problems with taste (%)
Taste & Smell - People 40+ that ever had wisdom teeth removed (%)
Taste & Smell - People 40+ that ever had tonsils teeth removed (%)
Taste & Smell - People 40+ that ever had a loss of consciousness because of a head injury (%)
Taste & Smell - People 40+ that ever had a broken nose or other serious injury to face or skull (%)
Taste & Smell - People 40+ that ever had two or more sinus infections (%)
Weight - Average height (inches)
Weight - Average weight (pounds)
Weight - Average BMI
Weight - People that are obese (%)
Weight - People that ever were obese (%)
Weight - People trying to lose weight (%)
According to our research of Indiana and other state lists, there were 7 registered sex offenders living in Bloomington, Indiana as of April 27, 2024 . The ratio of all residents to sex offenders in Bloomington is 11,949 to 1.The ratio of registered sex offenders to all residents in this city is much lower than the state average.
The City-Data.com crime index weighs serious crimes and violent crimes more heavily. Higher means more crime, U.S. average is 246.1. It adjusts for the number of visitors and daily workers commuting into cities.
- means the value is smaller than the state average.
- means the value is about the same as the state average.
- means the value is bigger than the state average.
- means the value is much bigger than the state average.
Crime rate in Bloomington detailed stats: murders, rapes, robberies, assaults, burglaries, thefts, arson Officers per 1,000 residents here:
1.13Indiana average:
2.18
Latest news from Bloomington, IN collected exclusively by city-data.com from local newspapers, TV, and radio stations
Ancestries: German (12.4%), English (9.5%), American (8.9%), European (6.2%), Irish (5.9%), Polish (2.4%).
Current Local Time:
Land area: 19.7 square miles.
Population density: 4,009 people per square mile (average).
10,391 residents are foreign born (8.4% Asia , 1.9% Europe ).
This city:
13.2%Indiana:
5.6%
Median real estate property taxes paid for housing units with mortgages in 2022: $2,500 (0.8%)Median real estate property taxes paid for housing units with no mortgage in 2022: $2,418 (0.9%)
Nearest city with pop. 200,000+: Indianapolis, IN
Nearest city with pop. 1,000,000+: Chicago, IL
Nearest cities:
Stinesville, IN (3.4 miles),
Latitude: 39.16 N, Longitude: 86.53 W
Daytime population change due to commuting: +18,413 (+23.8%)Workers who live and work in this city: 31,771 (77.1%)
Bloomington tourist attractions:
Unemployment in December 2023:
Population change in the 1990s: +5,616 (+8.8%).
Most common occupations in Bloomington, IN (%)
Both Males Females
Postsecondary teachers (10.7%)
Other management occupations, except farmers and farm managers (4.6%)
Waiters and waitresses (4.4%)
Other office and administrative support workers, including supervisors (4.0%)
Retail sales workers, except cashiers (3.9%)
Other sales and related occupations, including supervisors (3.4%)
Cashiers (3.3%)
Postsecondary teachers (12.0%)
Other management occupations, except farmers and farm managers (4.9%)
Computer specialists (4.7%)
Cooks and food preparation workers (4.0%)
Building and grounds cleaning and maintenance occupations (3.7%)
Other sales and related occupations, including supervisors (3.5%)
Retail sales workers, except cashiers (3.3%)
Postsecondary teachers (9.4%)
Other office and administrative support workers, including supervisors (5.8%)
Waiters and waitresses (5.5%)
Information and record clerks, except customer service representatives (5.1%)
Cashiers (4.5%)
Retail sales workers, except cashiers (4.5%)
Other management occupations, except farmers and farm managers (4.3%)
Tornado activity:
Bloomington-area historical tornado activity is near Indiana state average. It is 95% greater than the overall U.S. average.
On 6/2/1990, a category F4 (max. wind speeds 207-260 mph) tornado 19.8 miles away from the Bloomington city center killed one person and injured 51 people and caused between $500,000 and $5,000,000 in damages.
On 6/2/1990, a category F4 tornado 25.4 miles away from the city center injured 9 people and caused between $500,000 and $5,000,000 in damages.
Earthquake activity:
Bloomington-area historical earthquake activity is significantly above Indiana state average. It is 115% greater than the overall U.S. average. On 4/18/2008 at 09:36:59, a magnitude 5.4 (5.1 MB, 4.8 MS, 5.4 MW, 5.2 MW, Class: Moderate, Intensity: VI - VII) earthquake occurred 88.1 miles away from Bloomington center On 4/18/2008 at 09:36:59, a magnitude 5.2 (5.2 MW, Depth: 8.9 mi) earthquake occurred 88.1 miles away from Bloomington center On 6/10/1987 at 23:48:54, a magnitude 5.1 (4.9 MB, 4.4 MS, 4.6 MS, 5.1 LG) earthquake occurred 76.6 miles away from the city center On 6/18/2002 at 17:37:15, a magnitude 5.0 (4.3 MB, 4.6 MW, 5.0 LG) earthquake occurred 105.7 miles away from Bloomington center On 7/27/1980 at 18:52:21, a magnitude 5.2 (5.1 MB, 4.7 MS, 5.0 UK, 5.2 UK) earthquake occurred 154.5 miles away from the city center On 4/18/2008 at 15:14:16, a magnitude 4.8 (4.5 MB, 4.8 MW, 4.6 MW, Class: Light, Intensity: IV - V) earthquake occurred 85.4 miles away from the city center Magnitude types: regional Lg-wave magnitude (LG), body-wave magnitude (MB), surface-wave magnitude (MS), moment magnitude (MW) Natural disasters: The number of natural disasters in Monroe County (13) is near the US average (15).Major Disasters (Presidential) Declared: 9Emergencies Declared: 3Floods: 7, Storms: 7, Tornadoes: 5, Blizzard: 1, Hurricane: 1, Snow: 1, Snowstorm: 1, Wind: 1, Winter Storm: 1, Other: 1 (Note: some incidents may be assigned to more than one category). Main business address for: MONROE BANCORP STATE COMMERCIAL BANKS ).
Hospitals in Bloomington: BLOOMINGTON HOSPITAL HOSPICE (620 WEST 2ND ST PO BOX 1149) BLOOMINGTON MEADOWS HOSPITAL (3600 N PROW RD) CHRISTOLE INC (1701 WINSLOW ROAD) CHRISTOLE INC (2727 N DUNN) INDIANA UNIVERSITY HEALTH BLOOMINGTON HOSPITAL (Voluntary non-profit - Private, provides emergency services, 601 W SECOND ST) MONROE HOSPITAL (Proprietary, 4011 S MONROE MEDICAL PARK BLVD) OPTIONS FOR BETTER LIVING INC (2709 IDA LANE) SELECT SPECIALTY HOSPITAL-BLOOMINGTON ("601 W SECOND STREET, 4TH FLOOR") Nursing Homes in Bloomington: BELL TRACE HEALTH AND LIVING CENTER (725 BELL TRACE CIR) BLOOMINGTON CONVALESCENT CENTER (714 SOUTH ROGERS ST) BLOOMINGTON HOSPITAL - SUBACUTE CR CTR (601 W SECOND ST, PO BOX 1149) BLOOMINGTON NURSING AND REHABILITATION CENTER (120 E MILLER DR) GARDEN VILLA - BLOOMINGTON (1100 S CURRY PK) GOLDEN LIVING CENTER-BLOOMINGTON (155 E BURKS DR) MEADOWOOD HEALTH PAVILION (2455 TAMARACK TR) Dialysis Facilities in Bloomington: DAVITA - HOOSIER HILLS DIALYSIS (143 S. KINGSTON DRIVE) FMC - BLOOMINGTON MONROE (575 SOUTH PATTERSON DRIVE) Home Health Centers in Bloomington: AMEDISYS HOME HEALTH OF BLOOMINGTON (1332 W ARCH HAVEN AVE STE E) BLOOMINGTON HOSPITAL HOME HEALTH SERVICES (333 E MILLER DR PO BOX 1149) INDIANA HOME HEALTH CARE CORPORATION (3800 W GIFFORD RD)
Colleges/Universities in Bloomington: Indiana University-Bloomington Full-time enrollment: 39,039; Location: 107 South Indiana Ave.; Public; Website: www.iub.edu; Offers Doctor's degree )
Hair Arts Academy Full-time enrollment: 63; Location: 1681 N. College Ave; Private, for-profit; Website: www.thehairartsacademy.com)
Other colleges/universities with over 2000 students near Bloomington:
DePauw University (about 38 miles; Greencastle, IN ; Full-time enrollment: 2,360)
University of Indianapolis (about 44 miles; Indianapolis, IN ; FT enrollment: 4,625)
Indiana University-Purdue University-Indianapolis (about 47 miles; Indianapolis, IN ; FT enrollment: 22,751)
American College of Education (about 47 miles; Indianapolis, IN ; FT enrollment: 2,718)
Harrison College-Indianapolis (about 47 miles; Indianapolis, IN ; FT enrollment: 4,244)
Rose-Hulman Institute of Technology (about 48 miles; Terre Haute, IN ; FT enrollment: 2,123)
Marian University (about 49 miles; Indianapolis, IN ; FT enrollment: 2,476)
Public high schools in Bloomington:
Private high schools in Bloomington:
Biggest public elementary/middle schools in Bloomington: UNIVERSITY ELEMENTARY SCHOOL Students: 594, Location: 1111 N RUSSELL RD, Grades: PK-6)LORA L BATCHELOR MIDDLE SCH Students: 592, Location: 900 GORDON PIKE, Grades: 7-8)TRI-NORTH MIDDLE SCHOOL Students: 558, Location: 1000 W 15TH ST, Grades: 7-8)JACKSON CREEK MIDDLE SCH Students: 552, Location: 3980 S SARE RD, Grades: 7-8)SUMMIT ELEMENTARY SCHOOL Students: 534, Location: 1450 W COUNTRYSIDE LN, Grades: PK-6)GRANDVIEW ELEMENTARY SCHOOL Students: 534, Location: 2300 S ENDWRIGHT RD, Grades: PK-6)EDGEWOOD PRIMARY SCHOOL Students: 533, Location: 7700 W REEVES RD, Grades: KG-2)TEMPLETON ELEMENTARY SCHOOL Students: 511, Location: 1400 S BRENDA LN, Grades: PK-6)EDGEWOOD INTERMEDIATE SCHOOL Students: 483, Location: 7600 W REEVES RD, Grades: 3-5)CLEAR CREEK ELEMENTARY SCHOOL Students: 480, Location: 300 CLEAR CREEK DR, Grades: PK-6)Private elementary/middle schools in Bloomington: ST CHARLES CATHOLIC SCHOOL Students: 433, Location: 2224 E 3RD ST, Grades: PK-8)
THE PREP SCHOOL Students: 300, Location: 525 W 17TH ST, Grades: PK-5)CLEAR CREEK CHRISTIAN SCHOOL Students: 79, Location: 5405 S ROGERS ST, Grades: KG-6)GRACE BAPTIST ACADEMY Students: 35, Location: 2320 N SMITH PIKE, Grades: PK-5)ADVENTIST CHRISTIAN ELEMENTARY Students: 18, Location: 2230 N MARTHA ST, Grades: 1-8)See full list of schools located in Bloomington Library in Bloomington: MONROE COUNTY PUBLIC LIBRARY Operating income: $5,403,033; Location: 303 EAST KIRKWOOD AVENUE; 406,525 books ; 911 e-books ; 49,599 audio materials ; 57,492 video materials ; 16 local licensed databases ; 37 state licensed databases ; 704 print serial subscriptions ; 14 electronic serial subscriptions )
User-submitted facts and corrections:
new hospital, monroe hospital added by tim
Notable locations in Bloomington: (A) , Bloomington Fire Department (B) , Meadows Hospital (C) , Bloomington Fire Department Station 1 (D) , Bloomington Fire Department Station 2 (E) , Bloomington Fire Department Station 4 (F) , Bloomington Fire Department Station 5 (G) , Bloomington Fire Department Station 3 (H) . Display/hide their locations on the map
Shopping Center: (1) . Display/hide its location on the map
Main business address in Bloomington: (A) . Display/hide its location on the map
Churches in Bloomington include: (A) , Saint Pauls Church (B) , Faith Church (C) . Display/hide their locations on the map
Cemetery: (1) . Display/hide its location on the map
Lakes and reservoirs: (A) , University Lake (B) , Weimer Lake (C) , Griffy Reservoir (D) . Display/hide their locations on the map
Parks in Bloomington include: (1) , Camp Wapehani (2) , Cascade Park (3) . Display/hide their locations on the map
Tourist attractions: (1) , Monroe County Historical Society Museum (Cultural Attractions- Events- & Facilities; 202 East 6th Street) (2) , Mathers Museum of World Culture (Cultural Attractions- Events- & Facilities; 416 North Indiana Avenue) (3) , Bryan Rental (Amusement & Theme Parks; 2356 West Industrial Park Drive) (4) , Lotus World Music & Arts Festivals (Amusement & Theme Parks; 103 North College Avenue) (5) , KADY Lynn Park (Amusement & Theme Parks; 5331 West Woodyard Road) (6) , T JV Balloons (Amusement & Theme Parks; 1115 North College Avenue) (7) , Kamen David (Amusement & Theme Parks; 2356 West Industrial Park Drive) (8) , Mitchell Sales (Amusement & Theme Parks; 3110 West Venture Boulevard) (9) . Display/hide their approximate locations on the map
Hotels: (1) , Quality Inn (1100 West Rappel Avenue) (2) , Econo Lodge Bloomington (2601 Walnut Street) (3) , Days Inn Bloomington (200 Matlock Road) (4) , Grant Street Inn Bed & Breakfast (310 North Grant Street) (5) , Fairfield Inn (120 S Fairfield Dr) (6) , Southern Winds Inn (3000 South Old State Road 37) (7) , Motel 6 (126 Franklin Road) (8) , Econo Lodge at University (2601 North Walnut Street) (9) . Display/hide their approximate locations on the map
Courts: (1) , Monroe County - Circuit Court- Probate Administration (301 North College Avenue Suite 211) (2) , Federal Bureau Of Investigation (400 West 7th Street) (3) . Display/hide their approximate locations on the map
Birthplace of: Dee Bradley Baker - Voice actor, Mick Foley - Professional wrestler, Meg Cabot - Novelist, Claire Levy - Politician, David Lee Roth - Heavy metal singer, David Shuster - Television journalist, Dick Tomey - Football player and coach, Kevin Pritchard - Basketball player-coach, Amy Welborn - Writer, Andy Cherry - Musician.
Monroe County has a predicted average indoor radon screening level greater than 4 pCi/L (pico curies per liter) - Highest Potential Drinking water stations with addresses in Bloomington and their reported violations in the past:
CITY OF BLOOMINGTON UTILITIES (Population served: 68,270, Surface water):
Past monitoring violations:
Water Quality Parameter M/R - Between JUL-2010 and DEC-2010, Contaminant: Lead and Copper Rule. Follow-up actions: St Public Notif received (FEB-29-2012), St Compliance achieved (FEB-29-2012)
Population served: 5,075, Purch surface water):
Past monitoring violations:
Monitoring and Reporting (DBP) - Between APR-2012 and JUN-2012, Contaminant: Total Haloacetic Acids (HAA5). Follow-up actions: St Public Notif requested (SEP-04-2012), St Violation/Reminder Notice (SEP-04-2012), St Compliance achieved (SEP-28-2012), St Public Notif received (SEP-28-2012)
Monitoring and Reporting (DBP) - Between APR-2012 and JUN-2012, Contaminant: TTHM. Follow-up actions: St Public Notif requested (SEP-04-2012), St Violation/Reminder Notice (SEP-04-2012), St Compliance achieved (SEP-28-2012), St Public Notif received (SEP-28-2012)
Follow-up Or Routine LCR Tap M/R - In OCT-01-2009, Contaminant: Lead and Copper Rule. Follow-up actions: St Public Notif requested (NOV-09-2009), St Violation/Reminder Notice (NOV-09-2009), St Compliance achieved (DEC-15-2010)
Drinking water stations with addresses in Bloomington that have no violations reported:
EAST MONROE WATER CORPORATION (Population served: 4,618, Primary Water Source Type: Purch surface water)
Average household size: This city:
2.1 peopleIndiana:
2.5 people
Percentage of family households: This city:
35.9%Whole state:
66.9%
Percentage of households with unmarried partners: This city:
7.0%Whole state:
6.9%
Likely homosexual households (counted as self-reported same-sex unmarried-partner households)
Lesbian couples: 0.5% of all households Gay men: 0.4% of all households
People in group quarters in Bloomington in 2010:
13,757 people in college/university student housing
282 people in nursing facilities/skilled-nursing facilities
241 people in local jails and other municipal confinement facilities
200 people in other noninstitutional facilities
109 people in emergency and transitional shelters (with sleeping facilities) for people experiencing homelessness
33 people in workers' group living quarters and job corps centers
19 people in group homes for juveniles (non-correctional)
19 people in group homes intended for adults
8 people in residential treatment centers for adults
People in group quarters in Bloomington in 2000:
12,884 people in college dormitories (includes college quarters off campus)
327 people in nursing homes
215 people in hospitals or wards for drug/alcohol abuse
185 people in local jails and other confinement facilities (including police lockups)
176 people in other noninstitutional group quarters
146 people in mental (psychiatric) hospitals or wards
60 people in homes for the mentally retarded
10 people in other group homes
2 people in homes or halfway houses for drug/alcohol abuse
Arenas or stadiums:
Memorial Stadium. Capacity: 50,180. Indiana Hoosiers football.
Assembly Hall (Bloomington). Indiana University.
Banks with most branches in Bloomington (2011 data):
Old National Bank: 10 branches. Info updated 2011/08/01: Bank assets: $8,467.9 mil, Deposits: $6,653.1 mil, headquarters in Evansville, IN, positive income , 195 total offices , Holding Company: Old National Bancorp
JPMorgan Chase Bank, National Association: Bloomington Main Branch, Bloomington Motorbank, Eastland Branch, Ellettsville Branch, Walnut Station, Whitehall Banking Center Branch. Info updated 2011/11/10: Bank assets: $1,811,678.0 mil, Deposits: $1,190,738.0 mil, headquarters in Columbus, OH, positive income , International Specialization, 5577 total offices , Holding Company: Jpmorgan Chase & Co.
The Peoples State Bank: West Bloomington Branch, College Mall Branch, North Bloomington Branch, Kirkwood Branch, South Bloomington Branch. Info updated 2006/11/03: Bank assets: $177.0 mil, Deposits: $155.7 mil, headquarters in Ellettsville, IN, positive income , Commercial Lending Specialization, 11 total offices , Holding Company: Ellettsville Bancshares, Inc.
Regions Bank: Fountain Square Drive-Up, Whitehall Banking Center, College Mall Branch. Info updated 2011/02/24: Bank assets: $123,368.2 mil, Deposits: $98,301.3 mil, headquarters in Birmingham, AL, positive income , Commercial Lending Specialization, 1778 total offices , Holding Company: Regions Financial Corporation
Fifth Third Bank: Whitehall Plaza Branch, College Mall Branch, Bloomington Main Branch. Info updated 2009/10/05: Bank assets: $114,540.4 mil, Deposits: $89,689.1 mil, headquarters in Cincinnati, OH, positive income , Commercial Lending Specialization, 1378 total offices , Holding Company: Fifth Third Bancorp
United Commerce Bank: at 211 South College Avenue, branch established on 2000/01/31; Jackson Creek Branch at 1285 South College Mall Road, branch established on 2002/08/26. Info updated 2006/11/03: Bank assets: $155.5 mil, Deposits: $141.6 mil, local headquarters , negative income in the last year , Commercial Lending Specialization, 2 total offices , Holding Company: United Commerce Bancorp
Bloomfield State Bank: Liberty Branch at 2111 Liberty Drive, branch established on 1994/10/31; Bloomington Branch at 1301 North Walnut Street, branch established on 1985/11/18. Info updated 2007/03/06: Bank assets: $428.5 mil, Deposits: $344.7 mil, headquarters in Bloomfield, IN, positive income , Commercial Lending Specialization, 15 total offices , Holding Company: Universal Bancorp
German American Bancorp: Bloomington Branch at 504 North College, branch established on 2011/07/31; Bloomington Branch at 2614 East 3rd Street, branch established on 2007/02/01. Info updated 2011/02/01: Bank assets: $1,866.8 mil, Deposits: $1,578.2 mil, headquarters in Jasper, IN, positive income , Commercial Lending Specialization, 36 total offices , Holding Company: German American Bancorp, Inc.
Woodforest National Bank: Bloomington In Walmart Branch at 3313 W State Rt 45, branch established on 2008/11/01. Info updated 2011/05/10: Bank assets: $3,488.9 mil, Deposits: $3,097.6 mil, headquarters in Houston, TX, positive income , Commercial Lending Specialization, 766 total offices , Holding Company: Woodforest Financial Group Employee Stock Ownership Plan (With 401(K) Provisions)
5 other banks with 5 local branches
For population 15 years and over in Bloomington:
Never married: 65.5%Now married: 25.3%Separated: 0.5%Widowed: 1.7%Divorced: 7.0% For population 25 years and over in Bloomington:
High school or higher: 96.0%Bachelor's degree or higher: 60.7%Graduate or professional degree: 38.1%Unemployed: 4.8%Mean travel time to work (commute): 16.3 minutes
Education Gini index (Inequality in education) Here:
11.6Indiana average:
11.3
Religion statistics for Bloomington, IN (based on Monroe County data)
Religion Adherents Congregations Evangelical Protestant 16,945 90 Catholic 10,350 3 Mainline Protestant 10,021 30 Other 3,987 17 Black Protestant 270 3 Orthodox 225 1 None 96,176 -
Source: Clifford Grammich, Kirk Hadaway, Richard Houseal, Dale E.Jones, Alexei Krindatch, Richie Stanley and Richard H.Taylor. 2012. 2010 U.S.Religion Census: Religious Congregations & Membership Study. Association of Statisticians of American Religious Bodies. Jones, Dale E., et al. 2002. Congregations and Membership in the United States 2000. Nashville, TN: Glenmary Research Center. Graphs represent county-level data
Food Environment Statistics: Number of grocery stores : 24Monroe County :
1.88 / 10,000 pop.Indiana :
1.73 / 10,000 pop.
Number of supercenters and club stores : 1Here :
0.08 / 10,000 pop.Indiana :
0.21 / 10,000 pop.
Number of convenience stores (no gas) : 7Monroe County :
0.55 / 10,000 pop.Indiana :
0.50 / 10,000 pop.
Number of convenience stores (with gas) : 39Monroe County :
3.06 / 10,000 pop.Indiana :
3.57 / 10,000 pop.
Number of full-service restaurants : 104Here :
8.15 / 10,000 pop.Indiana :
6.78 / 10,000 pop.
Adult obesity rate : Monroe County :
26.1%Indiana :
29.0%
Low-income preschool obesity rate : Monroe County :
15.0%Indiana :
14.3%
Health and Nutrition: Healthy diet rate : Bloomington:
52.5%Indiana:
49.3%
Average overall health of teeth and gums : People feeling badly about themselves : This city:
18.4%Indiana:
21.3%
People not drinking alcohol at all : Average hours sleeping at night : Overweight people : Bloomington:
25.6%Indiana:
33.9%
General health condition : Bloomington:
63.7%Indiana:
56.1%
Average condition of hearing : Bloomington:
83.7%Indiana:
78.7%
More about Health and Nutrition of Bloomington, IN Residents
Local government employment and payroll (March 2022)
Function
Full-time employees
Monthly full-time payroll
Average yearly full-time wage
Part-time employees
Monthly part-time payroll
Water Supply
133 $605,756 $54,655 14 $31,221 Firefighters
98 $622,983 $76,284 0 $0 Police Protection - Officers
88 $574,530 $78,345 0 $0 Transit
75 $346,009 $55,361 10 $27,065 Police - Other
64 $280,349 $52,565 12 $9,006 Other Government Administration
57 $310,828 $65,437 20 $2,895 Parks and Recreation
49 $217,558 $53,280 78 $42,957 Other and Unallocable
39 $162,622 $50,038 0 $0 Streets and Highways
35 $146,147 $50,108 1 $1,809 Sewerage
31 $156,417 $60,549 1 $1,213 Financial Administration
30 $159,849 $63,940 0 $0 Solid Waste Management
24 $89,508 $44,754 0 $0 Housing and Community Development (Local)
24 $111,779 $55,890 1 $1,240 Health
16 $67,416 $50,562 4 $9,079 Judicial and Legal
11 $72,029 $78,577 0 $0 Fire - Other
5 $32,242 $77,381 0 $0
Totals for Government
779 $3,956,021 $60,940 141 $126,485
Bloomington government finances - Expenditure in 2021 (per resident):
Construction - Sewerage: $14,525,000 ($183.61)
Housing and Community Development: $13,037,000 ($164.80)Water Utilities: $4,172,000 ($52.74)Financial Administration: $2,599,000 ($32.85)Parks and Recreation: $2,010,000 ($25.41)Central Staff Services: $1,596,000 ($20.18)Regular Highways: $1,548,000 ($19.57)Police Protection: $1,459,000 ($18.44)General Public Buildings: $1,036,000 ($13.10)Parking Facilities: $726,000 ($9.18)General - Other: $95,000 ($1.20)Health - Other: $48,000 ($0.61)Solid Waste Management: $2,000 ($0.03)Current Operations - Sewerage: $54,881,000 ($693.76)
Water Utilities: $29,201,000 ($369.13)Central Staff Services: $18,437,000 ($233.06)Police Protection: $16,766,000 ($211.94)Housing and Community Development: $15,208,000 ($192.25)Local Fire Protection: $12,260,000 ($154.98)Parks and Recreation: $9,659,000 ($122.10)Transit Utilities: $6,915,000 ($87.41)Financial Administration: $6,811,000 ($86.10)Regular Highways: $6,717,000 ($84.91)General - Other: $6,122,000 ($77.39)Parking Facilities: $4,081,000 ($51.59)Solid Waste Management: $2,684,000 ($33.93)Judicial and Legal Services: $2,130,000 ($26.93)Health - Other: $1,634,000 ($20.66)General Public Buildings: $407,000 ($5.14)Protective Inspection and Regulation - Other: $4,000 ($0.05)General - Interest on Debt: $3,855,000 ($48.73)
Intergovernmental to Local - Other - Regular Highways: $544,000 ($6.88)
Other - Transit Utilities: $410,000 ($5.18)Other - Police Protection: $48,000 ($0.61)Other - General - Other: $9,000 ($0.11)Other - Central Staff Services: $6,000 ($0.08)Intergovernmental to State - Transit Utilities: $19,000 ($0.24)
Other Capital Outlay - Regular Highways: $1,200,000 ($15.17)
Financial Administration: $818,000 ($10.34)Parking Facilities: $682,000 ($8.62)Transit Utilities: $645,000 ($8.15)Parks and Recreation: $610,000 ($7.71)Police Protection: $526,000 ($6.65)General - Other: $223,000 ($2.82)Housing and Community Development: $48,000 ($0.61)Health - Other: $44,000 ($0.56)Total Salaries and Wages: $48,466,000 ($612.66)
Water Utilities - Interest on Debt: $2,338,000 ($29.55)
Bloomington government finances - Revenue in 2021 (per resident):
Charges - Sewerage: $26,812,000 ($338.93)
Parking Facilities: $4,876,000 ($61.64)Other: $4,487,000 ($56.72)Solid Waste Management: $4,343,000 ($54.90)Parks and Recreation: $1,125,000 ($14.22)Federal Intergovernmental - Housing and Community Development: $4,555,000 ($57.58)
Transit Utilities: $2,880,000 ($36.41)Highways: $303,000 ($3.83)Other: $83,000 ($1.05)Local Intergovernmental - Highways: $3,957,000 ($50.02)
Other: $174,000 ($2.20)Transit Utilities: $91,000 ($1.15)Miscellaneous - Donations From Private Sources: $963,000 ($12.17)
Interest Earnings: $952,000 ($12.03)General Revenue - Other: $511,000 ($6.46)Fines and Forfeits: $351,000 ($4.44)Sale of Property: $33,000 ($0.42)Revenue - Water Utilities: $17,644,000 ($223.04)
Transit Utilities: $1,383,000 ($17.48)State Intergovernmental - Other: $18,483,000 ($233.65)
General Local Government Support: $3,145,000 ($39.76)Transit Utilities: $2,551,000 ($32.25)Highways: $2,543,000 ($32.15)Housing and Community Development: $389,000 ($4.92)Health and Hospitals: $375,000 ($4.74)Tax - Property: $47,486,000 ($600.28)
Individual Income: $17,744,000 ($224.30)Other: $5,229,000 ($66.10)Other Selective Sales: $3,411,000 ($43.12)Public Utilities Sales: $653,000 ($8.25)Occupation and Business License - Other: $47,000 ($0.59)Other License: $7,000 ($0.09)
Bloomington government finances - Debt in 2021 (per resident):
Long Term Debt - Outstanding Unspecified Public Purpose: $197,796,000 ($2500.36)
Beginning Outstanding - Unspecified Public Purpose: $186,177,000 ($2353.48)Issue, Unspecified Public Purpose: $61,595,000 ($778.63)Retired Unspecified Public Purpose: $49,977,000 ($631.76)Beginning Outstanding - Public Debt for Private Purpose: $3,485,000 ($44.05)Outstanding Nonguaranteed - Industrial Revenue: $2,615,000 ($33.06)Retired Nonguaranteed - Public Debt for Private Purpose: $870,000 ($11.00)
Bloomington government finances - Cash and Securities in 2021 (per resident):
Other Funds - Cash and Securities: $180,128,000 ($2277.02)
Sinking Funds - Cash and Securities: $19,382,000 ($245.01)
Businesses in Bloomington, IN
Name Count Name Count
7-Eleven 1 Long John Silver's 2 ALDI 1 Lowe's 1 AT&T 5 Macy's 1 Abercrombie & Fitch 1 Marriott 3 Advance Auto Parts 1 MasterBrand Cabinets 19 Aeropostale 1 Maurices 1 American Eagle Outfitters 1 Mazda 1 Applebee's 1 McDonald's 5 Arby's 4 Menards 1 Audi 1 Motel 6 1 AutoZone 1 Motherhood Maternity 1 Baja Fresh Mexican Grill 1 New Balance 2 Barnes & Noble 1 Nike 10 Bath & Body Works 1 Nissan 1 Bed Bath & Beyond 2 Office Depot 1 Blockbuster 1 Old Navy 1 Budget Car Rental 1 Olive Garden 1 Buffalo Wild Wings 1 Outback 1 Burger King 4 Outback Steakhouse 1 CVS 6 Pac Sun 1 Charlotte Russe 1 Panda Express 1 Chevrolet 1 Panera Bread 1 Chick-Fil-A 2 Papa John's Pizza 2 Chico's 1 Payless 1 Chipotle 1 Penske 2 Circle K 8 PetSmart 1 Cold Stone Creamery 1 Pier 1 Imports 1 ColorTyme 1 Pizza Hut 3 Comfort Inn 1 Plato's Closet 1 Cracker Barrel 1 Qdoba Mexican Grill 1 Curves 2 Quality 1 DHL 1 Quiznos 1 Dairy Queen 1 RadioShack 2 Days Inn 1 Red Lobster 1 Decora Cabinetry 2 Rue21 1 Dennys 1 SAS Shoes 2 Domino's Pizza 2 SONIC Drive-In 1 Dunkin Donuts 1 Sam's Club 1 Express 1 Sears 2 FedEx 17 Shoe Carnival 1 Finish Line 1 Spencer Gifts 1 Firestone Complete Auto Care 1 Sprint Nextel 1 Foot Locker 1 Staples 1 Ford 1 Starbucks 6 GNC 1 Steak 'n Shake 3 GameStop 2 Subaru 1 Gymboree 1 Subway 12 H&R Block 5 Super 8 1 Hardee's 1 T-Mobile 4 Hilton 1 T.J.Maxx 1 Hobby Lobby 1 Taco Bell 3 Holiday Inn 2 Target 1 Hollister Co. 1 The Limited 1 Honda 1 Toyota 1 Hot Topic 1 Toys"R"Us 1 Hyundai 1 Travelodge 1 Jimmy Jazz 1 True Value 2 Jimmy John's 3 U-Haul 7 Jones New York 3 UPS 27 Journeys 1 Urban Outfitters 1 Justice 1 Vans 2 KFC 2 Verizon Wireless 1 Kincaid 2 Victoria's Secret 1 Kmart 2 Volkswagen 1 Kohl's 1 Walmart 1 Kroger 4 Wendy's 4 La-Z-Boy 1 Wet Seal 1 Lane Furniture 3 White Castle 1 LensCrafters 1 YMCA 1 Little Caesars Pizza 2
Strongest AM radio stations in Bloomington:
WGCL (1370 AM; 5 kW; BLOOMINGTON, IN; Owner: SARKES TARZIAN, INC,)
WIBC (1070 AM; 50 kW; INDIANAPOLIS, IN; Owner: EMMIS RADIO LICENSE CORPORATION)
WHAS (840 AM; 50 kW; LOUISVILLE, KY; Owner: CLEAR CHANNEL BROADCASTING LICENSES, INC.)
WLW (700 AM; 50 kW; CINCINNATI, OH; Owner: JACOR BROADCASTING CORPORATION)
WSAI (1530 AM; 50 kW; CINCINNATI, OH; Owner: JACOR BROADCASTING CORPORATION)
WOWO (1190 AM; 50 kW; FORT WAYNE, IN; Owner: PATHFINDER COMMUNICATIONS CORPORATION)
WTLC (1310 AM; 5 kW; INDIANAPOLIS, IN; Owner: RADIO ONE OF INDIANA, LLC)
WXLW (950 AM; 5 kW; INDIANAPOLIS, IN)
WSLM (1220 AM; 5 kW; SALEM, IN; Owner: DON H. MARTIN)
WTVN (610 AM; 50 kW; COLUMBUS, OH; Owner: CITICASTERS LICENSES, L.P.)
WKJK (1080 AM; 10 kW; LOUISVILLE, KY; Owner: CLEAR CHANNEL BROADCASTING LICENSES, INC.)
WBIW (1340 AM; 1 kW; BEDFORD, IN; Owner: AD-VENTURE MEDIA, INC.)
WLS (890 AM; 50 kW; CHICAGO, IL; Owner: WLS, INC.)
Strongest FM radio stations in Bloomington:
W251AG (98.1 FM; BLOOMINGTON, IN; Owner: BLOOMINGTON COMMUNITY RADIO)
W240AT (95.9 FM; BLOOMINGTON, IN; Owner: SARKES TARZIAN, INC.)
WFIU (103.7 FM; BLOOMINGTON, IN; Owner: TRUSTEES OF INDIANA UNIVERSITY)
WBWB (96.7 FM; BLOOMINGTON, IN; Owner: ARTISTIC MEDIA PARTNERS, L.P.)
WVNI (95.1 FM; NASHVILLE, IN; Owner: BROWN COUNTY BROADCASTERS, INC.)
WHCC (105.1 FM; ELLETTSVILLE, IN; Owner: ARTISTIC MEDIA PARTNERS, L.P.)
WFHB (91.3 FM; BLOOMINGTON, IN; Owner: BLOOMINGTON COMMUNITY RADIO INC)
WTTS (92.3 FM; BLOOMINGTON, IN; Owner: SARKES TARZIAN, INC.)
WCBK-FM (102.3 FM; MARTINSVILLE, IN; Owner: MID-AMERICA RADIO GROUP, INC.)
WSKT (92.7 FM; SPENCER, IN; Owner: MID-AMERICA RADIO OF INDIANA, INC.)
WQRK (105.5 FM; BEDFORD, IN; Owner: AD-VENTURE MEDIA, INC.)
WENS (97.1 FM; SHELBYVILLE, IN; Owner: EMMIS RADIO LICENSE CORPORATION)
W205BB (88.9 FM; BEDFORD, IN; Owner: BIBLE BROADCASTING NETWORK, INC.)
WQKC (93.7 FM; SEYMOUR, IN; Owner: S.C.I. BROADCASTING, INC.)
WKKG (101.5 FM; COLUMBUS, IN; Owner: WHITE RIVER BROADCASTING CO. INC.)
WWEG (102.5 FM; MITCHELL, IN; Owner: MITCHELL COMMUNITY BROADCASTING CO.)
WYGB (102.9 FM; EDINBURGH, IN; Owner: EDINBURGH RADIO)
WMBL (88.1 FM; MITCHELL, IN; Owner: THE MOODY BIBLE INSTITUTE OF CHICAGO)
TV broadcast stations around Bloomington:
WTIU (Channel 30; BLOOMINGTON, IN; Owner: THE TRUSTEES OF INDIANA UNIVERSITY)
WTTV (Channel 4; BLOOMINGTON, IN; Owner: TRIBUNE BROADCAST HOLDINGS, INC.)
WCLJ (Channel 42; BLOOMINGTON, IN; Owner: TRINITY BROADCASTING OF INDIANA, INC.)
WIPX (Channel 63; BLOOMINGTON, IN; Owner: PAXSON INDIANAPOLIS LICENSE, INC.)
National Bridge Inventory (NBI) Statistics 137 Number of bridges1,066ft / 325m Total length $7,496,000 Total costs1,374,603 Total average daily traffic172,417 Total average daily truck traffic
New bridges - historical statistics
1 1900-1909 2 1920-1929 2 1930-1939 5 1940-1949 2 1950-1959 9 1960-1969 25 1970-1979 13 1980-1989 17 1990-1999 20 2000-2009 41 2010-2019
See full National Bridge Inventory statistics for Bloomington, IN
Home Mortgage Disclosure Act Aggregated Statistics For Year 2009(Based on 7 full and 12 partial tracts) A) FHA, FSA/RHS & VA B) Conventional C) Refinancings D) Home Improvement Loans E) Loans on Dwellings For 5+ Families F) Non-occupant Loans on G) Loans On Manufactured Number Average Value Number Average Value Number Average Value Number Average Value Number Average Value Number Average Value Number Average Value
LOANS ORIGINATED 87 $138,559 317 $160,470 809 $165,773 48 $52,662 14 $2,330,751 131 $130,997 9 $43,587 APPLICATIONS APPROVED, NOT ACCEPTED 2 $115,265 15 $176,693 39 $158,162 4 $45,645 0 $0 10 $86,058 0 $0 APPLICATIONS DENIED 16 $123,459 36 $152,518 141 $181,760 11 $29,825 0 $0 24 $132,676 2 $28,840 APPLICATIONS WITHDRAWN 14 $137,721 25 $139,370 117 $161,809 2 $183,945 0 $0 12 $118,030 2 $22,275 FILES CLOSED FOR INCOMPLETENESS 1 $146,790 3 $250,127 28 $174,660 1 $36,390 0 $0 1 $94,560 0 $0
Aggregated Statistics For Year 2008(Based on 7 full and 12 partial tracts) A) FHA, FSA/RHS & VA B) Conventional C) Refinancings D) Home Improvement Loans E) Loans on Dwellings For 5+ Families F) Non-occupant Loans on G) Loans On Manufactured Number Average Value Number Average Value Number Average Value Number Average Value Number Average Value Number Average Value Number Average Value
LOANS ORIGINATED 41 $134,733 382 $156,242 358 $158,155 65 $104,257 26 $1,654,001 199 $156,390 6 $40,948 APPLICATIONS APPROVED, NOT ACCEPTED 7 $134,041 21 $143,623 41 $179,392 2 $14,665 2 $2,768,940 11 $153,291 0 $0 APPLICATIONS DENIED 11 $137,704 38 $113,262 111 $156,194 22 $19,431 0 $0 13 $120,365 14 $45,233 APPLICATIONS WITHDRAWN 8 $147,269 33 $127,432 70 $153,337 4 $138,940 0 $0 15 $134,121 0 $0 FILES CLOSED FOR INCOMPLETENESS 3 $117,303 4 $136,760 20 $139,236 1 $44,750 0 $0 3 $136,057 1 $48,430
Aggregated Statistics For Year 2007(Based on 7 full and 12 partial tracts) A) FHA, FSA/RHS & VA B) Conventional C) Refinancings D) Home Improvement Loans E) Loans on Dwellings For 5+ Families F) Non-occupant Loans on G) Loans On Manufactured Number Average Value Number Average Value Number Average Value Number Average Value Number Average Value Number Average Value Number Average Value
LOANS ORIGINATED 27 $136,896 603 $135,660 359 $159,615 63 $41,531 12 $2,043,790 215 $128,189 13 $72,535 APPLICATIONS APPROVED, NOT ACCEPTED 1 $133,780 52 $141,462 53 $125,832 8 $64,652 0 $0 16 $93,109 0 $0 APPLICATIONS DENIED 12 $110,818 56 $114,422 138 $141,033 28 $34,003 1 $350,000 34 $99,267 9 $35,013 APPLICATIONS WITHDRAWN 2 $116,140 56 $114,967 71 $116,334 9 $78,667 1 $520,000 21 $95,621 1 $59,180 FILES CLOSED FOR INCOMPLETENESS 1 $117,950 16 $119,565 26 $128,499 2 $87,505 0 $0 4 $42,560 0 $0
Aggregated Statistics For Year 2006(Based on 8 full and 12 partial tracts) A) FHA, FSA/RHS & VA B) Conventional C) Refinancings D) Home Improvement Loans E) Loans on Dwellings For 5+ Families F) Non-occupant Loans on G) Loans On Manufactured Number Average Value Number Average Value Number Average Value Number Average Value Number Average Value Number Average Value Number Average Value
LOANS ORIGINATED 16 $137,360 676 $124,586 383 $119,959 71 $29,557 6 $3,687,387 232 $123,239 10 $45,463 APPLICATIONS APPROVED, NOT ACCEPTED 4 $106,320 55 $120,221 61 $131,970 14 $64,484 0 $0 24 $117,848 1 $39,300 APPLICATIONS DENIED 2 $164,545 72 $97,628 167 $142,476 37 $51,964 0 $0 45 $160,536 9 $50,398 APPLICATIONS WITHDRAWN 4 $167,250 54 $130,571 88 $118,816 6 $81,102 0 $0 28 $126,367 1 $27,890 FILES CLOSED FOR INCOMPLETENESS 0 $0 16 $129,522 33 $142,655 1 $102,600 0 $0 3 $265,457 0 $0
Aggregated Statistics For Year 2005(Based on 7 full and 12 partial tracts) A) FHA, FSA/RHS & VA B) Conventional C) Refinancings D) Home Improvement Loans E) Loans on Dwellings For 5+ Families F) Non-occupant Loans on G) Loans On Manufactured Number Average Value Number Average Value Number Average Value Number Average Value Number Average Value Number Average Value Number Average Value
LOANS ORIGINATED 20 $119,982 661 $129,888 545 $128,328 78 $41,755 14 $1,702,576 304 $131,453 9 $31,824 APPLICATIONS APPROVED, NOT ACCEPTED 2 $140,835 55 $111,836 54 $106,717 10 $20,665 0 $0 20 $87,488 1 $45,800 APPLICATIONS DENIED 2 $89,265 110 $98,487 182 $121,647 59 $45,638 0 $0 45 $104,895 26 $30,734 APPLICATIONS WITHDRAWN 3 $130,890 72 $118,997 118 $137,283 12 $129,949 0 $0 24 $94,219 1 $51,470 FILES CLOSED FOR INCOMPLETENESS 1 $141,490 24 $118,438 76 $130,167 1 $102,230 0 $0 15 $103,039 0 $0
Aggregated Statistics For Year 2004(Based on 8 full and 12 partial tracts) A) FHA, FSA/RHS & VA B) Conventional C) Refinancings D) Home Improvement Loans E) Loans on Dwellings For 5+ Families F) Non-occupant Loans on G) Loans On Manufactured Number Average Value Number Average Value Number Average Value Number Average Value Number Average Value Number Average Value Number Average Value
LOANS ORIGINATED 29 $116,904 624 $130,675 634 $136,542 55 $18,587 24 $1,516,596 323 $116,455 17 $45,572 APPLICATIONS APPROVED, NOT ACCEPTED 3 $107,873 38 $108,228 59 $116,718 6 $26,067 0 $0 15 $86,867 4 $47,560 APPLICATIONS DENIED 7 $98,491 103 $106,641 206 $125,313 32 $19,534 2 $801,000 73 $156,063 21 $24,700 APPLICATIONS WITHDRAWN 3 $138,843 77 $119,625 115 $125,945 5 $75,524 0 $0 32 $107,532 2 $27,290 FILES CLOSED FOR INCOMPLETENESS 4 $118,642 21 $108,303 44 $117,640 1 $36,750 0 $0 9 $116,344 1 $31,100
Aggregated Statistics For Year 2003(Based on 7 full and 12 partial tracts) A) FHA, FSA/RHS & VA B) Conventional C) Refinancings D) Home Improvement Loans E) Loans on Dwellings For 5+ Families F) Non-occupant Loans on Number Average Value Number Average Value Number Average Value Number Average Value Number Average Value Number Average Value
LOANS ORIGINATED 33 $109,456 579 $121,889 1,444 $120,799 63 $29,499 40 $1,066,909 372 $101,744 APPLICATIONS APPROVED, NOT ACCEPTED 7 $107,731 42 $103,077 135 $112,280 7 $27,951 0 $0 20 $102,093 APPLICATIONS DENIED 4 $112,985 70 $94,235 229 $100,175 13 $28,192 0 $0 55 $101,479 APPLICATIONS WITHDRAWN 6 $93,028 60 $112,524 174 $112,181 4 $21,355 0 $0 28 $85,903 FILES CLOSED FOR INCOMPLETENESS 2 $77,020 19 $132,685 50 $123,901 0 $0 0 $0 10 $137,022
Aggregated Statistics For Year 2002(Based on 7 full and 3 partial tracts) A) FHA, FSA/RHS & VA B) Conventional C) Refinancings D) Home Improvement Loans E) Loans on Dwellings For 5+ Families F) Non-occupant Loans on Number Average Value Number Average Value Number Average Value Number Average Value Number Average Value Number Average Value
LOANS ORIGINATED 17 $108,059 216 $106,930 467 $117,609 37 $19,239 13 $646,519 202 $101,003 APPLICATIONS APPROVED, NOT ACCEPTED 0 $0 21 $124,220 40 $136,332 2 $25,245 0 $0 10 $92,180 APPLICATIONS DENIED 1 $51,860 21 $68,128 76 $86,401 5 $10,306 0 $0 20 $89,058 APPLICATIONS WITHDRAWN 1 $57,080 29 $138,138 55 $113,387 2 $54,070 0 $0 22 $130,623 FILES CLOSED FOR INCOMPLETENESS 0 $0 7 $75,104 28 $84,933 1 $21,330 0 $0 11 $67,432
Aggregated Statistics For Year 2001(Based on 7 full and 3 partial tracts) A) FHA, FSA/RHS & VA B) Conventional C) Refinancings D) Home Improvement Loans E) Loans on Dwellings For 5+ Families F) Non-occupant Loans on Number Average Value Number Average Value Number Average Value Number Average Value Number Average Value Number Average Value
LOANS ORIGINATED 12 $95,292 229 $103,892 375 $114,862 30 $22,687 23 $1,088,270 207 $110,023 APPLICATIONS APPROVED, NOT ACCEPTED 2 $91,275 14 $98,621 27 $75,713 2 $48,865 0 $0 8 $96,945 APPLICATIONS DENIED 0 $0 41 $65,345 89 $101,896 11 $6,966 1 $280,000 16 $90,168 APPLICATIONS WITHDRAWN 1 $97,370 13 $119,655 56 $95,094 5 $24,336 0 $0 10 $80,731 FILES CLOSED FOR INCOMPLETENESS 0 $0 7 $99,067 18 $99,559 0 $0 0 $0 6 $79,428
Aggregated Statistics For Year 2000(Based on 7 full and 3 partial tracts) A) FHA, FSA/RHS & VA B) Conventional C) Refinancings D) Home Improvement Loans E) Loans on Dwellings For 5+ Families F) Non-occupant Loans on Number Average Value Number Average Value Number Average Value Number Average Value Number Average Value Number Average Value
LOANS ORIGINATED 16 $100,054 162 $111,878 82 $83,157 53 $20,584 10 $981,212 72 $98,657 APPLICATIONS APPROVED, NOT ACCEPTED 1 $101,040 28 $88,586 25 $68,709 6 $13,340 0 $0 14 $83,363 APPLICATIONS DENIED 4 $74,610 48 $46,480 43 $56,287 9 $12,430 0 $0 7 $62,540 APPLICATIONS WITHDRAWN 3 $77,720 13 $313,089 24 $62,117 4 $75,835 0 $0 7 $503,204 FILES CLOSED FOR INCOMPLETENESS 0 $0 1 $133,210 8 $72,471 1 $8,270 0 $0 2 $62,435
Aggregated Statistics For Year 1999(Based on 7 full and 8 partial tracts) A) FHA, FSA/RHS & VA B) Conventional C) Refinancings D) Home Improvement Loans E) Loans on Dwellings For 5+ Families F) Non-occupant Loans on Number Average Value Number Average Value Number Average Value Number Average Value Number Average Value Number Average Value
LOANS ORIGINATED 53 $95,904 401 $107,317 356 $95,076 98 $13,041 16 $3,723,610 140 $93,521 APPLICATIONS APPROVED, NOT ACCEPTED 1 $50,910 23 $77,318 48 $75,018 11 $18,384 0 $0 7 $71,706 APPLICATIONS DENIED 5 $68,064 74 $48,390 118 $71,723 20 $15,264 0 $0 17 $77,366 APPLICATIONS WITHDRAWN 4 $82,722 45 $101,016 87 $82,200 9 $36,498 1 $20,098,660 6 $73,420 FILES CLOSED FOR INCOMPLETENESS 0 $0 8 $79,430 19 $108,523 1 $5,040 0 $0 7 $54,367
Detailed mortgage data for all 20 tracts in Bloomington, IN
Private Mortgage Insurance Companies Aggregated Statistics For Year 2009(Based on 6 full and 12 partial tracts) A) Conventional B) Refinancings C) Non-occupant Loans on Number Average Value Number Average Value Number Average Value
LOANS ORIGINATED 55 $189,383 41 $183,681 1 $212,210 APPLICATIONS APPROVED, NOT ACCEPTED 9 $235,551 12 $183,630 1 $158,000 APPLICATIONS DENIED 6 $175,038 5 $198,832 0 $0 APPLICATIONS WITHDRAWN 4 $208,385 3 $211,710 0 $0 FILES CLOSED FOR INCOMPLETENESS 2 $194,670 2 $131,290 1 $41,350
Aggregated Statistics For Year 2008(Based on 7 full and 12 partial tracts) A) Conventional B) Refinancings C) Non-occupant Loans on Number Average Value Number Average Value Number Average Value
LOANS ORIGINATED 110 $157,106 29 $155,233 18 $106,768 APPLICATIONS APPROVED, NOT ACCEPTED 30 $173,516 20 $159,676 4 $190,000 APPLICATIONS DENIED 5 $209,768 3 $231,257 4 $165,825 APPLICATIONS WITHDRAWN 5 $181,128 3 $189,093 4 $172,290 FILES CLOSED FOR INCOMPLETENESS 2 $120,465 0 $0 2 $120,465
Aggregated Statistics For Year 2007(Based on 7 full and 12 partial tracts) A) Conventional B) Refinancings C) Non-occupant Loans on Number Average Value Number Average Value Number Average Value
LOANS ORIGINATED 181 $135,182 24 $146,562 24 $96,874 APPLICATIONS APPROVED, NOT ACCEPTED 30 $133,376 5 $119,716 7 $101,757 APPLICATIONS DENIED 1 $302,970 0 $0 1 $293,000 APPLICATIONS WITHDRAWN 10 $159,360 4 $160,392 0 $0 FILES CLOSED FOR INCOMPLETENESS 1 $111,030 0 $0 0 $0
Aggregated Statistics For Year 2006(Based on 6 full and 12 partial tracts) A) Conventional B) Refinancings C) Non-occupant Loans on Number Average Value Number Average Value Number Average Value
LOANS ORIGINATED 111 $129,486 22 $149,332 20 $139,438 APPLICATIONS APPROVED, NOT ACCEPTED 16 $108,598 7 $148,061 3 $82,563 APPLICATIONS DENIED 2 $78,875 1 $153,040 2 $71,940 APPLICATIONS WITHDRAWN 10 $122,085 2 $80,360 3 $83,680 FILES CLOSED FOR INCOMPLETENESS 0 $0 1 $200,000 1 $200,000
Aggregated Statistics For Year 2005(Based on 6 full and 12 partial tracts) A) Conventional B) Refinancings C) Non-occupant Loans on Number Average Value Number Average Value Number Average Value
LOANS ORIGINATED 114 $127,882 30 $142,742 24 $113,662 APPLICATIONS APPROVED, NOT ACCEPTED 28 $108,822 12 $160,327 8 $93,609 APPLICATIONS DENIED 1 $97,900 0 $0 0 $0 APPLICATIONS WITHDRAWN 11 $146,829 4 $140,745 3 $83,440 FILES CLOSED FOR INCOMPLETENESS 1 $71,300 1 $39,690 0 $0
Aggregated Statistics For Year 2004(Based on 7 full and 12 partial tracts) A) Conventional B) Refinancings C) Non-occupant Loans on Number Average Value Number Average Value Number Average Value
LOANS ORIGINATED 132 $124,047 40 $125,483 43 $94,030 APPLICATIONS APPROVED, NOT ACCEPTED 25 $128,490 25 $131,706 6 $90,135 APPLICATIONS DENIED 3 $107,883 1 $191,000 4 $111,125 APPLICATIONS WITHDRAWN 11 $155,089 4 $107,160 5 $100,346 FILES CLOSED FOR INCOMPLETENESS 0 $0 0 $0 0 $0
Aggregated Statistics For Year 2003(Based on 6 full and 12 partial tracts) A) Conventional B) Refinancings C) Non-occupant Loans on Number Average Value Number Average Value Number Average Value
LOANS ORIGINATED 137 $121,651 133 $132,117 30 $94,991 APPLICATIONS APPROVED, NOT ACCEPTED 33 $122,708 33 $123,190 7 $90,180 APPLICATIONS DENIED 1 $38,520 2 $291,050 1 $130,000 APPLICATIONS WITHDRAWN 12 $112,948 12 $141,094 3 $135,080 FILES CLOSED FOR INCOMPLETENESS 0 $0 1 $46,090 0 $0
Aggregated Statistics For Year 2002(Based on 5 full and 3 partial tracts) A) Conventional B) Refinancings C) Non-occupant Loans on Number Average Value Number Average Value Number Average Value
LOANS ORIGINATED 60 $113,966 40 $112,846 23 $89,965 APPLICATIONS APPROVED, NOT ACCEPTED 6 $124,727 4 $77,750 1 $105,030 APPLICATIONS DENIED 0 $0 0 $0 0 $0 APPLICATIONS WITHDRAWN 4 $120,265 9 $72,488 10 $88,718 FILES CLOSED FOR INCOMPLETENESS 0 $0 0 $0 0 $0
Aggregated Statistics For Year 2001(Based on 5 full and 3 partial tracts) A) Conventional B) Refinancings C) Non-occupant Loans on Number Average Value Number Average Value Number Average Value
LOANS ORIGINATED 57 $109,435 34 $124,878 14 $94,435 APPLICATIONS APPROVED, NOT ACCEPTED 2 $107,480 9 $127,160 2 $50,905 APPLICATIONS DENIED 0 $0 3 $153,853 1 $119,000 APPLICATIONS WITHDRAWN 2 $117,890 0 $0 0 $0 FILES CLOSED FOR INCOMPLETENESS 0 $0 0 $0 0 $0
Aggregated Statistics For Year 2000(Based on 5 full and 3 partial tracts) A) Conventional B) Refinancings C) Non-occupant Loans on Number Average Value Number Average Value Number Average Value
LOANS ORIGINATED 36 $110,242 4 $125,228 3 $72,347 APPLICATIONS APPROVED, NOT ACCEPTED 4 $88,535 1 $135,260 0 $0 APPLICATIONS DENIED 3 $82,910 0 $0 0 $0 APPLICATIONS WITHDRAWN 0 $0 0 $0 0 $0 FILES CLOSED FOR INCOMPLETENESS 0 $0 0 $0 0 $0
Aggregated Statistics For Year 1999(Based on 6 full and 8 partial tracts) A) Conventional B) Refinancings C) Non-occupant Loans on Number Average Value Number Average Value Number Average Value
LOANS ORIGINATED 84 $109,659 24 $118,922 5 $75,402 APPLICATIONS APPROVED, NOT ACCEPTED 5 $122,534 7 $155,783 1 $76,000 APPLICATIONS DENIED 4 $116,905 0 $0 0 $0 APPLICATIONS WITHDRAWN 2 $83,845 0 $0 1 $48,100 FILES CLOSED FOR INCOMPLETENESS 0 $0 0 $0 0 $0
Fire-safe hotels and motels in Bloomington, Indiana:
Motel 6, 126 S Franklin Rd, Bloomington, Indiana 47401 Phone: (812) 332-0337
Travel Lodge, 2615 E 3 Rd, Bloomington, Indiana 47401 Phone: (812) 339-6191
A Summerhouse Inn, 4501 E 3rd St, Bloomington, Indiana 47401 Phone: (812) 332-2141, Fax: (812) 332-8441
College Motor Inn, 509 N College Ave, Bloomington, Indiana 47404 Phone: (812) 336-6881
Courtyard By Marriott Bloomington, 310 S College Ave, Bloomington, Indiana 47403 Phone: (812) 335-8000, Fax: (812) 336-9997
Fairfield Inn, 120 Fairfield Dr, Bloomington, Indiana 47404 Phone: (812) 331-1122, Fax: (812) 323-1133
Biddle Hotel And Conference Center, 900 East 7th St, Bloomington, Indiana 47405 Phone: (812) 855-5650, Fax: (812) 855-5653
Hilton Garden Inn, Bloomington, 245 N College Ave, Bloomington, Indiana 47404 Phone: (812) 331-1335, Fax: (812) 331-1060
12 other hotels and motels
All 20 fire-safe hotels and motels in Bloomington, Indiana
Most common first names in Bloomington, IN among deceased individuals Name Count Lived (average)
Mary 527 78.9 years John 412 74.6 years William 410 75.1 years Robert 403 70.2 years James 368 72.4 years Charles 339 74.5 years Dorothy 202 79.1 years Helen 201 79.9 years George 190 75.5 years Ruth 188 79.6 years
Most common last names in Bloomington, IN among deceased individuals Last name Count Lived (average)
Smith 193 76.1 years Johnson 140 75.4 years Deckard 136 75.8 years Jones 105 79.2 years Brown 99 77.0 years Taylor 86 74.8 years Miller 84 78.6 years Richardson 78 75.3 years May 78 75.0 years Moore 75 75.9 years
Bloomington compared to Indiana state average:
Unemployed percentage below state average. Median age significantly below state average. Foreign-born population percentage significantly above state average. Renting percentage above state average. Number of rooms per house below state average. Number of college students significantly above state average. Percentage of population with a bachelor's degree or higher significantly above state average. Bloomington on our top lists :
#1 on the list of "Top 101 cities with largest percentage of males in occupations: food preparation and serving related occupations (population 50,000+)"
#2 on the list of "Top 101 cities with largest percentage of males in industries: educational services (population 50,000+)"
#5 on the list of "Top 101 cities with largest percentage of males in occupations: education, training, and library occupations (population 50,000+)"
#5 on the list of "Top 101 cities with largest percentage of females in occupations: education, training, and library occupations (population 50,000+)"
#5 on the list of "Top 101 cities with largest percentage of females in occupations: food preparation and serving related occupations (population 50,000+)"
#7 on the list of "Top 100 cities with youngest residents (pop. 50,000+)"
#8 on the list of "Top 100 cities with highest percentage of college students (pop. 50,000+)"
#9 on the list of "Top 101 cities where the highest percentage of females (15+ years) which never married (with at least 10,000 females in this group)"
#9 on the list of "Top 101 cities with the most people having Doctorate degrees (population 50,000+)"
#9 on the list of "Top 101 cities with largest percentage of males in industries: accommodation and food services (population 50,000+)"
#10 on the list of "Top 100 cities with shortest commuting times (pop. 50,000+)"
#11 on the list of "Top 101 cities with the largest household incomes disparities (population 50,000+)"
#11 on the list of "Top 101 cities with the most recent year of entry for the foreign-born population (2,000+ people)+"
#12 on the list of "Top 101 cities with the most people having Master's or Doctorate degrees (population 50,000+)"
#14 on the list of "Top 101 cities where the highest percentage of males (15+ years) which never married (with at least 10,000 males in this group)"
#15 on the list of "Top 101 cities with largest percentage of females in industries: accommodation and food services (population 50,000+)"
#19 on the list of "Top 101 cities with largest percentage of workers with very short commute times (9 minutes or less) (population 50,000+)"
#19 on the list of "Top 101 cities with largest percentage of females in industries: educational services (population 50,000+)"
#23 on the list of "Top 101 cities with largest percentage of males in occupations: arts, design, entertainment, sports, and media occupations (population 50,000+)"
#23 on the list of "Top 100 cities with strongest arts, entertainment, recreation, accommodation and food services industries (pop. 50,000+)"
#1 (47406) on the list of "Top 101 zip codes with the lowest 2012 average Adjusted Gross Income (AGI) for individuals (pop 1,000+)"
#1 (47406) on the list of "Top 101 zip codes with the lowest average reported salary/wage in 2012 (pop 1,000+)"
#5 (47406) on the list of "Top 101 zip codes with the largest percentage of returns reporting salary or wage in 2012 (pop 1,000+)"
#5 (47406) on the list of "Top 101 zip codes with the smallest percentage of taxpayers using paid preparers for 2012 taxes (pop 5,000+)"
#25 on the list of "Top 101 counties with the lowest number of births per 1000 residents 2007-2013"
#70 on the list of "Top 101 counties with the lowest percentage of residents relocating from foreign countries between 2010 and 2011"
#78 on the list of "Top 101 counties with highest percentage of residents voting for 3rd party candidates in the 2012 Presidential Election (pop. 50,000+)"
#92 on the list of "Top 101 counties with the highest percentage of residents relocating to other counties in 2011 (pop. 50,000+)"
#99 on the list of "Top 101 counties with the lowest number of deaths per 1000 residents 2007-2013 (pop. 50,000+)"
Top Patent Applicants
Blayne A. Roeder (49)
Cook Medical Technologies Llc (49)
Ram H. Paul, Jr. (43)
Darin G. Schaeffer (39)
Sean D. Chambers (34)
Darin Schaeffer (32)
Thomas A. Osborne (32)
Frank J. Fischer, Jr. (27)
Ram H. Paul (26)
Michael W. Hardert (24)
Total of 1629 patent applications in 2008-2024.


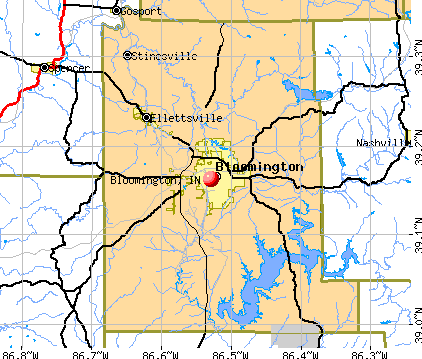


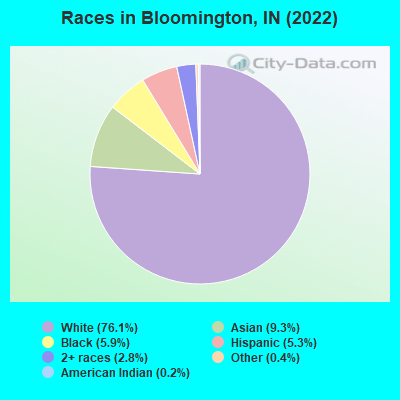
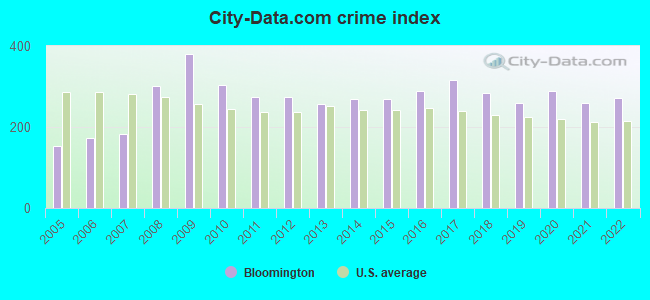
 Recent articles from our blog. Our writers, many of them Ph.D. graduates or candidates, create easy-to-read articles on a wide variety of topics.

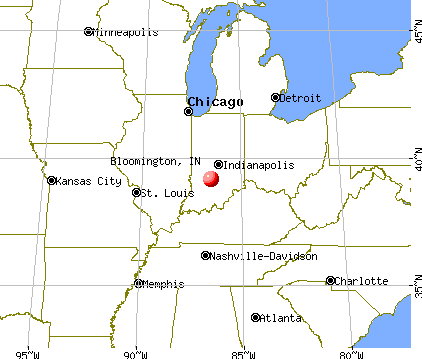
 (48.0 miles
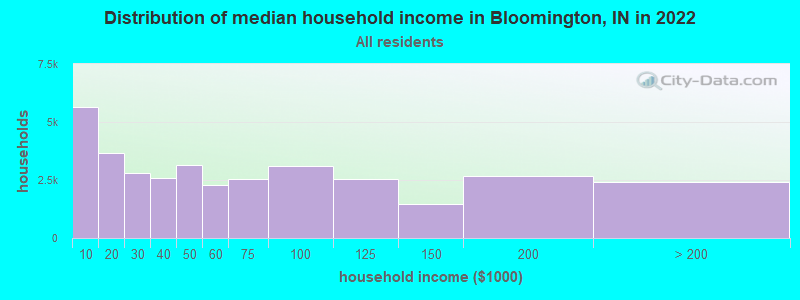
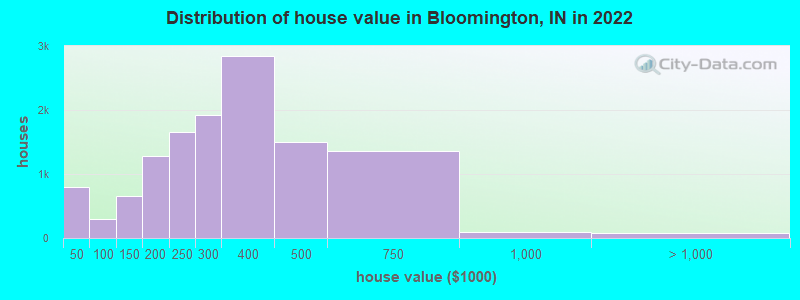
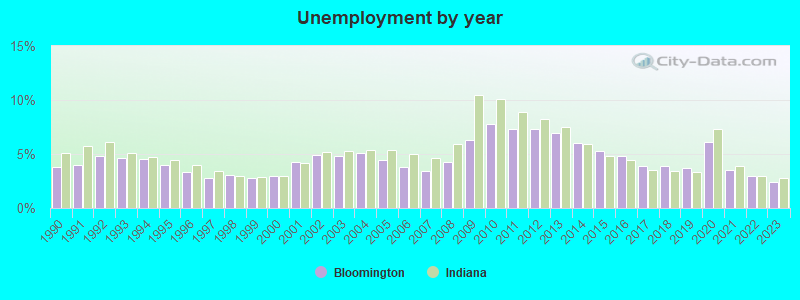
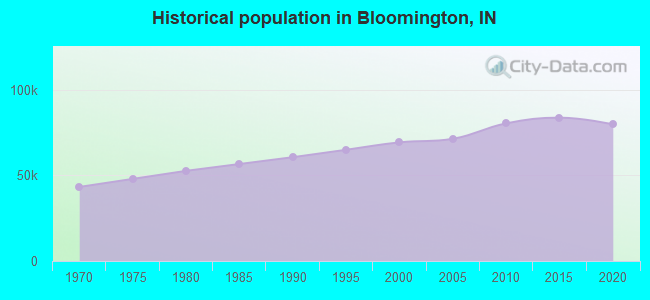
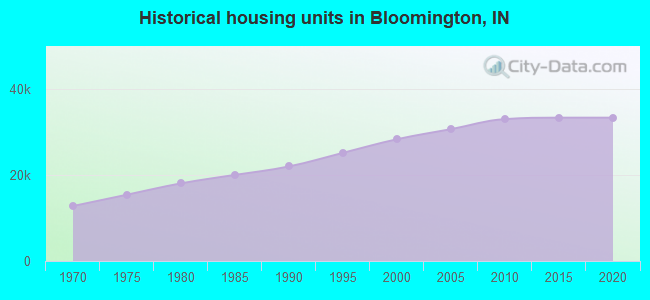
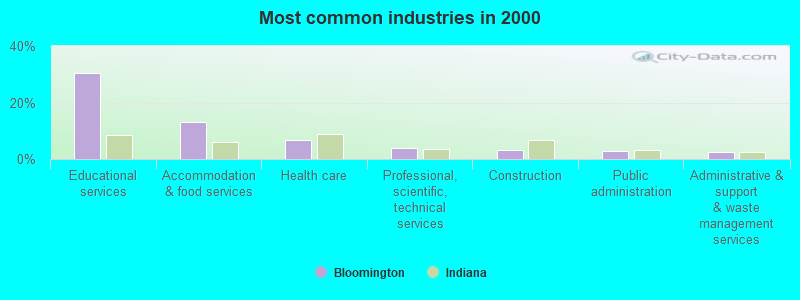
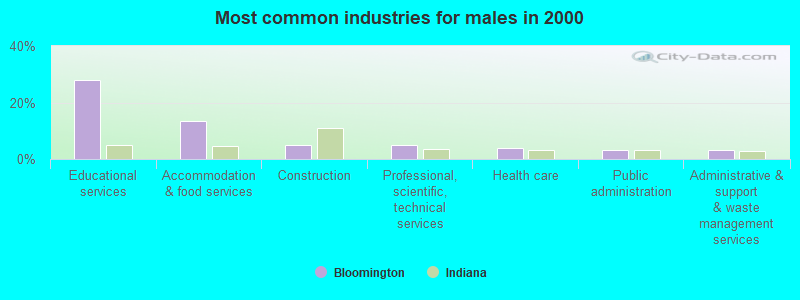
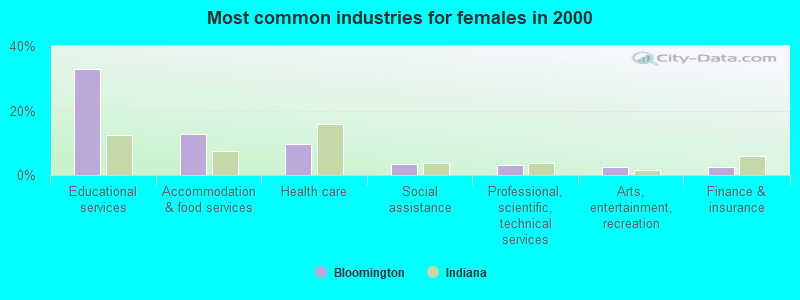
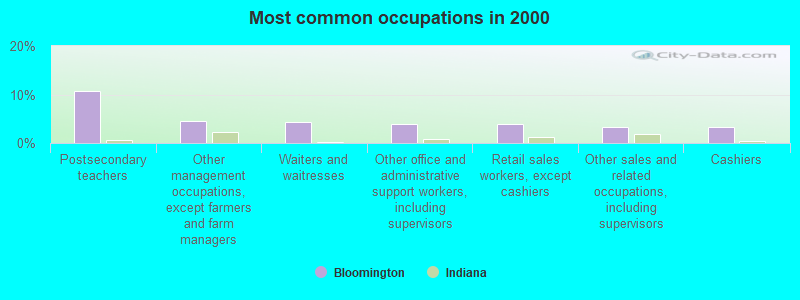
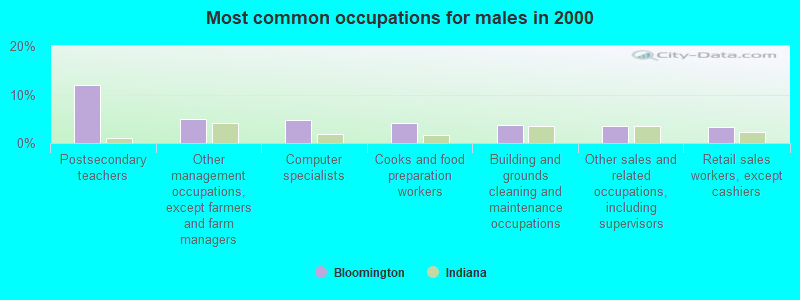
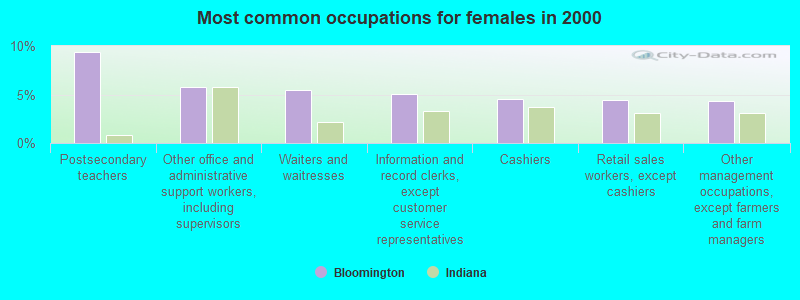
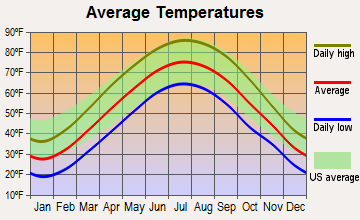
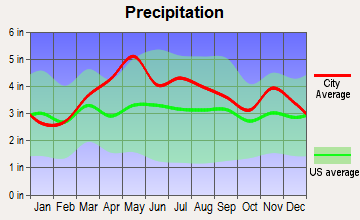
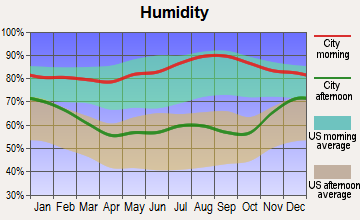
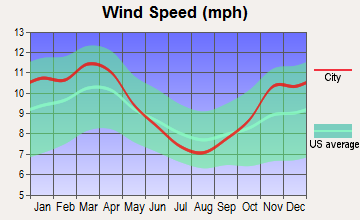
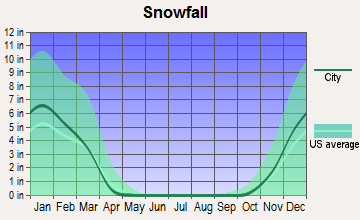
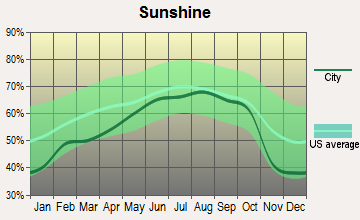
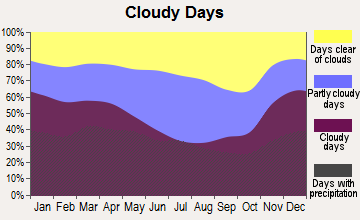
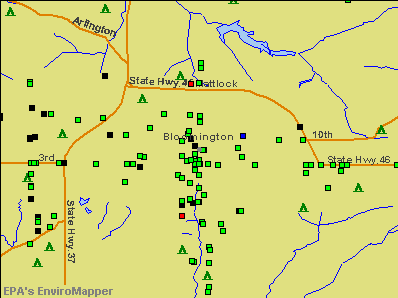

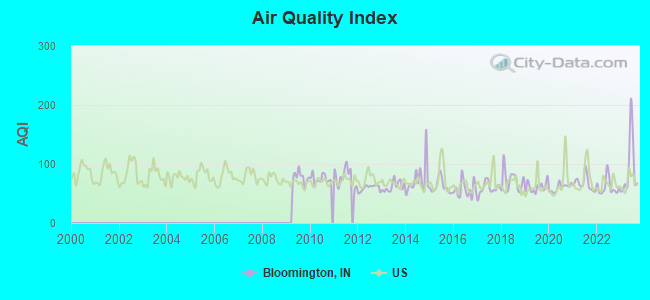
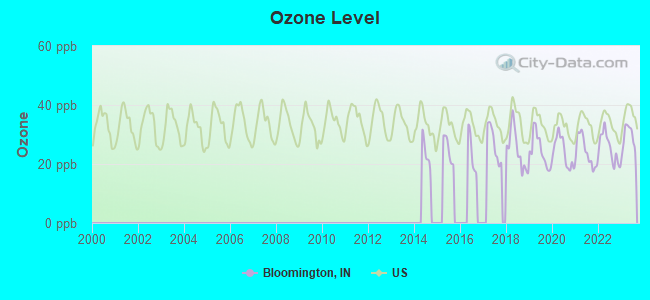
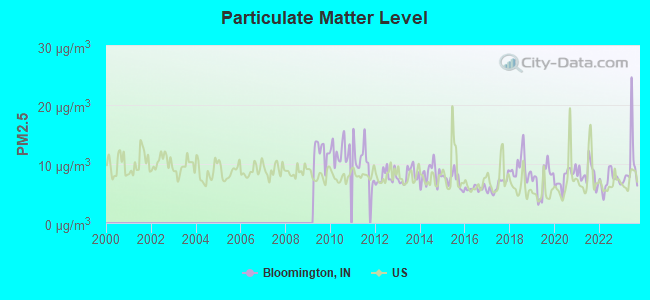
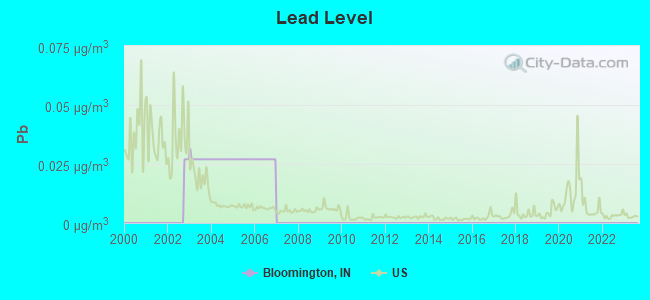
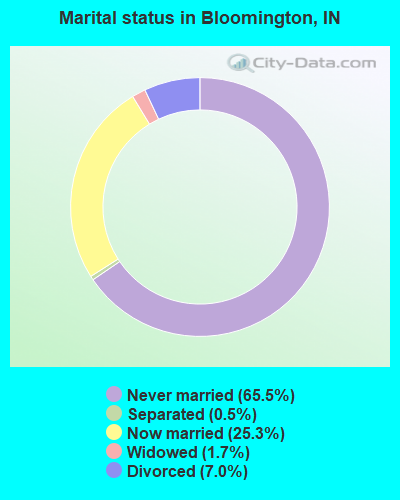
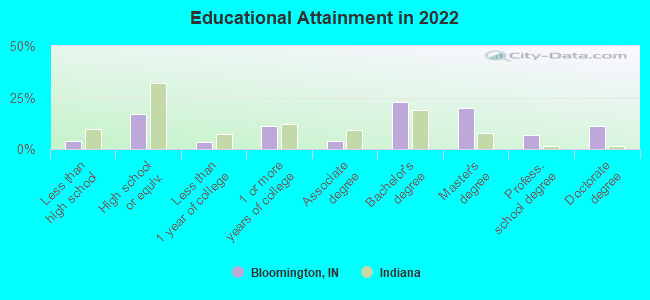
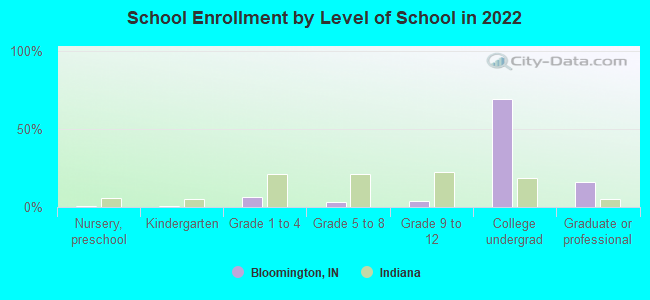
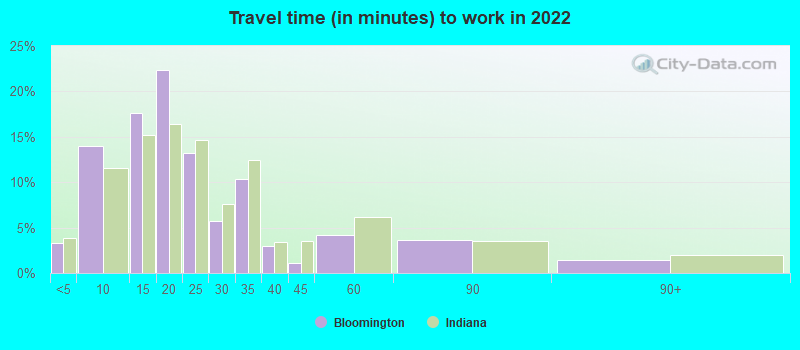
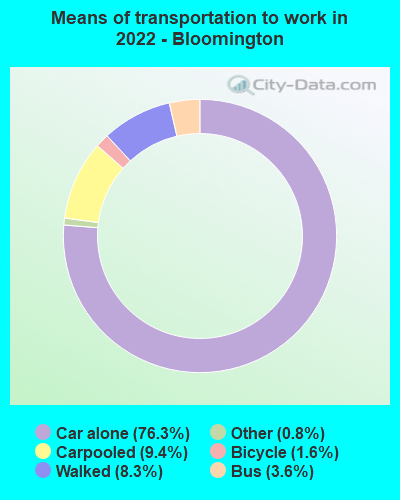
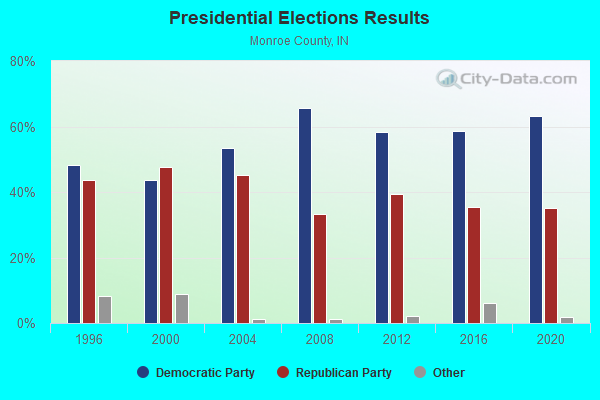
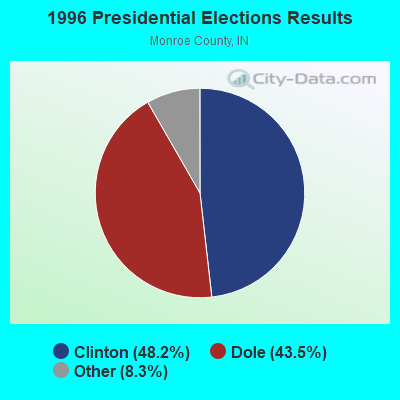
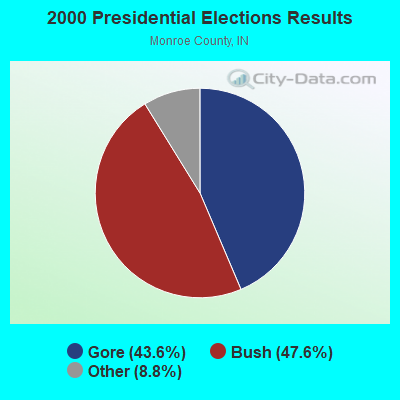
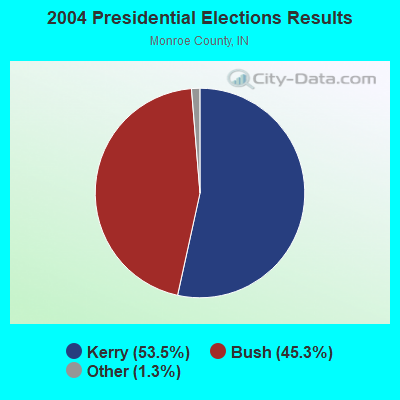
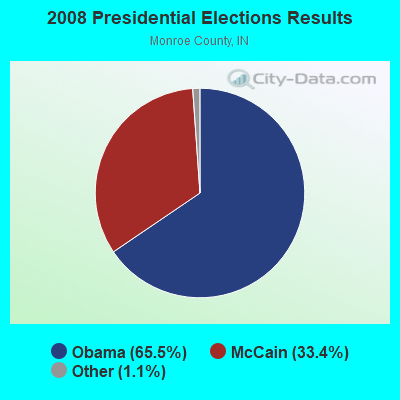
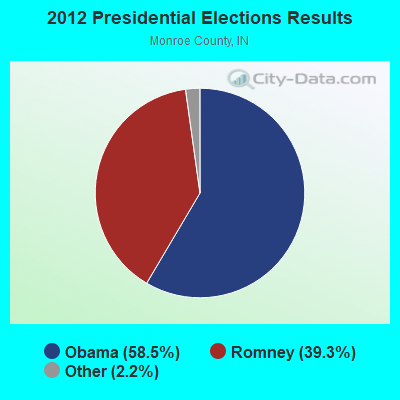
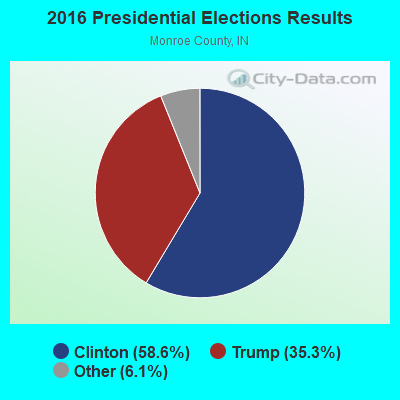
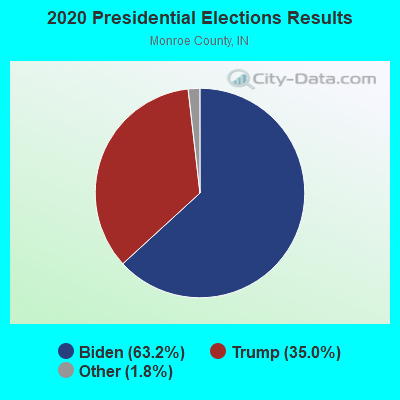
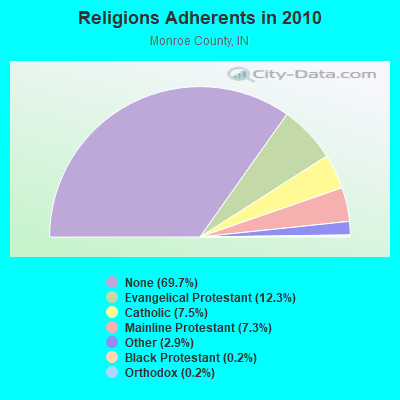
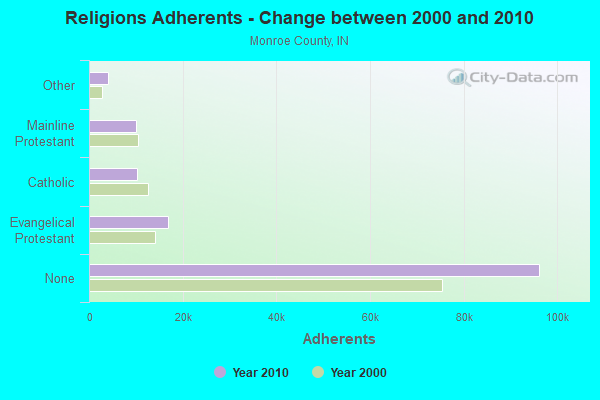
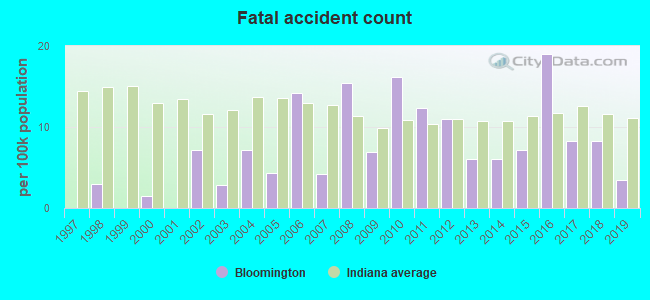
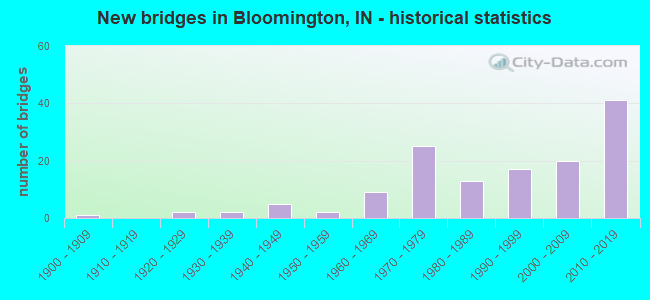
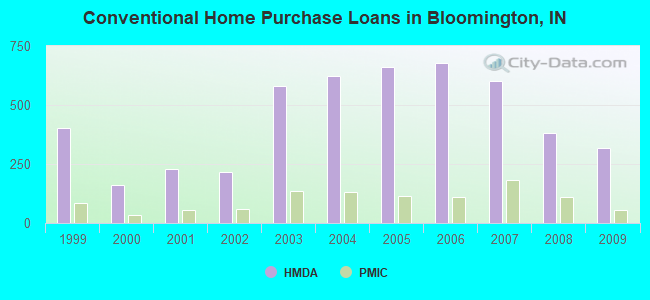
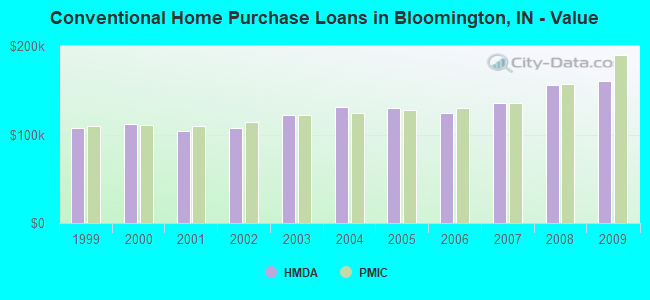
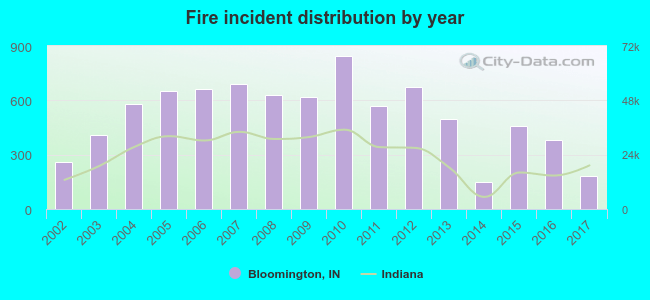 Based on the data from the years 2002 - 2017 the average number of fire incidents per year is 516. The highest number of reported fires - 844 took place in 2010, and the least - 148 in 2014. The data has a decreasing trend.
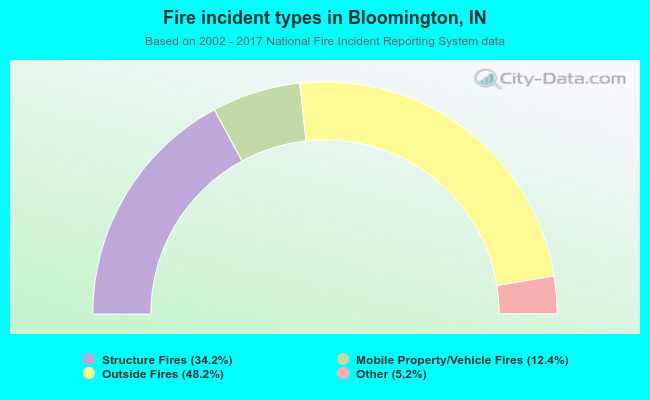 When looking into fire subcategories, the most reports belonged to: Outside Fires (48.2%), and Structure Fires (34.2%).