Estimated zip code population in 2022: 12,954 Zip code population in 2010: 12,852 Zip code population in 2000: 12,320
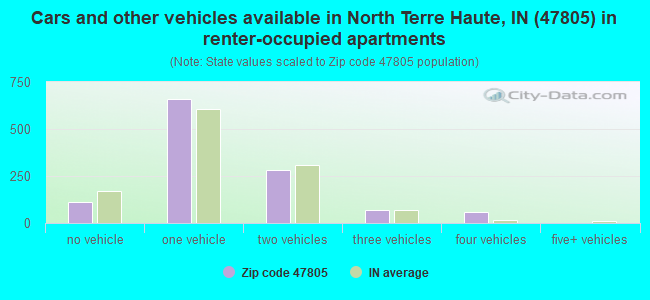
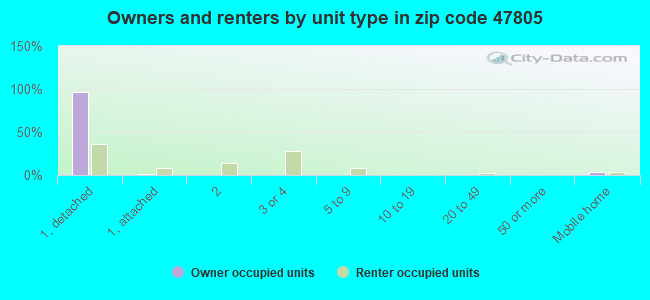
Houses and condos: 5,984 Renter-occupied apartments: 1,181
% of renters here:
21%
State:
29%
March 2022 cost of living index in zip code 47805: 81.9 (low, U.S. average is 100)
Land area: 52.1 sq. mi. Water area: 0.4 sq. mi.
Population density: 248 people per square mile
(very low).
OSM Map
General Map
Google Map
MSN Map
OSM Map
General Map
Google Map
MSN Map
OSM Map
General Map
Google Map
MSN Map
OSM Map
General Map
Google Map
MSN Map
Please wait while loading the map...
Real estate property taxes paid for housing units in 2022:
This zip code:
0.8% ($1,263)
Indiana:
0.7% ($1,467)
Median real estate property taxes paid for housing units with mortgages in 2022: $1,323 (0.7%) Median real estate property taxes paid for housing units with no mortgage in 2022: $1,178 (0.9%)
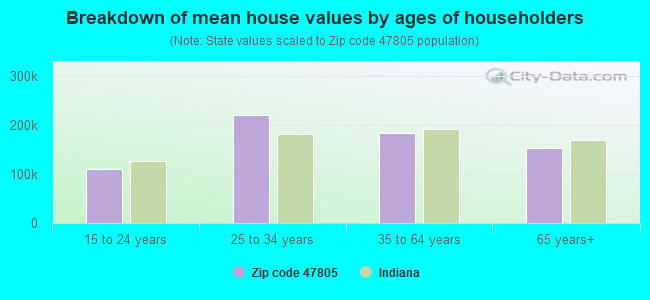
Estimated median house/condo value in 2022: $163,686
47805:
$163,686
Indiana:
$208,700
According to our research of Indiana and other state lists, there was 1 registered sex offender living in 47805 zip code as of April 27, 2024. The ratio of all residents to sex offenders in zip code 47805 is 12,601 to 1. The ratio of registered sex offenders to all residents in this zip code is much lower than the state average.
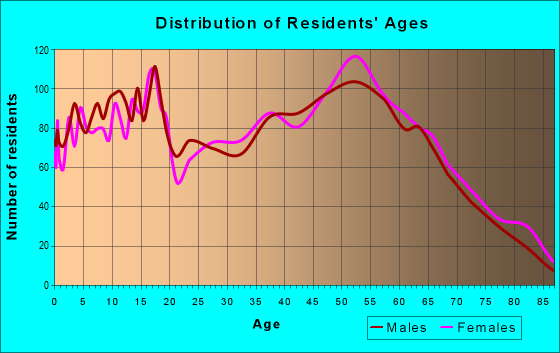
Median resident age:
This zip code:
43.3 years
Indiana median age:
38.2 years
Average household size:
This zip code:
2.3 people
Indiana:
2.4 people
Averages for the 2020 tax year for zip code 47805, filed in 2021:
Average Adjusted Gross Income (AGI) in 2020: $57,591 (Individual Income Tax Returns)
Here:
$57,591
State:
$64,978
Salary/wage: $50,391 (reported on 80.5% of returns)
Here:
$50,391
State:
$55,245
(% of AGI for various income ranges: 1002.3% for AGIs below $25k, 3312.4% for AGIs $25k-50k, 5747.1% for AGIs $50k-75k, 8137.0% for AGIs $75k-100k, 14722.3% for AGIs $100k-200k, 70810.0% for AGIs over 200k)
Taxable interest for individuals: $868 (reported on 25.2% of returns)
This zip code:
$868
Indiana:
$1,351
(% of AGI for various income ranges: 8.5% for AGIs below $25k, 16.9% for AGIs $25k-50k, 18.7% for AGIs $50k-75k, 32.0% for AGIs $75k-100k, 55.7% for AGIs $100k-200k, 1263.3% for AGIs over 200k)
Ordinary dividends: $3,555 (reported on 14.4% of returns)
Here:
$3,555
State:
$5,827
(% of AGI for various income ranges: 17.2% for AGIs below $25k, 17.3% for AGIs $25k-50k, 40.1% for AGIs $50k-75k, 74.1% for AGIs $75k-100k, 116.5% for AGIs $100k-200k, 4423.3% for AGIs over 200k)
Net capital gain/loss in AGI: +$10,862 (reported on 12.5% of returns)
Here:
+$10,862
State:
+$17,730
(% of AGI for various income ranges: 2.5% for AGIs below $25k, 11.8% for AGIs $25k-50k, 40.0% for AGIs $50k-75k, 131.1% for AGIs $75k-100k, 229.5% for AGIs $100k-200k, 20000.0% for AGIs over 200k)
Profit/loss from business: +$9,316 (reported on 9.0% of returns)
Here:
+$9,316
State:
+$12,144
(% of AGI for various income ranges: 43.4% for AGIs below $25k, 89.4% for AGIs $25k-50k, 96.5% for AGIs $50k-75k, 106.3% for AGIs $75k-100k, 222.0% for AGIs $100k-200k, 2773.3% for AGIs over 200k)
Taxable individual retirement arrangement distribution: $16,942 (reported on 11.0% of returns)
47805:
$16,942
Indiana:
$18,302
(% of AGI for various income ranges: 75.9% for AGIs below $25k, 125.7% for AGIs $25k-50k, 236.5% for AGIs $50k-75k, 310.2% for AGIs $75k-100k, 702.3% for AGIs $100k-200k, 3870.0% for AGIs over 200k)
Total itemized deductions: $28,868 (reported on 3.0% of returns)
Here:
$28,868
State:
$35,601
(% of AGI for various income ranges: 68.2% for AGIs $25k-50k, 70.8% for AGIs $50k-75k, 142.0% for AGIs $75k-100k, 360.5% for AGIs $100k-200k, 3880.0% for AGIs over 200k)
Charity contributions: $12,673 (reported on 2.4% of returns)
Here:
$12,673
State:
$15,596
(% of AGI for various income ranges: 17.0% for AGIs $25k-50k, 40.6% for AGIs $75k-100k, 139.7% for AGIs $100k-200k, 2110.0% for AGIs over 200k)
Taxes paid: $6,895 (reported on 3.0% of returns)
47805:
$6,895
State:
$7,542
(% of AGI for various income ranges: 8.3% for AGIs $25k-50k, 14.5% for AGIs $50k-75k, 32.2% for AGIs $75k-100k, 105.0% for AGIs $100k-200k, 970.0% for AGIs over 200k)
Earned income credit: $2,213 (reported on 15.1% of returns)
Here:
$2,213
State:
$2,298
(% of AGI for various income ranges: 80.9% for AGIs below $25k, 61.2% for AGIs $25k-50k)
Percentage of individuals using paid preparers for their 2020 taxes: 96.3%
Here:
96%
State:
94%
(% for various income ranges: 94.6% for AGIs below $25k, 96.6% for AGIs $25k-50k, 96.9% for AGIs $50k-75k, 97.0% for AGIs $75k-100k, 98.8% for AGIs $100k-200k, 100.0% for AGIs over 200k)
Averages for the 2012 tax year for zip code 47805, filed in 2013:
Average Adjusted Gross Income (AGI) in 2012: $48,685 (Individual Income Tax Returns)
Here:
$48,685
State:
$52,932
Salary/wage: $42,731 (reported on 84.0% of returns)
Here:
$42,731
State:
$45,173
(% of AGI for various income ranges: 71.7% for AGIs below $25k, 78.4% for AGIs $25k-50k, 77.4% for AGIs $50k-75k, 79.8% for AGIs $75k-100k, 81.5% for AGIs $100k-200k, 38.8% for AGIs over 200k)
Taxable interest for individuals: $822 (reported on 30.5% of returns)
This zip code:
$822
Indiana:
$1,311
(% of AGI for various income ranges: 1.1% for AGIs below $25k, 0.5% for AGIs $25k-50k, 0.5% for AGIs $50k-75k, 0.5% for AGIs $75k-100k, 0.3% for AGIs $100k-200k, 0.6% for AGIs over 200k)
Ordinary dividends: $2,268 (reported on 15.8% of returns)
Here:
$2,268
State:
$4,690
(% of AGI for various income ranges: 0.8% for AGIs below $25k, 0.6% for AGIs $25k-50k, 0.6% for AGIs $50k-75k, 0.6% for AGIs $75k-100k, 0.7% for AGIs $100k-200k, 1.2% for AGIs over 200k)
Net capital gain/loss in AGI: +$2,406 (reported on 11.0% of returns)
Here:
+$2,406
State:
+$10,406
(% of AGI for various income ranges: 0.2% for AGIs $50k-75k, 0.3% for AGIs $75k-100k, 1.0% for AGIs $100k-200k, 1.8% for AGIs over 200k)
Profit/loss from business: +$8,531 (reported on 9.5% of returns)
Here:
+$8,531
State:
+$11,105
(% of AGI for various income ranges: 3.2% for AGIs below $25k, 1.4% for AGIs $25k-50k, 1.6% for AGIs $50k-75k, 1.1% for AGIs $75k-100k, 2.6% for AGIs $100k-200k)
Taxable individual retirement arrangement distribution: $12,161 (reported on 11.6% of returns)
47805:
$12,161
Indiana:
$13,841
(% of AGI for various income ranges: 3.7% for AGIs below $25k, 2.9% for AGIs $25k-50k, 2.8% for AGIs $50k-75k, 3.3% for AGIs $75k-100k, 3.9% for AGIs $100k-200k)
Total itemized deductions: $19,184 (19% of AGI, reported on 21.3% of returns)
Here:
$19,184
State:
$20,913
Here:
18.7% of AGI
State:
18.2% of AGI
(% of AGI for various income ranges: 3.6% for AGIs below $25k, 6.0% for AGIs $25k-50k, 7.7% for AGIs $50k-75k, 8.7% for AGIs $75k-100k, 10.8% for AGIs $100k-200k, 12.2% for AGIs over 200k)
Charity contributions: $3,901 (reported on 16.1% of returns)
Here:
$3,901
State:
$4,697
(% of AGI for various income ranges: 0.5% for AGIs below $25k, 0.7% for AGIs $25k-50k, 1.1% for AGIs $50k-75k, 1.4% for AGIs $75k-100k, 2.1% for AGIs $100k-200k, 1.4% for AGIs over 200k)
Taxes paid: $6,278 (reported on 21.3% of returns)
47805:
$6,278
State:
$7,456
(% of AGI for various income ranges: 0.6% for AGIs below $25k, 1.3% for AGIs $25k-50k, 2.0% for AGIs $50k-75k, 2.8% for AGIs $75k-100k, 4.2% for AGIs $100k-200k, 5.1% for AGIs over 200k)
Earned income credit: $2,065 (reported on 17.1% of returns)
Here:
$2,065
State:
$2,265
(% of AGI for various income ranges: 5.5% for AGIs below $25k, 1.0% for AGIs $25k-50k)
Percentage of individuals using paid preparers for their 2012 taxes: 65.0%
Here:
65%
State:
53%
(% for various income ranges: 60.8% for AGIs below $25k, 68.6% for AGIs $25k-50k, 68.3% for AGIs $50k-75k, 67.2% for AGIs $75k-100k, 64.2% for AGIs $100k-200k, 85.7% for AGIs over 200k)
Averages for the 2004 tax year for zip code 47805, filed in 2005:
Average Adjusted Gross Income (AGI) in 2004: $40,958 (Individual Income Tax Returns)
Here:
$40,958
State:
$44,790
Salary/wage: $38,346 (reported on 85.8% of returns)
Here:
$38,346
State:
$39,615
(% of AGI for various income ranges: 82.4% for AGIs below $10k, 72.6% for AGIs $10k-25k, 81.5% for AGIs $25k-50k, 85.5% for AGIs $50k-75k, 86.2% for AGIs $75k-100k, 70.7% for AGIs over 100k)
Taxable interest for individuals: $1,254 (reported on 44.4% of returns)
This zip code:
$1,254
Indiana:
$1,535
(% of AGI for various income ranges: 3.1% for AGIs below $10k, 2.5% for AGIs $10k-25k, 1.3% for AGIs $25k-50k, 1.2% for AGIs $50k-75k, 1.0% for AGIs $75k-100k, 1.2% for AGIs over 100k)
Taxable dividends: $1,922 (reported on 21.0% of returns)
Here:
$1,922
State:
$2,998
(% of AGI for various income ranges: 1.5% for AGIs below $10k, 1.1% for AGIs $10k-25k, 0.7% for AGIs $25k-50k, 0.4% for AGIs $50k-75k, 0.6% for AGIs $75k-100k, 2.2% for AGIs over 100k)
Net capital gain/loss: +$3,265 (reported on 15.1% of returns)
Here:
+$3,265
State:
+$8,619
(% of AGI for various income ranges: -0.9% for AGIs below $10k, 0.3% for AGIs $10k-25k, 0.3% for AGIs $25k-50k, 0.5% for AGIs $50k-75k, 0.9% for AGIs $75k-100k, 4.0% for AGIs over 100k)
Profit/loss from business: +$7,036 (reported on 10.5% of returns)
Here:
+$7,036
State:
+$10,071
(% of AGI for various income ranges: 0.8% for AGIs below $10k, 3.0% for AGIs $10k-25k, 1.2% for AGIs $25k-50k, 1.5% for AGIs $50k-75k, 1.2% for AGIs $75k-100k, 3.0% for AGIs over 100k)
IRA payment deduction: $2,787 (reported on 2.3% of returns)
47805:
$2,787
Indiana:
$2,840
(% of AGI for various income ranges: 0.2% for AGIs $10k-25k, 0.2% for AGIs $25k-50k, 0.2% for AGIs $50k-75k, 0.1% for AGIs $75k-100k, 0.1% for AGIs over 100k)
Self-employed pension: $10,292 (reported on 0.4% of returns)
Here:
$10,292
Indiana:
$15,305
Total itemized deductions: $15,231 (20% of AGI, reported on 24.7% of returns)
Here:
$15,231
State:
$17,065
Here:
19.9% of AGI
State:
19.5% of AGI
(% of AGI for various income ranges: 4.0% for AGIs below $10k, 4.6% for AGIs $10k-25k, 7.3% for AGIs $25k-50k, 8.6% for AGIs $50k-75k, 10.6% for AGIs $75k-100k, 13.1% for AGIs over 100k)
Charity contributions deductions: $2,888 (4% of AGI, reported on 20.4% of returns)
Here:
$2,888
State:
$3,550
Here:
3.6% of AGI
State:
3.8% of AGI
(% of AGI for various income ranges: 0.2% for AGIs below $10k, 0.6% for AGIs $10k-25k, 0.9% for AGIs $25k-50k, 1.5% for AGIs $50k-75k, 1.6% for AGIs $75k-100k, 2.3% for AGIs over 100k)
Total tax: $5,244 (reported on 75.1% of returns)
47805:
$5,244
State:
$6,914
(% of AGI for various income ranges: 1.5% for AGIs below $10k, 3.8% for AGIs $10k-25k, 6.6% for AGIs $25k-50k, 8.3% for AGIs $50k-75k, 10.3% for AGIs $75k-100k, 17.2% for AGIs over 100k)
Earned income credit: $1,603 (reported on 14.3% of returns)
Here:
$1,603
State:
$1,685
Percentage of individuals using paid preparers for their 2004 taxes: 63.8%
Here:
64%
State:
59%
(% for various income ranges: 52.4% for AGIs below $10k, 63.3% for AGIs $10k-25k, 69.5% for AGIs $25k-50k, 67.6% for AGIs $50k-75k, 65.2% for AGIs $75k-100k, 69.0% for AGIs over 100k)
Likely homosexual households (counted as self-reported same-sex unmarried-partner households)
Lesbian couples: 0.6% of all households
Gay men: 0.0% of all households
Household received Food Stamps/SNAP in the past 12 months: 486 Household did not receive Food Stamps/SNAP in the past 12 months: 5,222
Women who had a birth in the past 12 months: 99 (69 now married, 29 unmarried) Women who did not have a birth in the past 12 months: 2,212 (1,104 now married, 1,111 unmarried)
Housing units in zip code 47805 with a mortgage: 2,754 (361 second mortgage, 363 both second mortgage and home equity loan) Houses without a mortgage: 170
Median monthly owner costs for units with a mortgage: $1,104 Median monthly owner costs for units without a mortgage: $438
Residents with income below the poverty level in 2022:
This zip code:
13.8%
Whole state:
12.6%
Residents with income below 50% of the poverty level in 2022:
This zip code:
7.6%
Whole state:
6.3%
Median number of rooms in houses and condos:
Here:
6.4
State:
6.6
Median number of rooms in apartments:
Here:
4.0
State:
4.3
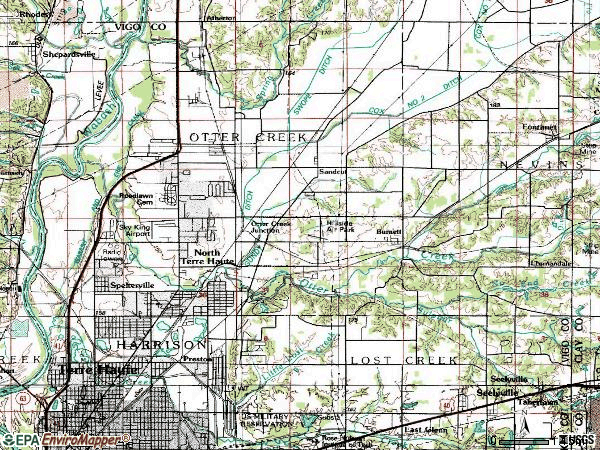
Notable locations in this zip code not listed on our city pages
Notable locations in zip code 47805: Elsworth Station (A), Milton Station (B), Otter Creek Township Fire Department Station 1 North Terre Haute Headquarters (C), Otter Creek Township Fire Department Station 2 Sandcut (D), Otter Creek Township Fire Department Station 3 Burnett (E), Alcan Aluminum Fire Brigade (F). Display/hide their locations on the map
Churches in zip code 47805 include: Friendship Church (A), Christus Victor Church (B), Lost Creek Church (C), Mount Aetna Church (D), Sulphur Spring Church (E). Display/hide their locations on the map
Cemeteries: Moses Cemetery (1), Haven Cemetery (2), Rogers Cemetery (3), Roselawn Memorial Park (4), Kennedy Cemetery (5), Denny Cemetery (6), Wood Cemetery (7). Display/hide their locations on the map
Streams, rivers, and creeks: Sulphur Creek (A), Snake Creek (B), Dive Branch (C), North Branch Otter Creek (D), No End Creek (E), Clago Creek (F). Display/hide their locations on the map
1,427 married couples with children.
570 single-parent households (234 men, 336 women).
97.0% of residents of 47805 zip code speak English at home.
1.2% of residents speak Spanish at home (100% very well).
0.3% of residents speak other Indo-European language at home (100% very well).
0.6% of residents speak Asian or Pacific Island language at home (100% very well).
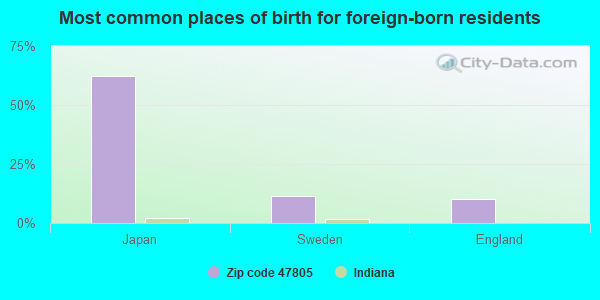
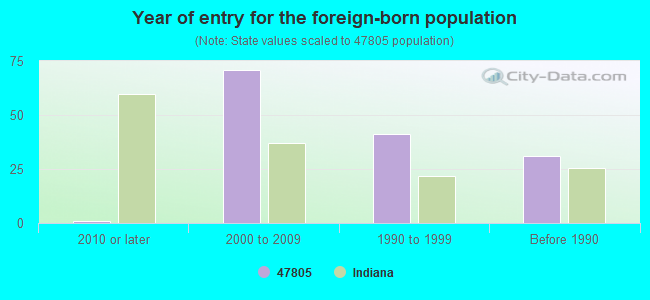
Foreign born population: 87 (0.7%) (14.2% of them are naturalized citizens)
STATE MASTER (Indiana facility tracking) - UST-4765, UNDERGROUND STORAGE TANK PROGRAM, UST-9540, TRANSPORTER (Resource Conservation and Recovery Act (tracking hazardous waste)) (Resource Conservation and Recovery Act (tracking hazardous waste)) Organizations: CORPORATION (CONTACT/OWNER)
, VICTORY DISPOSAL CORP (CONTACT/OWNER)
Alternative names: GIBCO MOTOR EXPRESS INC, GIBSON TRUCKING CO, JAMAX CORPORATION, VICTORY DISPOSAL CORP
AMPACET CORPORATION (3701 N. FRUITRIDGE AVE. in TERRE HAUTE, IN)
AIR MINOR (AIRS/AFS) STATE MASTER (Indiana facility tracking) - CRTK-2742, EPCRA COMPLIANCE ACTIVITY (Tracking inspections of insecticide, fungicide, and rodenticide, and toxic substances) CRITERIA AND HAZARDOUS AIR POLLUTANT INVENTORY (Inventory of air pollution sources) (Resource Conservation and Recovery Act (tracking hazardous waste)) TRI REPORTER (Tracking of toxic chemicals releasing facilities) Business SIC classification: CYCLIC ORGANIC CRUDES AND INTERMEDIATES, AND ORGANIC DYES AND PIGMENTS; CUSTOM COMPOUNDING OF PURCHASED PLASTICS RESINS Organizations: NORMAN ALEXANDER (CONTACT/OWNER)
APPLIED EXTRUSION TECHNOLOGIES (3600 E HEAD RD in TERRE HAUTE, IN)
AIR MINOR (AIRS/AFS) STATE MASTER (Indiana facility tracking) - UST-9941, UNDERGROUND STORAGE TANK PROGRAM, CRTK-401, EPCRA, LUST-199201514, LEAKING STORAGE TANK CRITERIA AND HAZARDOUS AIR POLLUTANT INVENTORY (Inventory of air pollution sources) National Pollutant Discharge Elimination System MAJOR (Tracking pollutant discharge elimination systems) - permit Small Quantity Generators, between 100 kg and 1000 kg of hazardous waste/month (Resource Conservation and Recovery Act (tracking hazardous waste)) TRI REPORTER (Tracking of toxic chemicals releasing facilities) Business SIC classification: UNSUPPORTED PLASTICS FILM AND SHEET Business NAICS classification: PLASTICS PACKAGING FILM AND SHEET (INCLUDING LAMINATED) MANUFACTURING.; UNLAMINATED PLASTICS FILM AND SHEET (EXCEPT PACKAGING) MANUFACTURING. Organizations: LARRY MCCRACKEN 12268 (CONTACT/OPERATOR)
Alternative names: AET PACKAGING FILMS
RIO GRANDE ELEMENTARY SCHOOL (5555 EAST RIO GRAND AVENUE in TERRE HAUTE, IN)
STATE MASTER (Indiana facility tracking) - UST-13296, UNDERGROUND STORAGE TANK PROGRAM (National Center for Education Statistics) - STATE ID-8525 Conditionally Exempt Small Quantity Generators, less than 100 kg/month of hazardous waste (Resource Conservation and Recovery Act (tracking hazardous waste)) - notification Organizations: VIGO CO SCHOOL CORP (CONTACT/OWNER)
, VIGO COUNTY SCHOOL CORP (SCHOOL DISTRICT)
ALCAN ALUMINUM CORP (5901 N 13TH ST in TERRE HAUTE, IN)
AIR MAJOR (AIRS/AFS) STATE MASTER (Indiana facility tracking) - ACES-CP-16700001, AIR PROGRAM, ACES-CP-2386, ACES-ST-16700001A, AIR STACK TESTING, ACES-ST-16700001B, ACES-ST-16700001C, ACES-ST-16700001D, CRTK-10440, EPCRA, CRTK-533, LUST-199001504, LEAKING STORAGE TANK, SPILL-199001504, RELEASE ASSESSMENT, UST-10639, UNDERGROUND STORAGE TANK PROGRAM, VRP-6940403, VOLUNTARY CLEAN UP PROGRAM CRITERIA AND HAZARDOUS AIR POLLUTANT INVENTORY (Inventory of air pollution sources) National Pollutant Discharge Elimination System MAJOR (Tracking pollutant discharge elimination systems) - permit Conditionally Exempt Small Quantity Generators, less than 100 kg/month of hazardous waste (Resource Conservation and Recovery Act (tracking hazardous waste)) - notification TRI REPORTER (Tracking of toxic chemicals releasing facilities) Business SIC and NAICS classification: ALUMINUM SHEET, PLATE, AND FOIL Organizations: MICHAEL JOHNSON CERT 3149 (CONTACT/OPERATOR)
, ALCAN ROLLED PRODUCTS CO (CONTACT/OWNER)
, NOVELIS ALCAN ALUMINUM CO (CONTACT/OWNER)
Alternative names: ALCAN ROLLED PRODS. CO., NOVELIS CORP
PRAIRIE GROUP INC (3905 N 25TH in TERRE HAUTE, IN)
AIR MINOR (AIRS/AFS) STATE MASTER (Indiana facility tracking) - ACES-OP-16700076, AIR PROGRAM CRITERIA AND HAZARDOUS AIR POLLUTANT INVENTORY (Inventory of air pollution sources) Business SIC classification: READY-MIXED CONCRETE Alternative names: PRARIE GROUP INC
GREAT DANE LP (4901 N 13TH ST in TERRE HAUTE, IN)
AIR MAJOR (AIRS/AFS) STATE MASTER (Indiana facility tracking) - ACES-OP-16700011, AIR PROGRAM, SCS-000000014, SUPERFUND, UST-3265, UNDERGROUND STORAGE TANK PROGRAM CRITERIA AND HAZARDOUS AIR POLLUTANT INVENTORY (Inventory of air pollution sources) (Resource Conservation and Recovery Act (tracking hazardous waste)) Business SIC classification: CONSTRUCTION MACHINERY AND EQUIPMENT; TRUCK TRAILERS Alternative names: CASE J I CO, J I CASE
SHELL SERVICE STATION (4633 N 13TH ST in TERRE HAUTE, IN)
STATE MASTER (Indiana facility tracking) - CRTK-3922, EPCRA, UST-12903, UNDERGROUND STORAGE TANK PROGRAM (Resource Conservation and Recovery Act (tracking hazardous waste)) Organizations: SHELL OIL CO (CONTACT/OWNER)
Alternative names: TERRE HAUTE PLT SHELL OIL CO
MCDONALDS RESTAURANT & SERVICE STATION (2633 SR 46 in TERRE HAUTE, IN)
STATE MASTER (Indiana facility tracking) - CRTK-6045, EPCRA, LUST-199208507, LEAKING STORAGE TANK, LUST-199604513, UST-13420, UNDERGROUND STORAGE TANK PROGRAM, UST-13499, (Resource Conservation and Recovery Act (tracking hazardous waste)) Alternative names: SUNOCO SERVICE STATION
ARAMARK UNIFORM SVC INC (3752 N FRUITRIDGE AVE in TERRE HAUTE, IN)
STATE MASTER (Indiana facility tracking) - CRTK-10448, EPCRA, UST-6475, UNDERGROUND STORAGE TANK PROGRAM (Resource Conservation and Recovery Act (tracking hazardous waste)) Alternative names: TODD CORP
OTTER CREEK MIDDLE SCH (4801 N LAFAYETTE ST in TERRE HAUTE, IN)
STATE MASTER (Indiana facility tracking) (National Center for Education Statistics) - STATE ID-8477 Conditionally Exempt Small Quantity Generators, less than 100 kg/month of hazardous waste (Resource Conservation and Recovery Act (tracking hazardous waste)) - notification Organizations: VIGO CO SCHOOL CORP (CONTACT/OWNER)
, VIGO COUNTY SCHOOL CORP (SCHOOL DISTRICT)
SANDCUT GROCERY (8094 ROSEDALE RD in TERRE HAUTE, IN)
STATE MASTER (Indiana facility tracking) - LUST-199305520, LEAKING STORAGE TANK, UST-11037, UNDERGROUND STORAGE TANK PROGRAM (Resource Conservation and Recovery Act (tracking hazardous waste)) Organizations: SAND CUT GROCERY (CONTACT/OWNER)
Alternative names: SAND CUT GROCERY
MC GUIRE EXCAVATING & TRUCKING (3800 N FRUITRIDGE AVE in TERRE HAUTE, IN)
AIR MINOR (AIRS/AFS) STATE MASTER (Indiana facility tracking) - ACES-OP-16700067, AIR PROGRAM Business SIC classification: READY-MIXED CONCRETE Alternative names: MET
Housing units lacking complete plumbing facilities: 1.5% Housing units lacking complete kitchen facilities: 1.6%
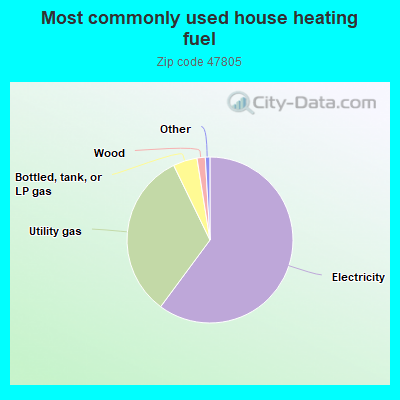
60.2%Electricity
32.7%Utility gas
4.7%Bottled, tank, or LP gas
1.6%Wood
Population in 1990: 13,652.
Place of birth for U.S.-born residents:
This state: 9,978
Northeast: 112
Midwest: 1,596
South: 635
West: 415
62% of the 47805 zip code residents lived in the same house 5 years ago. Out of people who lived in different houses, 67% lived in this county. Out of people who lived in different counties, 50% lived in Indiana.
93% of the 47805 zip code residents lived in the same house 1 year ago. Out of people who lived in different houses, 70% moved from this county. Out of people who lived in different houses, 10% moved from different county within same state. Out of people who lived in different houses, 23% moved from different state.
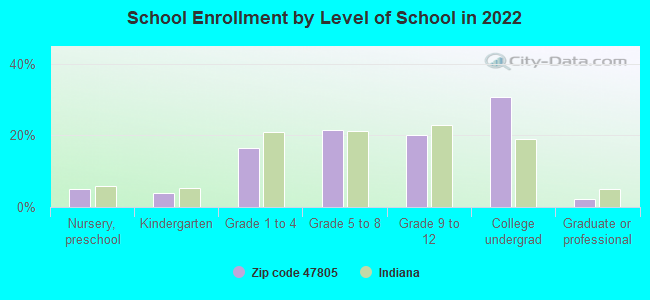
Private vs. public school enrollment:
Students in private schools in grades 1 to 8 (elementary and middle school): 98
Here:
10.2%
Indiana:
14.9%
Students in private schools in grades 9 to 12 (high school): 30
Here:
6.1%
Indiana:
11.4%
Students in private undergraduate colleges: 374
Here:
47.2%
Indiana:
22.3%
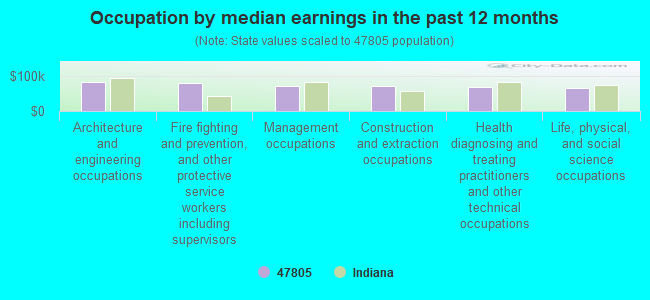
Occupation by median earnings in the past 12 months ($)
84,261Architecture and engineering occupations
80,111Fire fighting and prevention, and other protective service workers including supervisors
72,668Management occupations
70,848Construction and extraction occupations
68,628Health diagnosing and treating practitioners and other technical occupations
65,617Life, physical, and social science occupations
Companies with federal contracts located in this zip code:
SMC INC (6002 N 13TH ST in TERRE HAUTE, IN; small business)
$58,700 with Army for Clean Work Stations, Controlled Environment and Related Equipment. Signed on 2005-04-21. Completion date: 2005-06-19.
Top industries in this zip code by the number of employees in 2005:
2002 - 2018 National Fire Incident Reporting System (NFIRS) incidents
Based on the data from the years 2002 - 2018 the average number of fires per year is 64. The highest number of reported fire incidents - 128 took place in 2006, and the least - 6 in 2013. The data has a decreasing trend.
When looking into fire subcategories, the most incidents belonged to: Structure Fires (50.2%), and Outside Fires (30.2%).
Fire incident types reported to NFIRS in Zip Code 47805


 Nearest zip codes: 47804, 47803, 47874, 47880, 47807, 47809.


 Based on the data from the years 2002 - 2018 the average number of fires per year is 64. The highest number of reported fire incidents - 128 took place in 2006, and the least - 6 in 2013. The data has a decreasing trend.
 When looking into fire subcategories, the most incidents belonged to: Structure Fires (50.2%), and Outside Fires (30.2%).