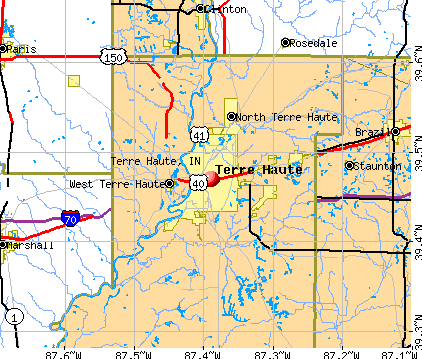
Terre Haute, Indiana

Terre Haute: Autumn at the tracks running through Old Mill Dam
Terre Haute: Fairbanks Park, Terre Haute, Indiana

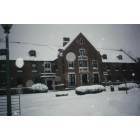
Terre Haute: ISU campus in winter
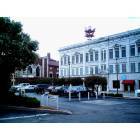
Terre Haute: Downtown Terre Haute

Terre Haute: Hawthorne Park in summer

Terre Haute: Dobbs Park, Terre Haute, Indiana
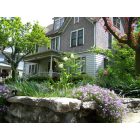
Terre Haute: Historic Homes City of Terre Haute

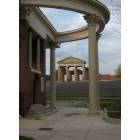
Terre Haute: ISU Fountain

Terre Haute: Historic Neighborhood City of Terre Haute

Terre Haute: A haunting photo of our newly renovated courthouse in downtown Terre Haute...just prior to a thunderstorm at dawn.
Terre Haute: Deming Residence Hall at Rose-Hulman Institute of Technology
- see
16
more - add
your
Submit your own pictures of this city and show them to the world
- OSM Map
- General Map
- Google Map
- MSN Map
Population change since 2000: -2.1%
 |
| Males: 29,082 | |
| Females: 29,253 |
| Median resident age: | 31.8 years |
| Indiana median age: | 38.2 years |
Zip codes: 47804, 47807, 47809.
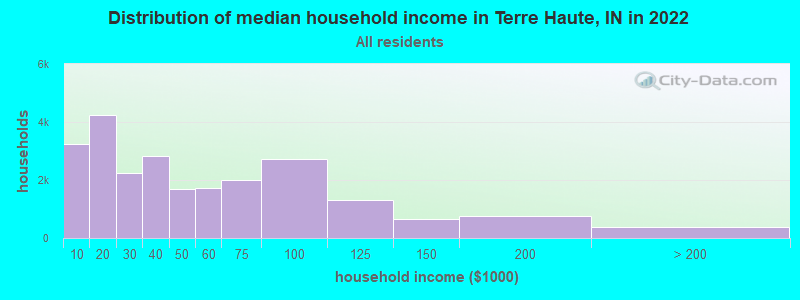
Terre Haute Zip Code Map| Terre Haute: | $39,930 |
| IN: | $66,785 |
Estimated per capita income in 2022: $22,795 (it was $15,728 in 2000)
Terre Haute city income, earnings, and wages data
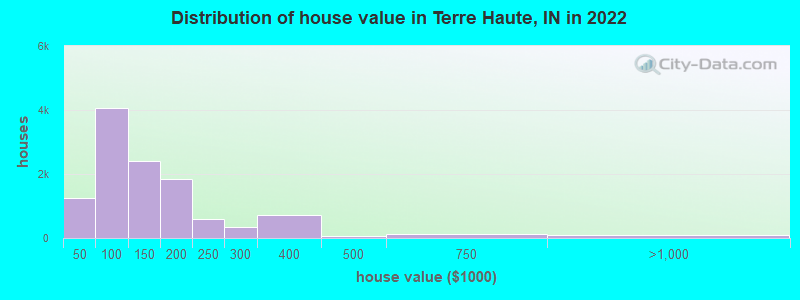
Estimated median house or condo value in 2022: $111,524 (it was $60,100 in 2000)
| Terre Haute: | $111,524 |
| IN: | $208,700 |
Mean prices in 2022: all housing units: $160,135; detached houses: $160,494; townhouses or other attached units: $106,183; in 2-unit structures: $120,869; in 3-to-4-unit structures: $100,581; in 5-or-more-unit structures: $65,418; mobile homes: $183,147
Median gross rent in 2022: $870.
(25.7% for White Non-Hispanic residents, 32.9% for Black residents, 21.4% for Hispanic or Latino residents, 47.1% for American Indian residents, 11.8% for other race residents, 32.3% for two or more races residents)
Detailed information about poverty and poor residents in Terre Haute, IN


Compare current foreclosures in Terre Haute, IN:
| Photo | Address | Area | Beds / Baths | Price | Details |
|---|---|---|---|---|---|

|
#1
N 10th St
Terre Haute, IN 47804
|
1,052 sq. feet
|
1 baths 3 beds |
$118,900
|
show details |

|
#2
Adams Blvd
Terre Haute, IN 47803
|
1,766 sq. feet
|
2 baths 3 beds |
$179,000
|
show details |

|
#3
N 27th St
Terre Haute, IN 47803
|
2,232 sq. feet
|
2 baths 3 beds |
$59,900
|
show details |

|
#4
S 16th St
Terre Haute, IN 47807
|
- sq. feet
|
1 baths 3 beds |
$49,900
|
show details |

|
#5
Eagle St
Terre Haute, IN 47807
|
1,189 sq. feet
|
1 baths 2 beds |
$39,900
|
show details |

|
#6
E Phylbeck Ave
Terre Haute, IN 47805
|
2,028 sq. feet
|
1 baths 3 beds |
show details | |

|
#7
E Springhill Dr
Terre Haute, IN 47802
|
1,260 sq. feet
|
1 baths 3 beds |
show details | |

|
#8
N 13th St
Terre Haute, IN 47804
|
1,609 sq. feet
|
1 baths 3 beds |
show details | |

|
#9
N Woodvale St
Terre Haute, IN 47803
|
1,911 sq. feet
|
2 baths 3 beds |
show details | |

|
#10
E Sandalwood Ave
Terre Haute, IN 47805
|
1,850 sq. feet
|
2 baths 4 beds |
show details |
| Photo | Address | Area | Beds / Baths | Price | Details |
|---|---|---|---|---|---|

|
#11
N 11th St
Terre Haute, IN 47804
|
2,096 sq. feet
|
3 baths - beds |
show details | |

|
#12
S 20th St
Terre Haute, IN 47802
|
1,096 sq. feet
|
2 baths 3 beds |
show details | |

|
#13
N Limberlost Ln
Terre Haute, IN 47803
|
1,473 sq. feet
|
1 baths 3 beds |
show details | |

|
#14
Clay Ave
Terre Haute, IN 47805
|
1,305 sq. feet
|
1 baths 3 beds |
show details | |

|
#15
Spruce St
Terre Haute, IN 47807
|
2,079 sq. feet
|
1 baths 4 beds |
show details | |

|
#16
Clay Ave
Terre Haute, IN 47805
|
1,024 sq. feet
|
1 baths 2 beds |
show details | |

|
#17
1st Ave
Terre Haute, IN 47807
|
1,596 sq. feet
|
1 baths 4 beds |
show details | |

|
#18
S State Road 46
Terre Haute, IN 47802
|
1,670 sq. feet
|
2 baths 4 beds |
show details | |

|
#19
Aikman Pl
Terre Haute, IN 47803
|
800 sq. feet
|
1 baths 2 beds |
show details | |

|
#20
Willkie Rd
Terre Haute, IN 47802
|
1,618 sq. feet
|
2 baths 3 beds |
show details |
| Photo | Address | Area | Beds / Baths | Price | Details |
|---|---|---|---|---|---|

|
#21
E Devonald Ave
Terre Haute, IN 47805
|
1,457 sq. feet
|
2 baths 3 beds |
show details | |

|
#22
N Robertson St
Terre Haute, IN 47805
|
1,404 sq. feet
|
2 baths 3 beds |
show details | |

|
#23
E Woodburn Dr
Terre Haute, IN 47802
|
1,357 sq. feet
|
1 baths 3 beds |
show details | |

|
#24
College Ave
Terre Haute, IN 47803
|
2,222 sq. feet
|
1 baths 3 beds |
show details | |

|
#25
Terre Vista Dr
Terre Haute, IN 47803
|
1,568 sq. feet
|
2 baths 3 beds |
show details | |

|
#26
N 25th St
Terre Haute, IN 47805
|
2,028 sq. feet
|
2 baths 4 beds |
show details | |

|
#27
Fenwood Ave
Terre Haute, IN 47803
|
2,936 sq. feet
|
1 baths 3 beds |
show details | |

|
#28
Cox Rd
Terre Haute, IN 47802
|
1,715 sq. feet
|
1 baths 3 beds |
show details | |

|
#29
Washington Ave
Terre Haute, IN 47803
|
1,302 sq. feet
|
1 baths 2 beds |
show details | |

|
#30
E Chandler Ave
Terre Haute, IN 47803
|
1,012 sq. feet
|
1 baths 2 beds |
show details |
| Photo | Address | Area | Beds / Baths | Price | Details |
|---|---|---|---|---|---|

|
#31
N 11th St
Terre Haute, IN 47804
|
2,748 sq. feet
|
2 baths 4 beds |
show details | |

|
#32
S 27th St
Terre Haute, IN 47803
|
925 sq. feet
|
1 baths 2 beds |
show details | |

|
#33
Wabash Ave
Terre Haute, IN 47803
|
1,869 sq. feet
|
2 baths 3 beds |
show details | |

|
#34
4th Ave
Terre Haute, IN 47807
|
1,554 sq. feet
|
2 baths 3 beds |
show details | |

|
#35
S 22nd St
Terre Haute, IN 47803
|
2,068 sq. feet
|
1 baths 3 beds |
show details | |

|
#36
S 18th St
Terre Haute, IN 47803
|
1,122 sq. feet
|
1 baths 2 beds |
show details | |

|
#37
Kings Ct
Terre Haute, IN 47802
|
1,212 sq. feet
|
2 baths 3 beds |
show details | |

|
#38
E Broadlands Ave
Terre Haute, IN 47805
|
1,232 sq. feet
|
1 baths 2 beds |
show details | |

|
#39
Linden St
Terre Haute, IN 47804
|
1,438 sq. feet
|
1 baths 3 beds |
show details | |

|
#40
8th Ave
Terre Haute, IN 47804
|
2,142 sq. feet
|
1 baths 2 beds |
show details |
| Photo | Address | Area | Beds / Baths | Price | Details |
|---|---|---|---|---|---|

|
#41
S 8th St
Terre Haute, IN 47802
|
1,824 sq. feet
|
1 baths 3 beds |
show details | |

|
#42
Cruft St
Terre Haute, IN 47803
|
1,728 sq. feet
|
1 baths 4 beds |
show details | |

|
#43
S 23rd St
Terre Haute, IN 47803
|
1,246 sq. feet
|
1 baths 2 beds |
show details | |

|
#44
W Evans Dr
Terre Haute, IN 47802
|
1,680 sq. feet
|
2 baths 3 beds |
show details | |

|
#45
2nd Ave
Terre Haute, IN 47807
|
1,372 sq. feet
|
1 baths 3 beds |
show details | |

|
#46
8th Ave
Terre Haute, IN 47804
|
1,147 sq. feet
|
1 baths 2 beds |
show details | |

|
#47
S Belmar Pl
Terre Haute, IN 47802
|
1,608 sq. feet
|
2 baths 3 beds |
show details | |

|
#48
Clay Ave
Terre Haute, IN 47805
|
1,624 sq. feet
|
1 baths 3 beds |
show details | |

|
#49
S 18th St
Terre Haute, IN 47803
|
1,152 sq. feet
|
1 baths 2 beds |
show details | |

|
Check over 1 million property listings on Foreclosure.com!
|
browse all offers | |||


- 45,89077.8%White alone
- 6,33910.7%Black alone
- 2,6414.5%Two or more races
- 2,3584.0%Hispanic
- 1,4172.4%Asian alone
- 2150.4%Other race alone
- 1040.2%American Indian alone
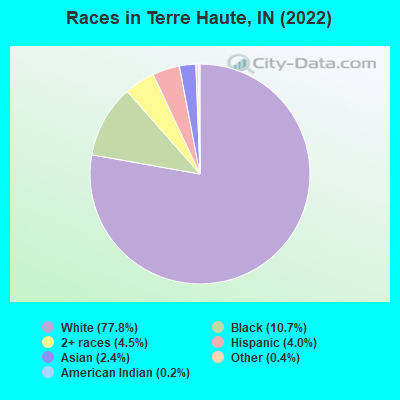
Races in Terre Haute detailed stats: ancestries, foreign born residents, place of birth
According to our research of Indiana and other state lists, there were 20 registered sex offenders living in Terre Haute, Indiana as of April 27, 2024.
The ratio of all residents to sex offenders in Terre Haute is 3,046 to 1.
The ratio of registered sex offenders to all residents in this city is much lower than the state average.
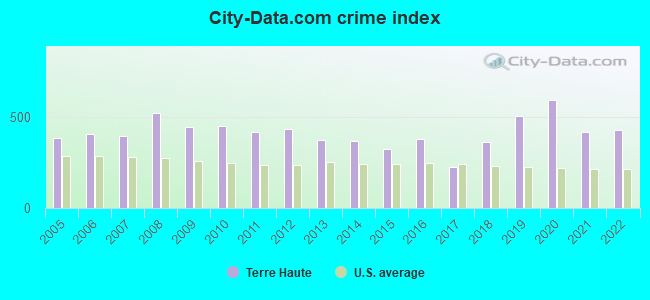
The City-Data.com crime index weighs serious crimes and violent crimes more heavily. Higher means more crime, U.S. average is 246.1. It adjusts for the number of visitors and daily workers commuting into cities.
- means the value is smaller than the state average.- means the value is about the same as the state average.
- means the value is bigger than the state average.
- means the value is much bigger than the state average.
Crime rate in Terre Haute detailed stats: murders, rapes, robberies, assaults, burglaries, thefts, arson
Full-time law enforcement employees in 2020, including police officers: 141 (132 officers - 129 male; 3 female).
| Officers per 1,000 residents here: | 2.18 |
| Indiana average: | 2.12 |
 Recent articles from our blog. Our writers, many of them Ph.D. graduates or candidates, create easy-to-read articles on a wide variety of topics.

 | How do Terre Haute and Bloomington compare? (4 replies) |
| Ranking Indy's mid sized satellite cities: Terre Haute, Lafayette, Kokomo, Marion, Muncie, Anderson, Richmond (49 replies) |
| Paris, IL or Terre Haute? (10 replies) |
| Terre Haute area (1 reply) |
| College tour and place to stay? (9 replies) |
| Why is Indiana considered " backwards " ? (135 replies) |
Latest news from Terre Haute, IN collected exclusively by city-data.com from local newspapers, TV, and radio stations
Ancestries: American (15.4%), German (11.4%), English (10.8%), Irish (8.0%), European (2.5%), Italian (2.0%).
Current Local Time: EST time zone
Incorporated on 01/26/1832
Elevation: 501 feet
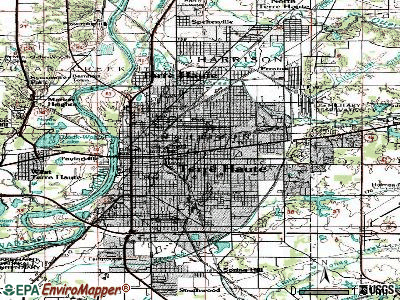
Land area: 31.2 square miles.
Population density: 1,867 people per square mile (low).
2,482 residents are foreign born (1.9% Asia, 0.8% Latin America, 0.6% Europe).
| This city: | 4.2% |
| Indiana: | 5.6% |
Median real estate property taxes paid for housing units with mortgages in 2022: $1,182 (0.9%)
Median real estate property taxes paid for housing units with no mortgage in 2022: $803 (0.9%)
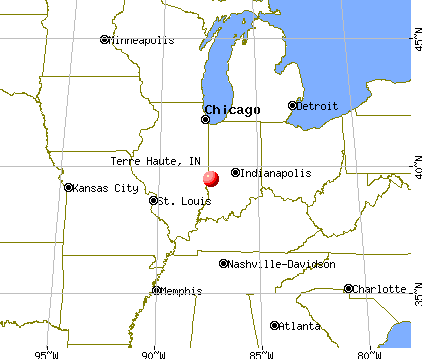
Nearest city with pop. 200,000+: Indianapolis, IN  (69.8 miles , pop. 781,870).
Nearest city with pop. 1,000,000+: Chicago, IL (164.7 miles , pop. 2,896,016).
Nearest cities:
), ), ), Latitude: 39.47 N, Longitude: 87.39 W
Daytime population change due to commuting: +18,534 (+31.7%)
Workers who live and work in this city: 15,650 (68.6%)
Area code: 812
Terre Haute tourist attractions:
Terre Haute, Indiana accommodation & food services, waste management - Economy and Business Data
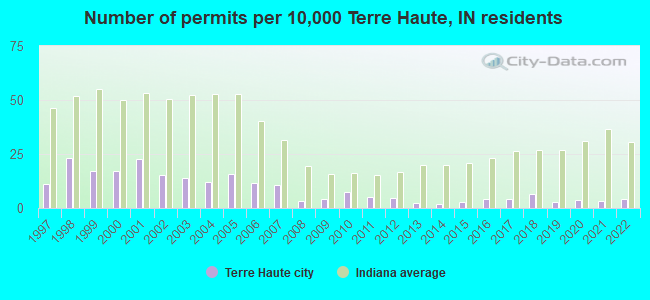
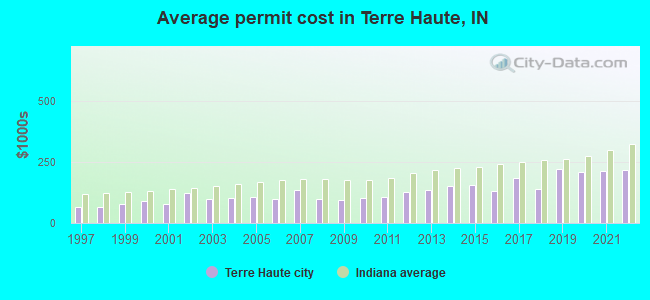
Single-family new house construction building permits:
- 2022: 24 buildings, average cost: $218,900
- 2021: 19 buildings, average cost: $213,600
- 2020: 22 buildings, average cost: $210,800
- 2019: 17 buildings, average cost: $221,800
- 2018: 39 buildings, average cost: $141,400
- 2017: 25 buildings, average cost: $186,400
- 2016: 25 buildings, average cost: $133,300
- 2015: 16 buildings, average cost: $157,500
- 2014: 11 buildings, average cost: $150,600
- 2013: 14 buildings, average cost: $135,100
- 2012: 27 buildings, average cost: $127,800
- 2011: 31 buildings, average cost: $105,000
- 2010: 44 buildings, average cost: $101,700
- 2009: 26 buildings, average cost: $95,100
- 2008: 18 buildings, average cost: $99,700
- 2007: 63 buildings, average cost: $135,700
- 2006: 69 buildings, average cost: $97,500
- 2005: 94 buildings, average cost: $107,000
- 2004: 71 buildings, average cost: $101,000
- 2003: 84 buildings, average cost: $97,500
- 2002: 91 buildings, average cost: $123,500
- 2001: 135 buildings, average cost: $79,900
- 2000: 103 buildings, average cost: $89,900
- 1999: 101 buildings, average cost: $77,400
- 1998: 138 buildings, average cost: $65,700
- 1997: 65 buildings, average cost: $63,800
| Here: | 3.4% |
| Indiana: | 2.8% |
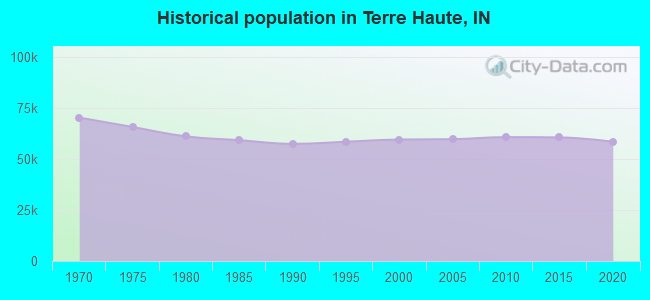
Population change in the 1990s: +2,169 (+3.8%).
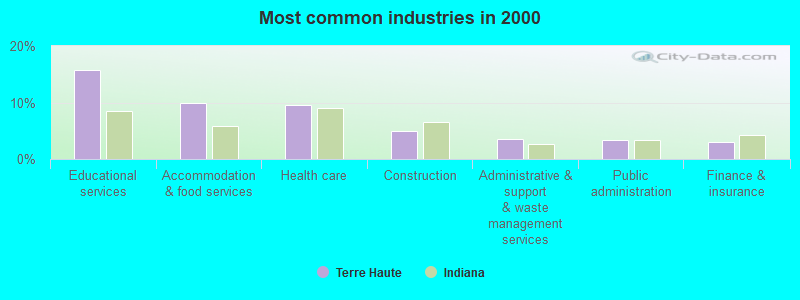
- Educational services (15.8%)
- Accommodation & food services (9.8%)
- Health care (9.6%)
- Construction (4.9%)
- Administrative & support & waste management services (3.5%)
- Public administration (3.3%)
- Finance & insurance (3.0%)
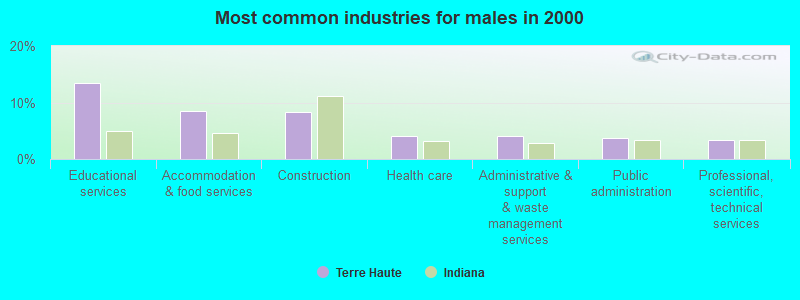
- Educational services (13.5%)
- Accommodation & food services (8.6%)
- Construction (8.3%)
- Health care (4.1%)
- Administrative & support & waste management services (4.1%)
- Public administration (3.8%)
- Professional, scientific, technical services (3.4%)

- Educational services (18.3%)
- Health care (15.5%)
- Accommodation & food services (11.2%)
- Department & other general merchandise stores (3.9%)
- Social assistance (3.8%)
- Finance & insurance (3.7%)
- Administrative & support & waste management services (2.9%)
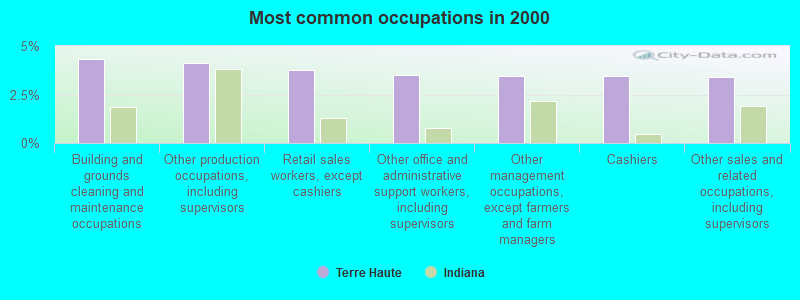
- Building and grounds cleaning and maintenance occupations (4.3%)
- Other production occupations, including supervisors (4.1%)
- Retail sales workers, except cashiers (3.8%)
- Other office and administrative support workers, including supervisors (3.5%)
- Other management occupations, except farmers and farm managers (3.5%)
- Cashiers (3.4%)
- Other sales and related occupations, including supervisors (3.4%)
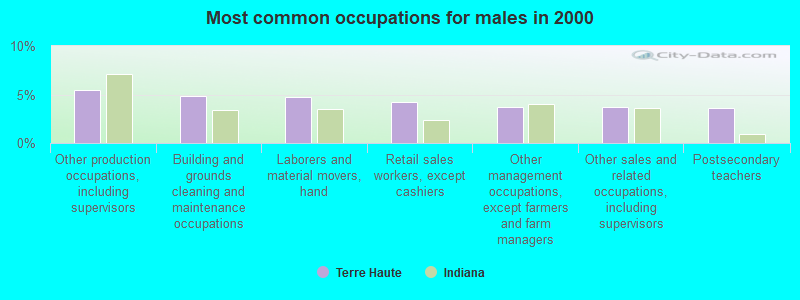
- Other production occupations, including supervisors (5.4%)
- Building and grounds cleaning and maintenance occupations (4.9%)
- Laborers and material movers, hand (4.8%)
- Retail sales workers, except cashiers (4.2%)
- Other management occupations, except farmers and farm managers (3.7%)
- Other sales and related occupations, including supervisors (3.7%)
- Postsecondary teachers (3.6%)
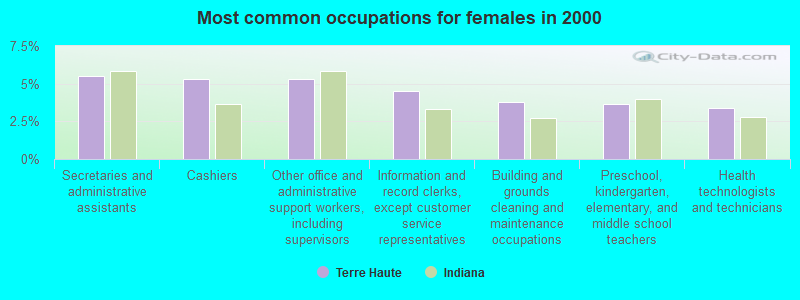
- Secretaries and administrative assistants (5.5%)
- Cashiers (5.3%)
- Other office and administrative support workers, including supervisors (5.3%)
- Information and record clerks, except customer service representatives (4.5%)
- Building and grounds cleaning and maintenance occupations (3.8%)
- Preschool, kindergarten, elementary, and middle school teachers (3.6%)
- Health technologists and technicians (3.4%)
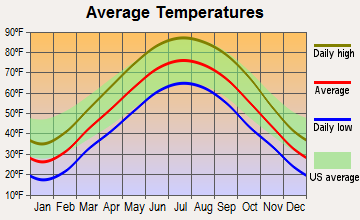
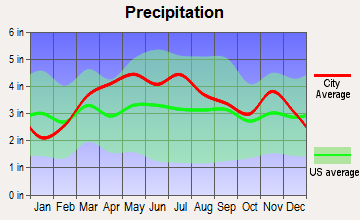
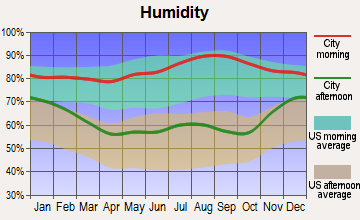
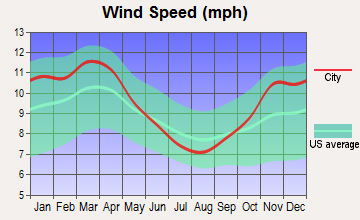
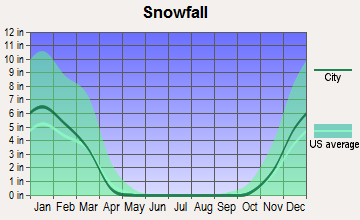
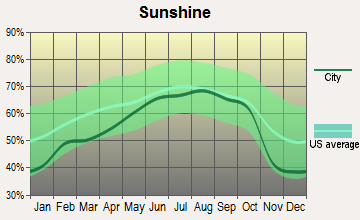
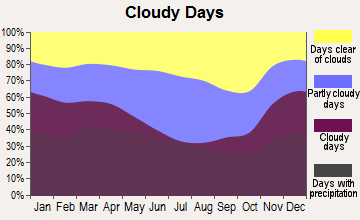
Average climate in Terre Haute, Indiana
Based on data reported by over 4,000 weather stations
|
|


(lower is better)
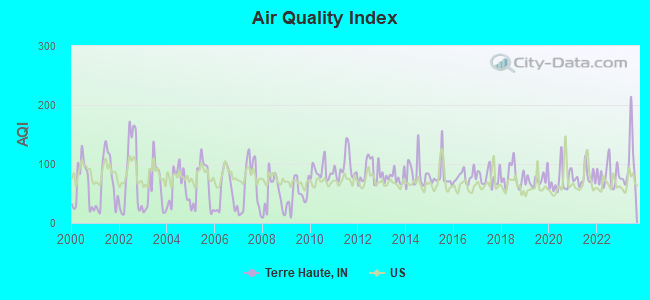
Air Quality Index (AQI) level in 2023 was 101. This is worse than average.
| City: | 101 |
| U.S.: | 73 |
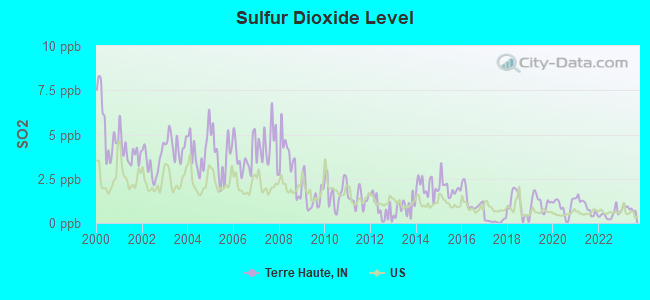
Sulfur Dioxide (SO2) [ppb] level in 2023 was 0.819. This is significantly better than average. Closest monitor was 1.0 miles away from the city center.
| City: | 0.819 |
| U.S.: | 1.515 |
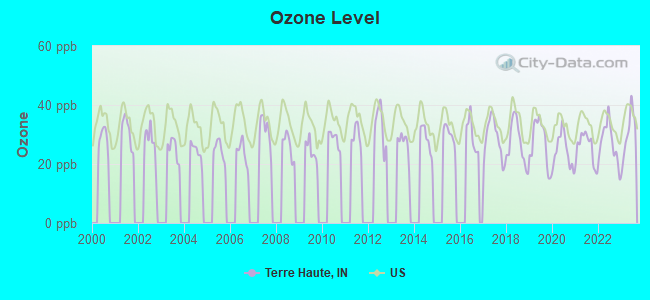
Ozone [ppb] level in 2023 was 30.3. This is about average. Closest monitor was 1.3 miles away from the city center.
| City: | 30.3 |
| U.S.: | 33.3 |
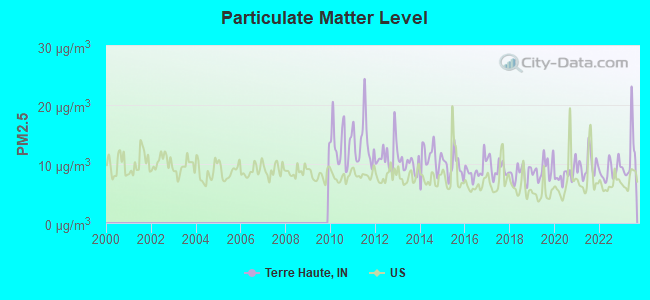
Particulate Matter (PM2.5) [µg/m3] level in 2023 was 11.4. This is worse than average. Closest monitor was 1.3 miles away from the city center.
| City: | 11.4 |
| U.S.: | 8.1 |
Tornado activity:
Terre Haute-area historical tornado activity is near Indiana state average. It is 72% greater than the overall U.S. average.
On 6/22/1960, a category F3 (max. wind speeds 158-206 mph) tornado 4.7 miles away from the Terre Haute city center caused between $50,000 and $500,000 in damages.
On 4/29/1963, a category F3 tornado 12.2 miles away from the city center caused between $50,000 and $500,000 in damages.
Earthquake activity:
Terre Haute-area historical earthquake activity is significantly above Indiana state average. It is 137% greater than the overall U.S. average.On 4/18/2008 at 09:36:59, a magnitude 5.4 (5.1 MB, 4.8 MS, 5.4 MW, 5.2 MW, Class: Moderate, Intensity: VI - VII) earthquake occurred 75.3 miles away from the city center
On 6/10/1987 at 23:48:54, a magnitude 5.1 (4.9 MB, 4.4 MS, 4.6 MS, 5.1 LG) earthquake occurred 52.1 miles away from Terre Haute center
On 4/18/2008 at 09:36:59, a magnitude 5.2 (5.2 MW, Depth: 8.9 mi) earthquake occurred 75.3 miles away from Terre Haute center
On 6/18/2002 at 17:37:15, a magnitude 5.0 (4.3 MB, 4.6 MW, 5.0 LG) earthquake occurred 104.7 miles away from the city center
On 4/18/2008 at 15:14:16, a magnitude 4.8 (4.5 MB, 4.8 MW, 4.6 MW, Class: Light, Intensity: IV - V) earthquake occurred 73.0 miles away from the city center
On 4/3/1974 at 23:05:02, a magnitude 4.7 (4.5 MB, 4.7 LG) earthquake occurred 71.5 miles away from the city center
Magnitude types: regional Lg-wave magnitude (LG), body-wave magnitude (MB), surface-wave magnitude (MS), moment magnitude (MW)
Natural disasters:
The number of natural disasters in Vigo County (14) is near the US average (15).Major Disasters (Presidential) Declared: 10
Emergencies Declared: 3
Causes of natural disasters: Floods: 8, Storms: 7, Tornadoes: 3, Winter Storms: 3, Snowstorms: 2, Blizzard: 1, Hurricane: 1, Other: 1 (Note: some incidents may be assigned to more than one category).
Main business address for: FIRST FINANCIAL CORP /IN/ (STATE COMMERCIAL BANKS).
Hospitals in Terre Haute:
- CHARTER TERRE HAUTE BEHAV HELTH SYSTEM (1400 CROSSING BOULEVARD)
- HAMILTON CENTER INC (620 8TH AVE)
- HOSPICE OF THE WABASH VALLEY INC (400 8TH AVENUE)
- MOSAIC (7933 E CHANDLER AVE)
- NORMAL LIFE OF INDIANA (2304 CRUFT AVE)
- NORMAL LIFE OF INDIANA (4500 REDWOOD DR)
- SOUTHERNCARE TERRE HAUTE (4624 S SPRINGHILL JUNCTION RD)
- TERRE HAUTE REGIONAL HOSPITAL (Proprietary, 3901 S SEVENTH ST)
- UNION HOSPITAL INC (Voluntary non-profit - Other, 1606 N SEVENTH ST)
- VISTACARE (3401 SOUTH 4TH STREET)
Airports and heliports located in Terre Haute:
- Terre Haute International-Hulman Field Airport (HUF) (Runways: 3, Commercial Ops: 91, Air Taxi Ops: 698, Itinerant Ops: 15,700, Local Ops: 19,200, Military Ops: 576)
- Sky King Airport (3I3) (Runways: 2, Air Taxi Ops: 826, Itinerant Ops: 3,240, Local Ops: 14,560)
- Union Hospital Heliport (60II)
Colleges/Universities in Terre Haute:
- Indiana State University (Full-time enrollment: 10,925; Location: 210 N 7th St; Public; Website: www.indstate.edu; Offers Doctor's degree)
- Rose-Hulman Institute of Technology (Full-time enrollment: 2,123; Location: 5500 Wabash Avenue; Private, not-for-profit; Website: www.rose-hulman.edu; Offers Master's degree)
- J Michael Harrold Beauty Academy (Full-time enrollment: 104; Location: 2232 Wabash Ave; Private, for-profit; Website: harroldbeautyacademy.com)
Other colleges/universities with over 2000 students near Terre Haute:
- DePauw University (about 31 miles; Greencastle, IN; Full-time enrollment: 2,360)
- Eastern Illinois University (about 42 miles; Charleston, IL; FT enrollment: 9,414)
- Danville Area Community College (about 47 miles; Danville, IL; FT enrollment: 2,229)
- Indiana University-Bloomington (about 51 miles; Bloomington, IN; FT enrollment: 39,039)
- Lake Land College (about 53 miles; Mattoon, IL; FT enrollment: 7,499)
- Vincennes University (about 55 miles; Vincennes, IN; FT enrollment: 9,876)
- University of Illinois at Urbana-Champaign (about 63 miles; Champaign, IL; FT enrollment: 47,528)
Public high schools in Terre Haute:
- TERRE HAUTE NORTH VIGO HIGH SCH (Students: 2,134, Location: 3434 MAPLE AVE, Grades: 9-12)
- TERRE HAUTE SOUTH VIGO HIGH SCH (Students: 1,921, Location: 3737 S 7TH ST, Grades: 9-12)
- MCLEAN EDUCATION CENTER (ALT) (Students: 202, Location: 961 LAFAYETTE AVE, Grades: 6-12)
- BOOKER T WASHINGTON ALT SCH (Students: 114, Location: 3707 S 7TH ST, Grades: 9-12)
- COVERED BRIDGE SPEC ED DIST (Location: 1320 WALNUT ST, Grades: PK-12)
Private high schools in Terre Haute:
- BIBLE BAPTIST ACADEMY (Students: 71, Location: 2500 MARGARET AVE, Grades: PK-12)
- HOLY CROSS SCHOOL (Students: 61, Location: 6401 S US HIGHWAY 41, Grades: UG-11)
- TERRE HAUTE ADVENTIST SCHOOL (Students: 16, Location: PARK ST, Grades: KG-9)
Biggest public elementary/middle schools in Terre Haute:
- HONEY CREEK MIDDLE SCH (Students: 822, Location: 6601 S CARLISLE ST, Grades: 6-8)
- WOODROW WILSON MIDDLE SCH (Students: 760, Location: 301 S 25TH ST, Grades: 6-8)
- OTTER CREEK MIDDLE SCH (Students: 748, Location: 4801 N LAFAYETTE ST, Grades: 6-8)
- TERRE TOWN ELEMENTARY SCHOOL (Students: 653, Location: 2121 BOSTON AVE, Grades: PK-5)
- LOST CREEK ELEMENTARY SCHOOL (Students: 635, Location: 6701 WABASH AVE, Grades: PK-5)
- RIO GRANDE ELEMENTARY SCHOOL (Students: 618, Location: 5555 E RIO GRANDE AV, Grades: PK-5)
- DIXIE BEE ELEMENTARY SCHOOL (Students: 557, Location: 1655 E JESSICA DR, Grades: KG-5)
- SARAH SCOTT MIDDLE SCH (Students: 505, Location: 1000 GRANT ST, Grades: 6-8)
- SUGAR GROVE ELEMENTARY SCHOOL (Students: 453, Location: 2800 WALLACE AVE, Grades: KG-5)
- FARRINGTON GROVE ELEM SCH (Students: 447, Location: 1826 S 6TH ST, Grades: KG-5)
Private elementary/middle schools in Terre Haute:
- ST PATRICK ELEMENTARY SCHOOL (Students: 292, Location: 449 S 19TH ST, Grades: PK-8)
- CROSS T PREPARATORY & HEAVEN'S EXPRESS (Students: 61, Location: 2929 N 7TH ST, Grades: PK-6)
- COMMUNITY CHRISTIAN SCHOOL (Students: 55, Location: 2000 N 13TH ST, Grades: PK-5)
- GRACE BAPTIST CHURCH/SCHOOL (Students: 2, Location: 1209 N 19TH ST, Grades: 4-7)
Library in Terre Haute:
User-submitted facts and corrections:
- Ivy Tech State College has changed to Ivy Tech Community College of Indiana.
- We have McLean Alternative School and its high school range
- Gibault School for Boys is now named Gibault Inc. and they house girls also it has been this way since 2000 I worked there.
Points of interest:
Notable locations in Terre Haute: Fort Harrison Country Club (A), Rea Park Golf Course (B), Terre Haute Federal Penitentiary (C), Phoenix Country Club (D), Terre Haute Fire Department Station 5 (E), Torner House (F), Terre Haute International Airport - Hulman Field Fire Station (G), Terre Haute Fire Department Station 7 (H), Terre Haute Fire Department Station 11 (I), Terre Haute Fire Department Station 9 (J), Terre Haute Fire Department Station 2 (K), Terre Haute Fire Department Station 3 (L), Terre Haute Fire Department Station 6 (M), Terre Haute Fire Department Station 8 (N), Bunch Nurseries (O). Display/hide their locations on the map
Shopping Center: Honey Creek Square Shopping Center (1). Display/hide its location on the map
Main business address in Terre Haute: FIRST FINANCIAL CORP /IN/ (A). Display/hide its location on the map
Church in Terre Haute: Union Church (A). Display/hide its location on the map
Cemeteries: Mewhinney Cemetery (1), Rogers Cemetery (2), Highland Lawn Cemetery (3), Hobmeyer Cemetery (4), Grandview Cemetery (5), Woodlawn Cemetery (6), Calvary Cemetery (7). Display/hide their locations on the map
Lakes and reservoirs: Malone Pond (A), Crystal Lake (B), Thompson Lake (C), Hulman Street Reservoir (D). Display/hide their locations on the map
Parks in Terre Haute include: Sheridan Park (1), Fairbanks Park (2), Collett Park (3), Memorial Park (4), Spencer Park (5), Vorrhees Park (6). Display/hide their locations on the map
Tourist attractions: Candles (Museums; 30 North 7th Street) (1), DEBS Eugene V Museum (451 North 8th Street) (2), Dial-A-Story (Cultural Attractions- Events- & Facilities; 1 Library Square) (3), Bonham Amusements (Amusement & Theme Parks; 3103 North 14th 1/2 Street) (4), Lektron Inc (Amusement & Theme Parks; 1319 Wabash Avenue) (5), Huff Amusements (Amusement & Theme Parks; 1468 Lafayette Avenue) (6), Time Out (Amusement & Theme Parks; US41 & I 70) (7), Museum VIGO County Historical Society (1411 South 6th Street) (8), Native American Museum (5170 East Poplar Drive) (9). Display/hide their approximate locations on the map
Hotels: Statesman Inn (1407 North 3rd Street) (1), Comfort Suites Terre Haute (501 East Margaret Avenue) (2), Holiday Inn (3300 South US Highway 41) (3), Drury Inn Terre Haute (3040 South US Highway 41) (4), Best Western Inn (3325 South US Highway 41) (5), Signature Inn (3053 S US Highway 41) (6), Pear Tree Inn by Drury (3050 South U.S. Hwy 41) (7), Knights Inn (401 East Margaret Drive) (8), Days Inn of Terre Haute (555 South 3rd Street) (9). Display/hide their approximate locations on the map
Court: Federal Bureau Of Investigation (FBI) (202 Federal Building) (1). Display/hide its approximate location on the map
Birthplace of: Paul Dresser - Musician, Philip José Farmer - Novelist, Theodore Dreiser - Novelist, Abe Silverstein - Aerospace engineer, Art Nehf - Baseball player, Bill Thompson (voice actor) - Voice actor, Charles G. Abrell - Marine Corps Medal of Honor recipient, Claude Thornhill - Pianist, Edward Wilkerson - Bandleader, Max Carey - Baseball player and coach.
Drinking water stations with addresses in Terre Haute and their reported violations in the past:
FCI & FPC - TERRE HAUTE (Population served: 1,580, Groundwater):Past monitoring violations:NORTH TERRE HAUTE CHRISTIAN CHURCH (Population served: 130, Groundwater):
- 21 regular monitoring violations
Past monitoring violations:PARK AVENUE DINER (Population served: 56, Groundwater):
- 4 routine major monitoring violations
- One regular monitoring violation
Past monitoring violations:J & T WATER COMPANY (Population served: 50, Groundwater):
- Monitoring, Repeat Major (TCR) - Between OCT-2008 and DEC-2008, Contaminant: Coliform (TCR). Follow-up actions: St Public Notif requested (JAN-26-2009), St Violation/Reminder Notice (JAN-26-2009), St Compliance achieved (JUL-25-2012)
- Monitoring, Repeat Major (TCR) - In JUL-2008, Contaminant: Coliform (TCR). Follow-up actions: St Public Notif requested (JUL-09-2008), St Violation/Reminder Notice (JUL-09-2008), St Compliance achieved (JUL-25-2012)
- One routine major monitoring violation
- One regular monitoring violation
Past health violations:NORTH SIDE CHRISTIAN CHURCH (Population served: 50, Groundwater):Past monitoring violations:
- MCL, Monthly (TCR) - In MAY-2014, Contaminant: Coliform. Follow-up actions: St Violation/Reminder Notice (JUN-04-2014), St Public Notif requested (JUN-04-2014), St Boil Water Order (JUN-04-2014)
- MCL, Monthly (TCR) - In JUN-2011, Contaminant: Coliform. Follow-up actions: St Boil Water Order (JUL-01-2011), St Violation/Reminder Notice (JUL-01-2011), St Public Notif requested (JUL-01-2011), St Compliance achieved (FEB-28-2012), St Public Notif received (DEC-11-2012)
- Monitoring, Source Water (GWR) - In JUN-14-2014, Contaminant: E. COLI. Follow-up actions: St Violation/Reminder Notice (JUN-23-2014), St Public Notif requested (JUN-23-2014)
- 3 routine major monitoring violations
- One regular monitoring violation
Past health violations:MORRIS MOBILE HOME ESTATES (Population served: 40, Groundwater):
- MCL, Monthly (TCR) - In JUN-2006, Contaminant: Coliform. Follow-up actions: St Public Notif requested (JUL-11-2006), St Violation/Reminder Notice (JUL-11-2006), St Compliance achieved (OCT-26-2009)
Past health violations:RAGGEDY ANN CHILD CARE AND PRESCHOOL (Population served: 28, Groundwater):Past monitoring violations:
- MCL, Monthly (TCR) - In FEB-2008, Contaminant: Coliform. Follow-up actions: St Public Notif requested (FEB-28-2008), St Violation/Reminder Notice (FEB-28-2008), St Boil Water Order (FEB-28-2008), St Compliance achieved (MAY-17-2010)
- MCL, Monthly (TCR) - In OCT-2006, Contaminant: Coliform. Follow-up actions: St Public Notif requested (NOV-14-2006), St Violation/Reminder Notice (NOV-14-2006), St Public Notif received (2 times from NOV-24-2006 to JUN-26-2007), St Compliance achieved (MAY-17-2010)
- Follow-up Or Routine LCR Tap M/R - In OCT-01-2012, Contaminant: Lead and Copper Rule. Follow-up actions: St Public Notif requested (DEC-18-2012), St Violation/Reminder Notice (DEC-18-2012), St Public Notif received (DEC-28-2012), St Compliance achieved (NOV-21-2013)
- Monitoring, Repeat Major (TCR) - In OCT-2006, Contaminant: Coliform (TCR). Follow-up actions: St Public Notif requested (NOV-14-2006), St Violation/Reminder Notice (NOV-14-2006), St Compliance achieved (MAY-17-2010)
- 21 regular monitoring violations
Past monitoring violations:SCHEID DIESEL (Population served: 27, Groundwater):
- 4 routine major monitoring violations
Past health violations:Past monitoring violations:
- MCL, Monthly (TCR) - In JUL-2009, Contaminant: Coliform. Follow-up actions: St Boil Water Order (JUL-27-2009), St Violation/Reminder Notice (JUL-27-2009), St Public Notif requested (JUL-27-2009), St Public Notif received (AUG-05-2009), St AO (w/penalty) issued (AUG-21-2009), St Compliance achieved (MAY-17-2010)
- 4 routine major monitoring violations
Drinking water stations with addresses in Terre Haute that have no violations reported:
- RIO GRANDE BAPTIST CHURCH (Population served: 50, Primary Water Source Type: Groundwater)
| This city: | 2.3 people |
| Indiana: | 2.5 people |
| This city: | 55.8% |
| Whole state: | 66.9% |
| This city: | 9.1% |
| Whole state: | 6.9% |
Likely homosexual households (counted as self-reported same-sex unmarried-partner households)
- Lesbian couples: 0.5% of all households
- Gay men: 0.3% of all households
People in group quarters in Terre Haute in 2010:
- 4,312 people in college/university student housing
- 3,260 people in federal prisons
- 589 people in nursing facilities/skilled-nursing facilities
- 309 people in local jails and other municipal confinement facilities
- 194 people in other noninstitutional facilities
- 89 people in emergency and transitional shelters (with sleeping facilities) for people experiencing homelessness
- 61 people in group homes intended for adults
- 46 people in workers' group living quarters and job corps centers
- 10 people in group homes for juveniles (non-correctional)
- 5 people in residential treatment centers for juveniles (non-correctional)
People in group quarters in Terre Haute in 2000:
- 4,182 people in college dormitories (includes college quarters off campus)
- 1,764 people in federal prisons and detention centers
- 674 people in nursing homes
- 236 people in other noninstitutional group quarters
- 210 people in hospitals/wards and hospices for chronically ill
- 171 people in local jails and other confinement facilities (including police lockups)
- 146 people in other hospitals or wards for chronically ill
- 89 people in homes or halfway houses for drug/alcohol abuse
- 64 people in military hospitals or wards for chronically ill
- 26 people in mental (psychiatric) hospitals or wards
- 21 people in orthopedic wards and institutions for the physically handicapped
- 10 people in other group homes
- 8 people in homes for the mentally retarded
- 7 people in homes for abused, dependent, and neglected children
- 3 people in religious group quarters
Banks with most branches in Terre Haute (2011 data):
- First Financial Bank, National Association: 10 branches. Info updated 2012/01/04: Bank assets: $2,852.7 mil, Deposits: $2,227.7 mil, local headquarters, positive income, Commercial Lending Specialization, 66 total offices, Holding Company: First Financial Corporation
- Terre Haute Savings Bank: Us Highway 41 Branch, Westminster Branch, North Banking Center Branch, Riley Branch, at 533 Ohio Street, Poplar Street Branch. Info updated 2006/11/03: Bank assets: $294.4 mil, Deposits: $226.9 mil, local headquarters, positive income, Commercial Lending Specialization, 7 total offices, Holding Company: Terre Haute Savings Mhc, Inc.
- Fifth Third Bank: Honey Creek Commons Banking Center, Plaza North Branch, Meadows Branch, Terre Haute Main Branch. Info updated 2009/10/05: Bank assets: $114,540.4 mil, Deposits: $89,689.1 mil, headquarters in Cincinnati, OH, positive income, Commercial Lending Specialization, 1378 total offices, Holding Company: Fifth Third Bancorp
- Old National Bank: Northside Financial Center Branch, Poplar East Branch, Merchants Financial Center, Terre Haute Branch. Info updated 2011/08/01: Bank assets: $8,467.9 mil, Deposits: $6,653.1 mil, headquarters in Evansville, IN, positive income, 195 total offices, Holding Company: Old National Bancorp
- Woodforest National Bank: Terra Wal-Mart Branch at 2399 S State Road 46, branch established on 2007/06/08; Terre Haute Indiana Branch at 5555 South Us Highway #41, branch established on 2007/09/29. Info updated 2011/05/10: Bank assets: $3,488.9 mil, Deposits: $3,097.6 mil, headquarters in Houston, TX, positive income, Commercial Lending Specialization, 766 total offices, Holding Company: Woodforest Financial Group Employee Stock Ownership Plan (With 401(K) Provisions)
- Regions Bank: Terre Haute Branch at 126 South 3rd Street, branch established on 1998/04/13. Info updated 2011/02/24: Bank assets: $123,368.2 mil, Deposits: $98,301.3 mil, headquarters in Birmingham, AL, positive income, Commercial Lending Specialization, 1778 total offices, Holding Company: Regions Financial Corporation
- BMO Harris Bank National Association: Terre Haute Branch at 3497 South U.S. Highway 41, branch established on 1985/11/01. Info updated 2011/07/14: Bank assets: $97,264.0 mil, Deposits: $75,624.6 mil, headquarters in Chicago, IL, positive income, 717 total offices, Holding Company: Bank Of Montreal
- The Citizens National Bank of Paris: Terre Haute Branch at 315 Davis Avenue, branch established on 2009/06/30. Info updated 2008/01/29: Bank assets: $211.1 mil, Deposits: $169.8 mil, headquarters in Paris, IL, negative income in the last year, Agricultural Specialization, 4 total offices, Holding Company: First Citizens Of Paris, Inc.
- The Riddell National Bank: Sycamore Terrace Branch at 2129 South State Road 46, branch established on 2008/06/09. Info updated 2006/11/03: Bank assets: $175.4 mil, Deposits: $149.4 mil, headquarters in Brazil, IN, positive income, 4 total offices, Holding Company: Rnb Corp.
For population 15 years and over in Terre Haute:
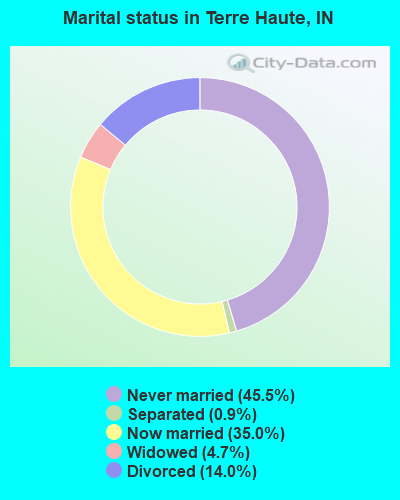
- Never married: 45.5%
- Now married: 35.0%
- Separated: 0.9%
- Widowed: 4.7%
- Divorced: 14.0%
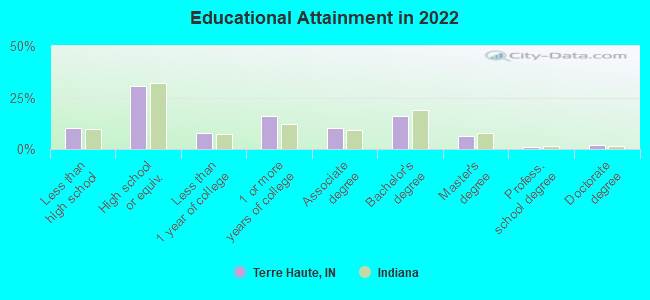
For population 25 years and over in Terre Haute:
- High school or higher: 88.6%
- Bachelor's degree or higher: 23.1%
- Graduate or professional degree: 8.9%
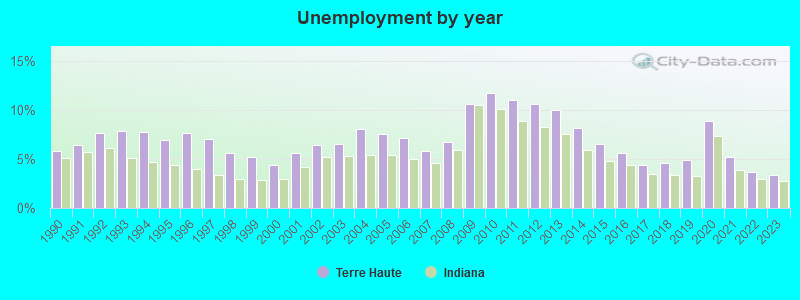
- Unemployed: 8.3%
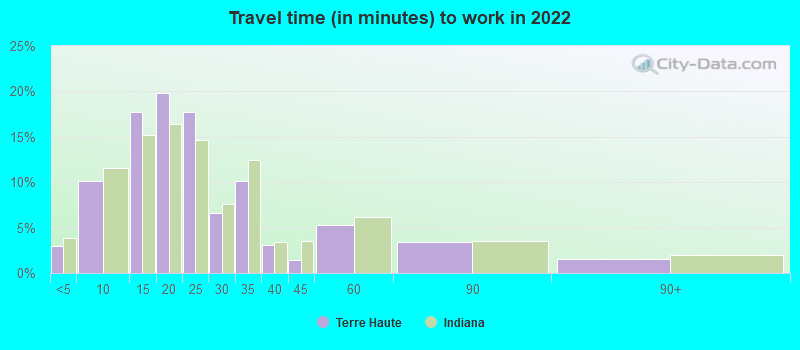
- Mean travel time to work (commute): 15.5 minutes
| Here: | 10.9 |
| Indiana average: | 11.3 |
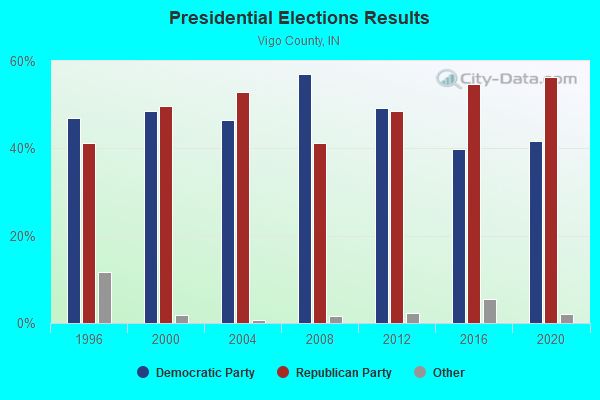
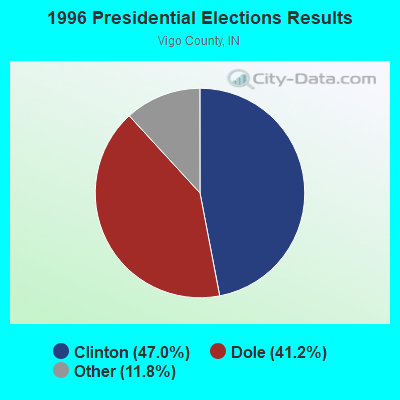
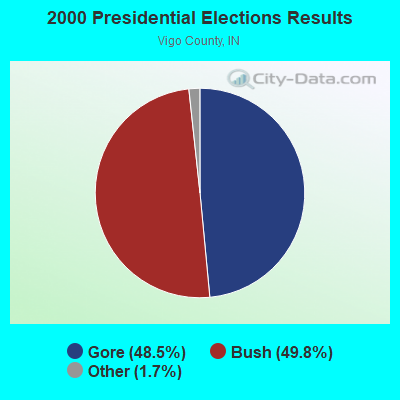
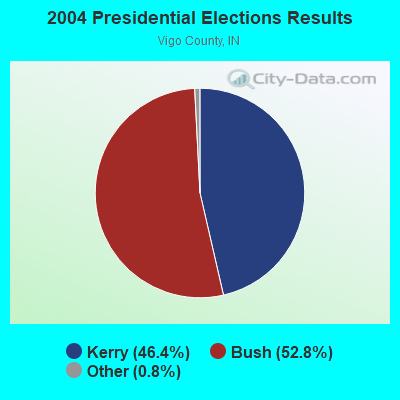
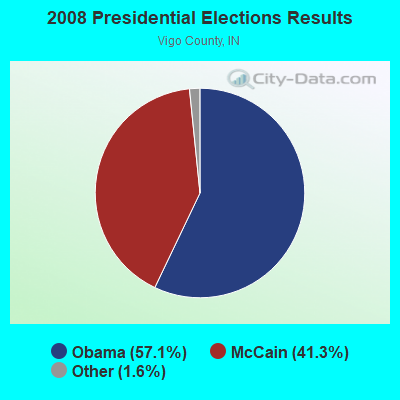
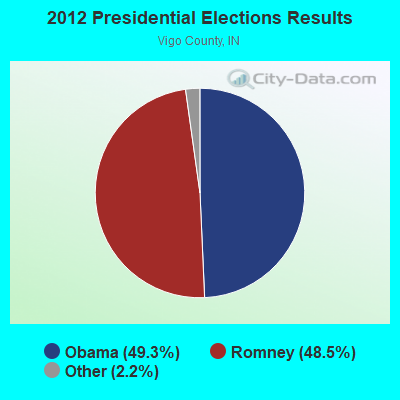
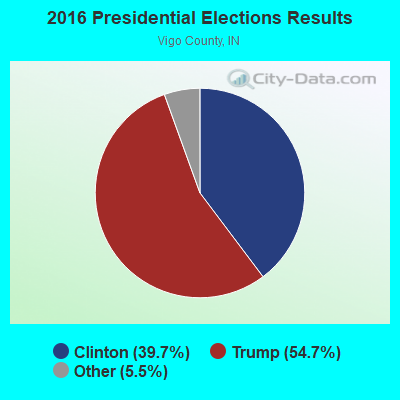
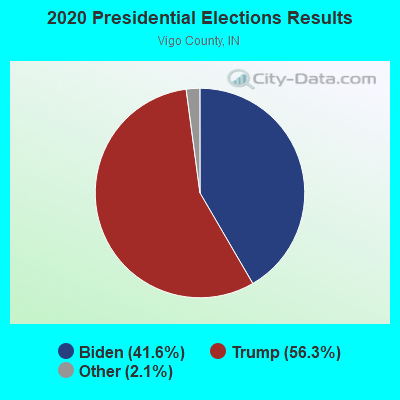
Graphs represent county-level data. Detailed 2008 Election Results
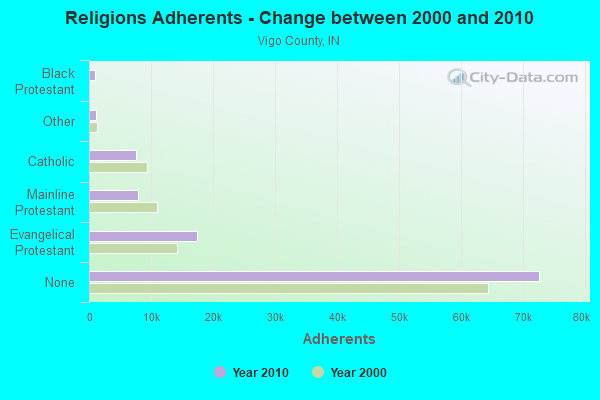
Religion statistics for Terre Haute, IN (based on Vigo County data)
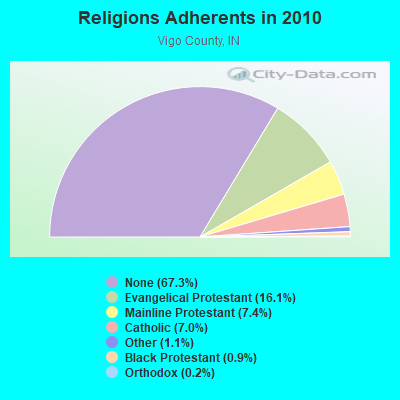
| Religion | Adherents | Congregations |
|---|---|---|
| Evangelical Protestant | 17,396 | 83 |
| Mainline Protestant | 7,928 | 39 |
| Catholic | 7,500 | 9 |
| Other | 1,201 | 9 |
| Black Protestant | 963 | 10 |
| Orthodox | 254 | 1 |
| None | 72,606 | - |
Food Environment Statistics:
| Vigo County: | 1.89 / 10,000 pop. |
| Indiana: | 1.73 / 10,000 pop. |
| This county: | 0.28 / 10,000 pop. |
| Indiana: | 0.21 / 10,000 pop. |
| Vigo County: | 0.66 / 10,000 pop. |
| State: | 0.50 / 10,000 pop. |
| This county: | 4.63 / 10,000 pop. |
| Indiana: | 3.57 / 10,000 pop. |
| Here: | 8.13 / 10,000 pop. |
| Indiana: | 6.78 / 10,000 pop. |
| This county: | 9.2% |
| State: | 9.2% |
| This county: | 30.9% |
| State: | 29.0% |
| Here: | 16.1% |
| Indiana: | 14.3% |
Health and Nutrition:
| Here: | 50.3% |
| Indiana: | 49.3% |
| Terre Haute: | 48.2% |
| Indiana: | 46.2% |
| Here: | 28.1 |
| State: | 28.7 |
| This city: | 20.7% |
| Indiana: | 21.3% |
| Terre Haute: | 10.8% |
| Indiana: | 10.6% |
| Terre Haute: | 6.9 |
| State: | 6.8 |
| Terre Haute: | 31.0% |
| State: | 33.9% |
| Here: | 57.5% |
| Indiana: | 56.1% |
| This city: | 79.4% |
| Indiana: | 78.7% |
More about Health and Nutrition of Terre Haute, IN Residents
| Local government employment and payroll (March 2022) | |||||
| Function | Full-time employees | Monthly full-time payroll | Average yearly full-time wage | Part-time employees | Monthly part-time payroll |
|---|---|---|---|---|---|
| Firefighters | 148 | $920,718 | $74,653 | 0 | $0 |
| Police Protection - Officers | 127 | $760,605 | $71,868 | 0 | $0 |
| Sewerage | 58 | $302,108 | $62,505 | 0 | $0 |
| Streets and Highways | 53 | $243,319 | $55,091 | 1 | $891 |
| Parks and Recreation | 36 | $124,407 | $41,469 | 38 | $8,434 |
| Transit | 27 | $110,953 | $49,312 | 9 | $11,142 |
| Other Government Administration | 26 | $84,103 | $38,817 | 0 | $0 |
| Financial Administration | 17 | $71,787 | $50,673 | 0 | $0 |
| Police - Other | 16 | $54,533 | $40,900 | 24 | $7,048 |
| Airports | 15 | $67,741 | $54,193 | 1 | $979 |
| Other and Unallocable | 10 | $35,189 | $42,227 | 25 | $8,656 |
| Fire - Other | 6 | $27,555 | $55,110 | 0 | $0 |
| Judicial and Legal | 6 | $25,289 | $50,578 | 0 | $0 |
| Natural Resources | 1 | $4,991 | $59,892 | 0 | $0 |
| Totals for Government | 546 | $2,833,300 | $62,270 | 98 | $37,150 |
Terre Haute government finances - Expenditure in 2021 (per resident):
- Construction - Solid Waste Management: $17,945,000 ($307.62)
Sewerage: $12,931,000 ($221.67)
Air Transportation: $1,213,000 ($20.79)
General - Other: $577,000 ($9.89)
Regular Highways: $196,000 ($3.36)
Parks and Recreation: $37,000 ($0.63)
- Current Operations - Local Fire Protection: $14,013,000 ($240.22)
Police Protection: $13,042,000 ($223.57)
General - Other: $8,611,000 ($147.61)
Regular Highways: $4,246,000 ($72.79)
Health - Other: $4,158,000 ($71.28)
Solid Waste Management: $3,253,000 ($55.76)
Parks and Recreation: $2,929,000 ($50.21)
Transit Utilities: $2,649,000 ($45.41)
Housing and Community Development: $2,148,000 ($36.82)
Air Transportation: $2,055,000 ($35.23)
Judicial and Legal Services: $1,680,000 ($28.80)
Miscellaneous Commercial Activities - Other: $616,000 ($10.56)
Central Staff Services: $533,000 ($9.14)
Financial Administration: $513,000 ($8.79)
General Public Buildings: $223,000 ($3.82)
- General - Interest on Debt: $5,983,000 ($102.56)
- Other Capital Outlay - Air Transportation: $262,000 ($4.49)
General - Other: $240,000 ($4.11)
Parks and Recreation: $93,000 ($1.59)
Regular Highways: $63,000 ($1.08)
Health - Other: $62,000 ($1.06)
Police Protection: $47,000 ($0.81)
Miscellaneous Commercial Activities - Other: $30,000 ($0.51)
Financial Administration: $5,000 ($0.09)
Judicial and Legal Services: $5,000 ($0.09)
Local Fire Protection: $3,000 ($0.05)
- Total Salaries and Wages: $716,000 ($12.27)
Terre Haute government finances - Revenue in 2021 (per resident):
- Charges - Sewerage: $45,910,000 ($787.01)
Other: $3,045,000 ($52.20)
Parks and Recreation: $1,126,000 ($19.30)
Air Transportation: $810,000 ($13.89)
Miscellaneous Commercial Activities: $147,000 ($2.52)
- Federal Intergovernmental - Other: $2,141,000 ($36.70)
Air Transportation: $501,000 ($8.59)
- Local Intergovernmental - Highways: $822,000 ($14.09)
Other: $186,000 ($3.19)
- Miscellaneous - Donations From Private Sources: $252,000 ($4.32)
Interest Earnings: $34,000 ($0.58)
General Revenue - Other: $28,000 ($0.48)
Sale of Property: $8,000 ($0.14)
- State Intergovernmental - Highways: $7,094,000 ($121.61)
Other: $3,896,000 ($66.79)
General Local Government Support: $2,794,000 ($47.90)
- Tax - Property: $33,812,000 ($579.62)
Other: $441,000 ($7.56)
Public Utilities Sales: $276,000 ($4.73)
Other License: $254,000 ($4.35)
Occupation and Business License - Other: $15,000 ($0.26)
Terre Haute government finances - Debt in 2021 (per resident):
- Long Term Debt - Beginning Outstanding - Unspecified Public Purpose: $240,544,000 ($4123.49)
Outstanding Unspecified Public Purpose: $240,274,000 ($4118.87)
Retired Unspecified Public Purpose: $270,000 ($4.63)
Terre Haute government finances - Cash and Securities in 2021 (per resident):
- Bond Funds - Cash and Securities: $33,439,000 ($573.22)
- Other Funds - Cash and Securities: $49,833,000 ($854.26)
- Sinking Funds - Cash and Securities: $17,778,000 ($304.76)
| Businesses in Terre Haute, IN | ||||
| Name | Count | Name | Count | |
|---|---|---|---|---|
| ALDI | 1 | Long John Silver's | 4 | |
| AT&T | 3 | Lowe's | 1 | |
| Advance Auto Parts | 1 | Macy's | 1 | |
| Aeropostale | 1 | Marriott | 2 | |
| American Eagle Outfitters | 1 | MasterBrand Cabinets | 9 | |
| Applebee's | 2 | Maurices | 1 | |
| Arby's | 3 | McDonald's | 5 | |
| AutoZone | 3 | Men's Wearhouse | 1 | |
| Baskin-Robbins | 2 | Menards | 1 | |
| Bath & Body Works | 1 | Motherhood Maternity | 1 | |
| Big O Tires | 1 | New Balance | 1 | |
| Budget Car Rental | 1 | Nike | 7 | |
| Burger King | 6 | Nissan | 1 | |
| Burlington Coat Factory | 1 | OfficeMax | 1 | |
| CVS | 5 | Old Navy | 1 | |
| Carson Pirie Scott | 1 | Olive Garden | 1 | |
| Catherines | 1 | Outback | 1 | |
| Chevrolet | 1 | Outback Steakhouse | 1 | |
| Cinnabon | 1 | Pac Sun | 1 | |
| Circle K | 3 | Panera Bread | 1 | |
| Comfort Suites | 1 | Papa John's Pizza | 2 | |
| Cracker Barrel | 1 | Payless | 2 | |
| Curves | 1 | Penske | 1 | |
| Dairy Queen | 4 | PetSmart | 1 | |
| Days Inn | 1 | Pizza Hut | 4 | |
| Deb | 1 | Plato's Closet | 1 | |
| Decora Cabinetry | 1 | Quality | 1 | |
| Dennys | 2 | Quiznos | 1 | |
| Domino's Pizza | 2 | RadioShack | 2 | |
| Dressbarn | 1 | Red Lobster | 1 | |
| Econo Lodge | 1 | Ruby Tuesday | 1 | |
| Fashion Bug | 1 | Rue21 | 1 | |
| FedEx | 14 | Ryan's Grill | 1 | |
| Finish Line | 1 | SAS Shoes | 2 | |
| Firestone Complete Auto Care | 1 | SONIC Drive-In | 1 | |
| Ford | 1 | Sam's Club | 1 | |
| GNC | 2 | Sears | 2 | |
| GameStop | 2 | Shoe Carnival | 1 | |
| Gap | 1 | Spencer Gifts | 1 | |
| Goodwill | 2 | Sprint Nextel | 2 | |
| H&R Block | 3 | Staples | 1 | |
| Hardee's | 2 | Starbucks | 3 | |
| Hilton | 1 | Steak 'n Shake | 1 | |
| Hobby Lobby | 1 | Subway | 10 | |
| Holiday Inn | 2 | Super 8 | 1 | |
| Hollister Co. | 1 | T-Mobile | 4 | |
| Honda | 1 | T.G.I. Driday's | 1 | |
| Hot Topic | 1 | T.J.Maxx | 1 | |
| Hyundai | 1 | Taco Bell | 3 | |
| IHOP | 1 | The Room Place | 1 | |
| JCPenney | 1 | Toyota | 1 | |
| Jimmy John's | 2 | Toys"R"Us | 1 | |
| Jones New York | 2 | Travelodge | 1 | |
| Journeys | 1 | U-Haul | 6 | |
| Justice | 1 | UPS | 18 | |
| KFC | 3 | Vans | 2 | |
| Kmart | 1 | Verizon Wireless | 2 | |
| Kohl's | 1 | Victoria's Secret | 1 | |
| Kroger | 4 | Walgreens | 3 | |
| La-Z-Boy | 1 | Walmart | 2 | |
| Lane Furniture | 3 | Wendy's | 4 | |
| LensCrafters | 1 | White Castle | 1 | |
| Little Caesars Pizza | 3 | |||
Strongest AM radio stations in Terre Haute:
- WPFR (1480 AM; 5 kW; TERRE HAUTE, IN)
- WBOW (1300 AM; 0 kW; TERRE HAUTE, IN; Owner: CROSSROADS INVESTMENTS, LLC)
- WIBC (1070 AM; 50 kW; INDIANAPOLIS, IN; Owner: EMMIS RADIO LICENSE CORPORATION)
- WHAS (840 AM; 50 kW; LOUISVILLE, KY; Owner: CLEAR CHANNEL BROADCASTING LICENSES, INC.)
- WLS (890 AM; 50 kW; CHICAGO, IL; Owner: WLS, INC.)
- WLW (700 AM; 50 kW; CINCINNATI, OH; Owner: JACOR BROADCASTING CORPORATION)
- WSDX (1130 AM; daytime; 0 kW; BRAZIL, IN)
- WSCR (670 AM; 50 kW; CHICAGO, IL; Owner: INFINITY BROADCASTING OPERATIONS, INC.)
- KXEN (1010 AM; 50 kW; FESTUS-ST. LOUIS, MO; Owner: BDJ RADIO ENTERPRISES, LLC)
- WILL (580 AM; 5 kW; URBANA, IL; Owner: UNIV. OF ILLINOIS BOARD OF TRUSTEES)
- WGN (720 AM; 50 kW; CHICAGO, IL; Owner: WGN CONTINENTAL BROADCASTING CO.)
- WBBM (780 AM; 50 kW; CHICAGO, IL; Owner: INFINITY BROADCASTING OPERATIONS, INC.)
- WYLL (1160 AM; 50 kW; CHICAGO, IL; Owner: SCA LICENSE CORPORATION)
Strongest FM radio stations in Terre Haute:
- WTHI-FM (99.9 FM; TERRE HAUTE, IN; Owner: EMMIS RADIO LICENSE CORPORATION)
- WAPC (91.9 FM; TERRE HAUTE, IN; Owner: AMERICAN FAMILY ASSOCIATION)
- W236AE (95.1 FM; TERRE HAUTE, IN; Owner: THE TRUSTEES OF INDIANA UNIVERSITY)
- WWSY (95.9 FM; SEELYVILLE, IN; Owner: BRIGHT TOWER COMMUNICATIONS, INC.)
- WMHD-FM (90.7 FM; TERRE HAUTE, IN; Owner: ROSE-HULMAN INSTITUTE OF TECHNOLOGY)
- WMGI (100.7 FM; TERRE HAUTE, IN; Owner: BRIGHT TOWER COMMUNICATIONS, INC.)
- WCRT (88.5 FM; TERRE HAUTE, IN; Owner: ILLINOIS BIBLE INSTITUTE)
- WWVR (105.5 FM; WEST TERRE HAUTE, IN; Owner: EMMIS RADIO LICENSE CORPORATION)
- WPFR-FM (93.9 FM; CLINTON, IN; Owner: WORD POWER, INC.)
- WISU (89.7 FM; TERRE HAUTE, IN; Owner: INDIANA STATE UNIV. BD. OF TRUSTEES)
- WBOW-FM (102.7 FM; TERRE HAUTE, IN; Owner: CROSSROADS INVESTMENTS, LLC)
- WSDM-FM (97.7 FM; BRAZIL, IN; Owner: CROSSROADS INVESTMENTS, LLC)
- WACF (98.5 FM; PARIS, IL; Owner: P.R.S. BROADCASTING, INC.)
- WAXI (104.9 FM; ROCKVILLE, IN; Owner: CROSSROADS INVESTMENTS, LLC)
- WMMC (105.9 FM; MARSHALL, IL; Owner: JDL BROADCASTING, INC.)
- W217AS (91.3 FM; TERRE HAUTE, IN; Owner: PENSACOLA CHRISTIAN COLLEGE, INC.)
TV broadcast stations around Terre Haute:
- W43BV (Channel 43; TERRE HAUTE, IN; Owner: TRINITY BROADCASTING NETWORK)
- WTWO (Channel 2; TERRE HAUTE, IN; Owner: NEXSTAR BROADCASTING OF THE MIDWEST, INC.)
- WBAK-TV (Channel 38; TERRE HAUTE, IN; Owner: INDIANA BROADCASTING PARTNERS)
- WTHI-TV (Channel 10; TERRE HAUTE, IN; Owner: EMMIS TELEVISION LICENSE CORPORATION)
- WTIU (Channel 30; BLOOMINGTON, IN; Owner: THE TRUSTEES OF INDIANA UNIVERSITY)
- WICD (Channel 15; CHAMPAIGN, IL; Owner: WICD LICENSEE, LLC)
Medal of Honor Recipients
Medal of Honor Recipients born in Terre Haute: Charles G. *abrell, George W. Biegler.
- National Bridge Inventory (NBI) Statistics
- 225Number of bridges
- 2,930ft / 893mTotal length
- $12,461,000Total costs
- 1,665,318Total average daily traffic
- 248,960Total average daily truck traffic
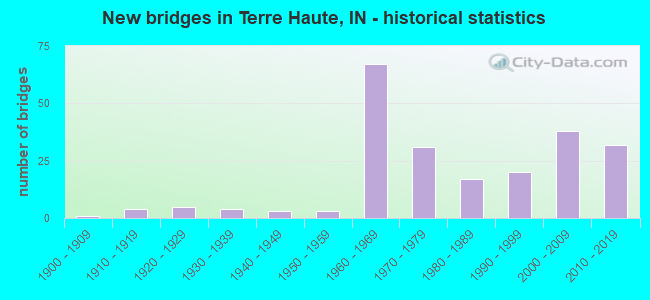
- New bridges - historical statistics
- 11900-1909
- 41910-1919
- 51920-1929
- 41930-1939
- 31940-1949
- 31950-1959
- 671960-1969
- 311970-1979
- 171980-1989
- 201990-1999
- 382000-2009
- 322010-2019
FCC Registered Antenna Towers: 505 (See the full list of FCC Registered Antenna Towers)
FCC Registered Commercial Land Mobile Towers: 11 (See the full list of FCC Registered Commercial Land Mobile Towers in Terre Haute, IN)
FCC Registered Private Land Mobile Towers: 4 (See the full list of FCC Registered Private Land Mobile Towers)
FCC Registered Broadcast Land Mobile Towers: 79 (See the full list of FCC Registered Broadcast Land Mobile Towers)
FCC Registered Microwave Towers: 121 (See the full list of FCC Registered Microwave Towers in this town)
FCC Registered Paging Towers: 18 (See the full list of FCC Registered Paging Towers)
FCC Registered Maritime Coast & Aviation Ground Towers: 3 (See the full list of FCC Registered Maritime Coast & Aviation Ground Towers)
FCC Registered Amateur Radio Licenses: 713 (See the full list of FCC Registered Amateur Radio Licenses in Terre Haute)
FAA Registered Aircraft Manufacturers and Dealers: 7 (See the full list of FAA Registered Manufacturers and Dealers in Terre Haute)
FAA Registered Aircraft: 91 (See the full list of FAA Registered Aircraft)
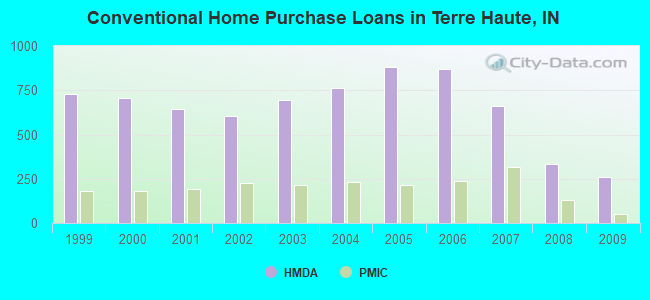
| Home Mortgage Disclosure Act Aggregated Statistics For Year 2009 (Based on 18 full and 2 partial tracts) | ||||||||||||||
| A) FHA, FSA/RHS & VA Home Purchase Loans | B) Conventional Home Purchase Loans | C) Refinancings | D) Home Improvement Loans | E) Loans on Dwellings For 5+ Families | F) Non-occupant Loans on < 5 Family Dwellings (A B C & D) | G) Loans On Manufactured Home Dwelling (A B C & D) | ||||||||
|---|---|---|---|---|---|---|---|---|---|---|---|---|---|---|
| Number | Average Value | Number | Average Value | Number | Average Value | Number | Average Value | Number | Average Value | Number | Average Value | Number | Average Value | |
| LOANS ORIGINATED | 188 | $80,916 | 262 | $70,097 | 566 | $86,883 | 55 | $27,913 | 9 | $189,688 | 123 | $52,835 | 8 | $59,069 |
| APPLICATIONS APPROVED, NOT ACCEPTED | 8 | $82,196 | 7 | $106,534 | 38 | $81,325 | 4 | $16,422 | 0 | $0 | 3 | $46,667 | 1 | $40,100 |
| APPLICATIONS DENIED | 25 | $64,514 | 61 | $54,068 | 319 | $77,206 | 59 | $25,663 | 1 | $89,000 | 36 | $43,340 | 6 | $42,090 |
| APPLICATIONS WITHDRAWN | 23 | $66,455 | 31 | $67,796 | 185 | $92,412 | 13 | $35,248 | 0 | $0 | 16 | $38,051 | 2 | $49,035 |
| FILES CLOSED FOR INCOMPLETENESS | 5 | $61,200 | 2 | $49,670 | 52 | $106,402 | 7 | $23,571 | 0 | $0 | 3 | $70,000 | 1 | $26,000 |
Detailed mortgage data for all 22 tracts in Terre Haute, IN
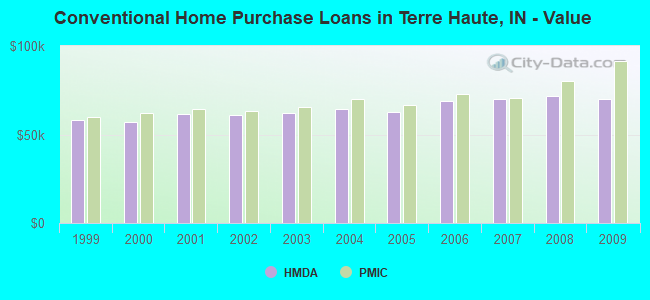
| Private Mortgage Insurance Companies Aggregated Statistics For Year 2009 (Based on 11 full and 2 partial tracts) | ||||
| A) Conventional Home Purchase Loans | B) Refinancings | |||
|---|---|---|---|---|
| Number | Average Value | Number | Average Value | |
| LOANS ORIGINATED | 49 | $91,787 | 21 | $121,555 |
| APPLICATIONS APPROVED, NOT ACCEPTED | 6 | $162,040 | 7 | $69,427 |
| APPLICATIONS DENIED | 6 | $96,365 | 4 | $66,508 |
| APPLICATIONS WITHDRAWN | 1 | $66,000 | 1 | $142,430 |
| FILES CLOSED FOR INCOMPLETENESS | 1 | $51,000 | 0 | $0 |
2002 - 2018 National Fire Incident Reporting System (NFIRS) incidents
- Fire incident types reported to NFIRS in Terre Haute, IN
- 1,60143.0%Structure Fires
- 1,24133.3%Outside Fires
- 65017.4%Mobile Property/Vehicle Fires
- 2356.3%Other
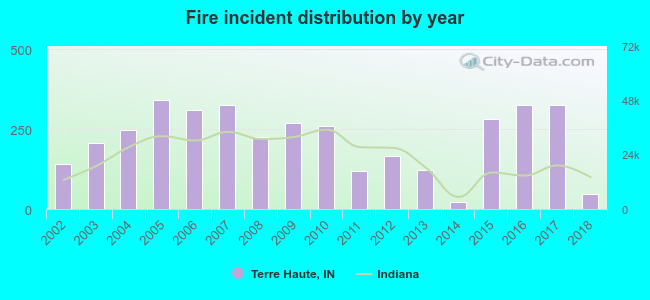 Based on the data from the years 2002 - 2018 the average number of fires per year is 219. The highest number of reported fire incidents - 340 took place in 2005, and the least - 23 in 2014. The data has a declining trend.
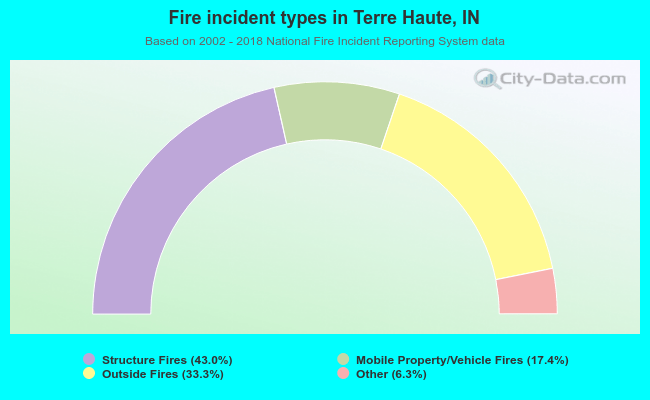 When looking into fire subcategories, the most incidents belonged to: Structure Fires (43.0%), and Outside Fires (33.3%).
Fire-safe hotels and motels in Terre Haute, Indiana:
- Dollar Inns, 101 Margaret Ave, Terre Haute, Indiana 47802 , Phone: (812) 232-8006
- Econo Lodge, 401 E Margaret Dr, Terre Haute, Indiana 47802 , Phone: (812) 234-9931, Fax: (812) 234-0890
- Knights Inn, 1 W Honey Creek Dr, Terre Haute, Indiana 47802 , Phone: (812) 238-1586, Fax: (812) 238-1424
- Signature Inn, 3033 Dixie Bee Rd, Terre Haute, Indiana 47802 , Phone: (812) 238-1461
- Holiday Inn Terre Haute, 3300 US 41 S, Terre Haute, Indiana 47802 , Phone: (812) 232-6081, Fax: (812) 238-9934
- Drury Inn-terre Haute, 3040 Hwy 41 S, Terre Haute, Indiana 47802 , Phone: (812) 238-1206, Fax: (812) 238-1206
- Best Western Terre Haute Inn & Suites, 3053 Us Hwy 41 S, Terre Haute, Indiana 47802 , Phone: (812) 238-1461, Fax: (812) 238-1462
- Hilton Garden Inn - Terre Haute, 750 Wabash Ave, Terre Haute, Indiana 47807 , Phone: (812) 234-8900, Fax: (812) 234-8903
- 5 other hotels and motels
| Most common first names in Terre Haute, IN among deceased individuals | ||
| Name | Count | Lived (average) |
|---|---|---|
| Mary | 1,083 | 79.4 years |
| John | 894 | 74.6 years |
| William | 829 | 74.8 years |
| James | 744 | 72.2 years |
| Robert | 659 | 70.7 years |
| Charles | 596 | 73.4 years |
| Helen | 465 | 79.4 years |
| Margaret | 390 | 80.4 years |
| Ruth | 364 | 80.5 years |
| George | 362 | 75.1 years |
| Most common last names in Terre Haute, IN among deceased individuals | ||
| Last name | Count | Lived (average) |
|---|---|---|
| Smith | 403 | 76.4 years |
| Jones | 254 | 75.9 years |
| Johnson | 240 | 75.6 years |
| Miller | 210 | 76.5 years |
| Brown | 204 | 74.3 years |
| Williams | 203 | 75.9 years |
| Wilson | 173 | 76.0 years |
| Davis | 150 | 76.6 years |
| Moore | 134 | 76.5 years |
| Taylor | 130 | 78.1 years |
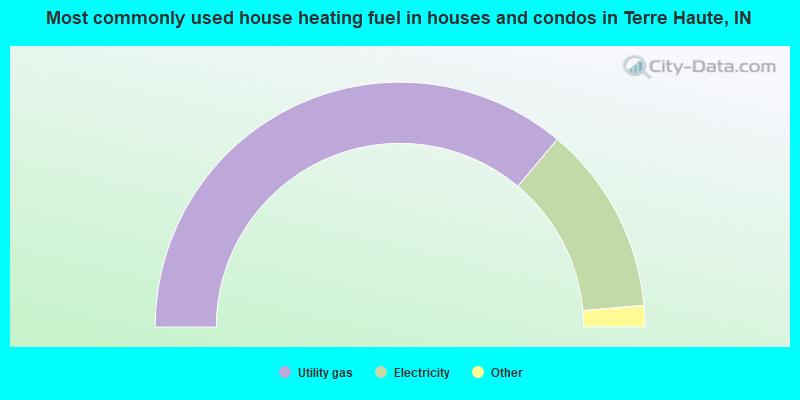
- 72.2%Utility gas
- 25.0%Electricity
- 1.3%Fuel oil, kerosene, etc.
- 1.0%Bottled, tank, or LP gas
- 0.2%Wood
- 0.2%No fuel used
- 0.1%Other fuel
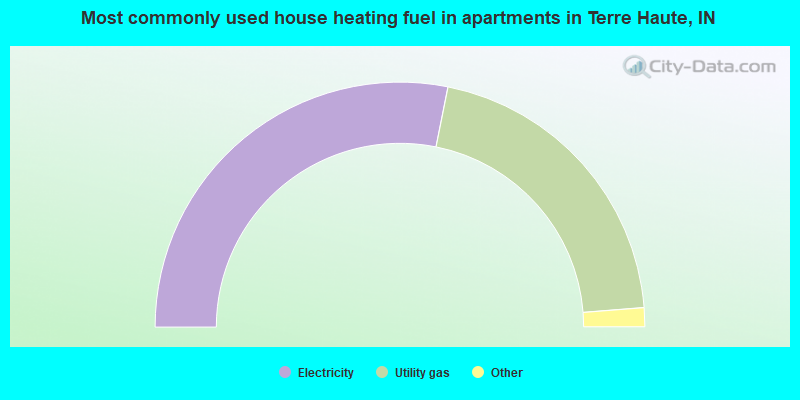
- 56.3%Electricity
- 41.2%Utility gas
- 0.7%Bottled, tank, or LP gas
- 0.6%Solar energy
- 0.6%Other fuel
- 0.2%No fuel used
- 0.2%Wood
- 0.1%Fuel oil, kerosene, etc.
Terre Haute compared to Indiana state average:
- Median household income below state average.
- Median house value below state average.
- Hispanic race population percentage below state average.
- Median age below state average.
- Institutionalized population percentage significantly above state average.
- Number of college students above state average.
Terre Haute on our top lists:
- #11 on the list of "Top 101 cities with the largest percentage of people in military hospitals or wards for chronically ill (population 1,000+)"
- #13 on the list of "Top 101 cities with the largest wind speed differences during a year (population 50,000+)"
- #17 on the list of "Top 100 cities with the largest percentage of males (pop. 50,000+)"
- #19 on the list of "Top 101 cities with the highest average snowfall in a year (population 50,000+)"
- #19 on the list of "Top 101 cities with the highest number of arson incidents per 100,000 residents, excludes tourist destinations and others with a lot of outsiders visiting based on city industries data (population 50,000+)"
- #33 on the list of "Top 100 cities with highest percentage of college students (pop. 50,000+)"
- #40 on the list of "Top 101 cities with largest percentage of males in occupations: community and social service occupations (population 50,000+)"
- #40 on the list of "Top 101 cities with largest percentage of males in industries: educational services (population 50,000+)"
- #41 on the list of "Top 101 cities with the highest number of burglaries per 100,000 residents, excludes tourist destinations and others with a lot of outsiders visiting based on city industries data (population 50,000+)"
- #46 on the list of "Top 101 cities with the largest percentage of people in federal prisons and detention centers (population 1,000+)"
- #47 on the list of "Top 101 cities with largest percentage of females in industries: educational services (population 50,000+)"
- #49 on the list of "Top 100 cities with shortest commuting times (pop. 50,000+)"
- #54 on the list of "Top 101 cities with largest percentage of females in industries: fuel dealers (population 50,000+)"
- #54 on the list of "Top 101 cities with the highest number of thefts per 100,000 residents, excludes tourist destinations and others with a lot of outsiders visiting based on city industries data (population 50,000+)"
- #55 on the list of "Top 101 cities with largest percentage of females in industries: farm supplies merchant wholesalers (population 50,000+)"
- #56 on the list of "Top 101 cities with largest percentage of females in industries: water transportation (population 50,000+)"
- #57 on the list of "Top 101 cities with largest percentage of males in industries: farm product raw materials merchant wholesalers (population 50,000+)"
- #58 on the list of "Top 101 cities with largest percentage of females in occupations: air transportation workers (population 50,000+)"
- #58 on the list of "Top 101 cities with largest percentage of females in industries: farm product raw materials merchant wholesalers (population 50,000+)"
- #58 on the list of "Top 101 cities with largest percentage of females in industries: vending machine operators (population 50,000+)"
- #21 (47807) on the list of "Top 101 zip codes with the lowest average reported salary/wage in 2012 (pop 5,000+)"
- #46 (47807) on the list of "Top 101 zip codes with the smallest percentage of taxpayers using charity contributions deductions in 2012 (pop 5,000+)"
- #42 on the list of "Top 101 counties with the lowest surface withdrawal of fresh water for public supply (pop. 50,000+)"
- #43 on the list of "Top 101 counties with the highest Particulate Matter (PM2.5) Annual air pollution readings in 2012 (µg/m3)"
- #85 on the list of "Top 101 counties with the highest Sulfur Oxides Annual air pollution readings in 2012 (µg/m3)"

|
|
Total of 209 patent applications in 2008-2024.