Estimated zip code population in 2022: 9,322 Zip code population in 2010: 9,009 Zip code population in 2000: 10,104
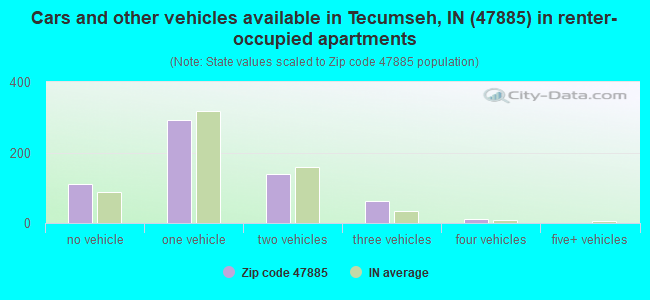
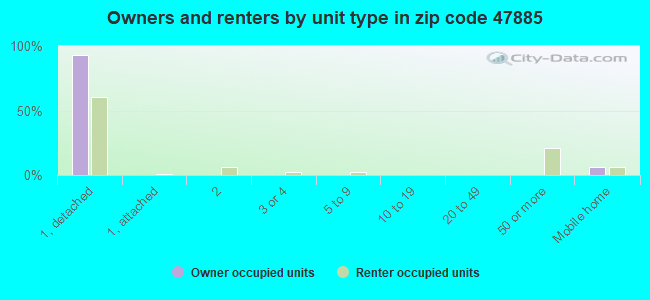
Houses and condos: 3,850 Renter-occupied apartments: 617
% of renters here:
17%
State:
29%
March 2022 cost of living index in zip code 47885: 84.7 (less than average, U.S. average is 100)
Land area: 82.3 sq. mi. Water area: 2.2 sq. mi.
Population density: 113 people per square mile
(very low).
OSM Map
General Map
Google Map
MSN Map
OSM Map
General Map
Google Map
MSN Map
OSM Map
General Map
Google Map
MSN Map
OSM Map
General Map
Google Map
MSN Map
Please wait while loading the map...
Real estate property taxes paid for housing units in 2022:
This zip code:
0.8% ($1,090)
Indiana:
0.7% ($1,467)
Median real estate property taxes paid for housing units with mortgages in 2022: $1,297 (0.7%) Median real estate property taxes paid for housing units with no mortgage in 2022: $747 (0.8%)
Business Search- 14 Million verified businesses
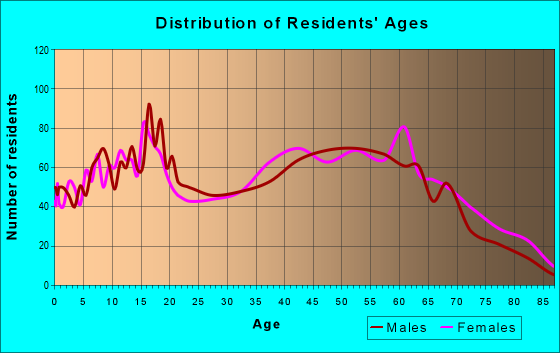
Males: 4,698
(50.4%)
Females: 4,623
(49.6%)
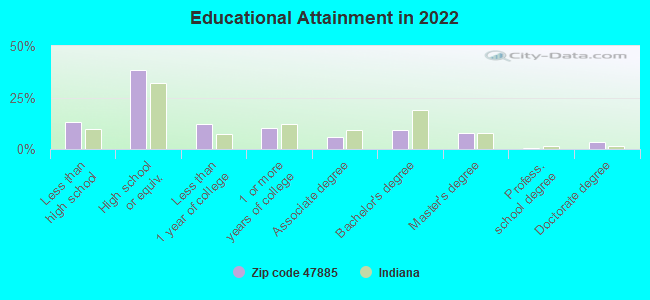
For population 25 years and over in 47885:
High school or higher: 86.1%
Bachelor's degree or higher: 20.4%
Graduate or professional degree: 11.3%
Unemployed: 5.9%
Mean travel time to work (commute): 20.5 minutes
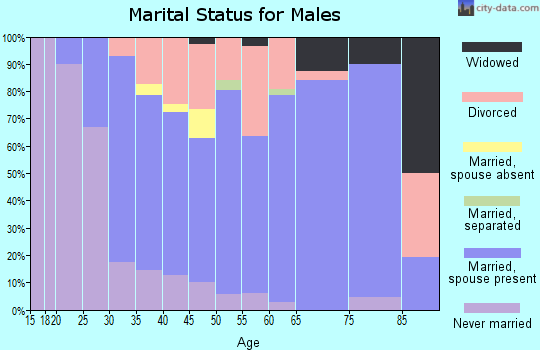
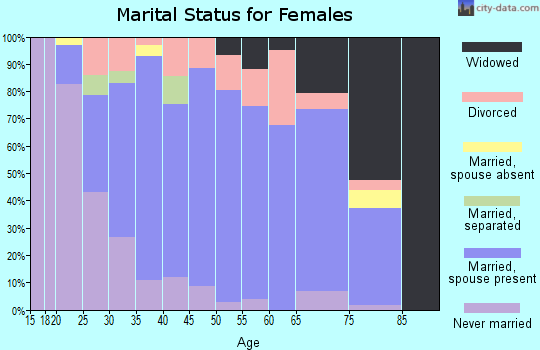
For population 15 years and over in 47885:
Never married: 32.9%
Now married: 44.7%
Separated: 0.6%
Widowed: 6.6%
Divorced: 15.3%
Zip code 47885 compared to state average:
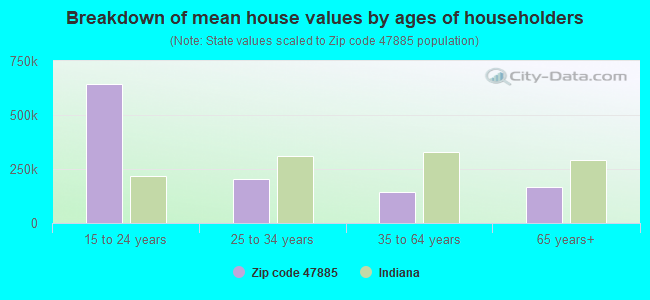
Median house value below state average.
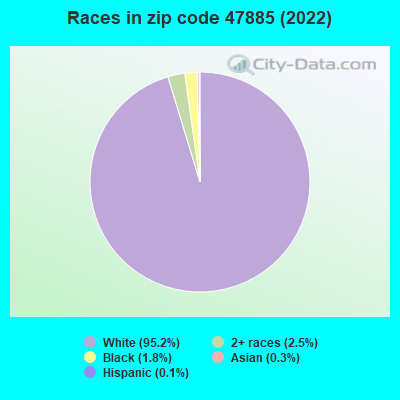
Black race population percentage significantly below state average.
Hispanic race population percentage significantly below state average.
Median age above state average.
Foreign-born population percentage significantly below state average.
Renting percentage below state average.
Length of stay since moving in significantly above state average.
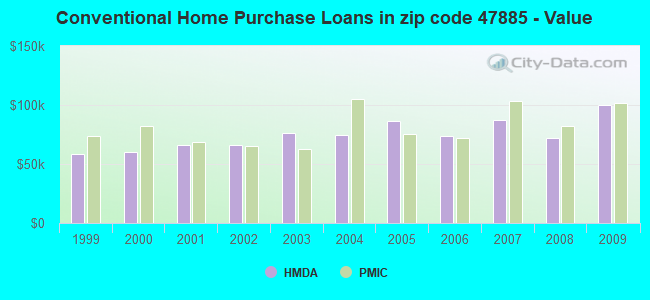
Estimated median house/condo value in 2022: $139,020
47885:
$139,020
Indiana:
$208,700
Median resident age:
This zip code:
43.7 years
Indiana median age:
38.2 years
Average household size:
This zip code:
2.6 people
Indiana:
2.4 people
Averages for the 2020 tax year for zip code 47885, filed in 2021:
Average Adjusted Gross Income (AGI) in 2020: $52,224 (Individual Income Tax Returns)
Here:
$52,224
State:
$64,978
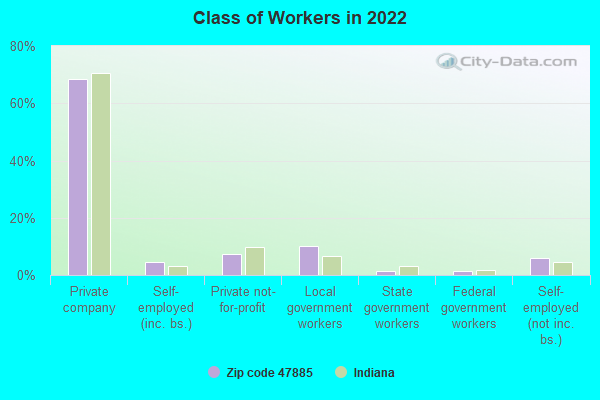
Salary/wage: $47,411 (reported on 80.4% of returns)
Here:
$47,411
State:
$55,245
(% of AGI for various income ranges: 978.9% for AGIs below $25k, 3365.6% for AGIs $25k-50k, 5815.3% for AGIs $50k-75k, 8938.4% for AGIs $75k-100k, 14591.7% for AGIs $100k-200k, 57880.0% for AGIs over 200k)
Taxable interest for individuals: $807 (reported on 20.6% of returns)
This zip code:
$807
Indiana:
$1,351
(% of AGI for various income ranges: 7.7% for AGIs below $25k, 12.3% for AGIs $25k-50k, 26.3% for AGIs $50k-75k, 26.9% for AGIs $75k-100k, 54.2% for AGIs $100k-200k, 475.0% for AGIs over 200k)
Ordinary dividends: $3,619 (reported on 11.5% of returns)
Here:
$3,619
State:
$5,827
(% of AGI for various income ranges: 11.2% for AGIs below $25k, 24.4% for AGIs $25k-50k, 62.7% for AGIs $50k-75k, 34.7% for AGIs $75k-100k, 106.7% for AGIs $100k-200k, 3050.0% for AGIs over 200k)
Net capital gain/loss in AGI: +$7,463 (reported on 9.8% of returns)
Here:
+$7,463
State:
+$17,730
(% of AGI for various income ranges: 4.5% for AGIs below $25k, 18.1% for AGIs $25k-50k, 42.9% for AGIs $50k-75k, 48.1% for AGIs $75k-100k, 376.7% for AGIs $100k-200k, 5725.0% for AGIs over 200k)
Profit/loss from business: +$8,197 (reported on 8.9% of returns)
Here:
+$8,197
State:
+$12,144
(% of AGI for various income ranges: 62.1% for AGIs below $25k, 66.5% for AGIs $25k-50k, 101.0% for AGIs $50k-75k, 177.2% for AGIs $75k-100k, 194.7% for AGIs $100k-200k)
Taxable individual retirement arrangement distribution: $17,380 (reported on 8.4% of returns)
47885:
$17,380
Indiana:
$18,302
(% of AGI for various income ranges: 45.4% for AGIs below $25k, 95.0% for AGIs $25k-50k, 198.2% for AGIs $50k-75k, 318.4% for AGIs $75k-100k, 778.6% for AGIs $100k-200k)
Total itemized deductions: $32,644 (reported on 2.2% of returns)
Here:
$32,644
State:
$35,601
(% of AGI for various income ranges: 245.7% for AGIs $50k-75k, 481.7% for AGIs $100k-200k)
Charity contributions: $11,762 (reported on 1.9% of returns)
Here:
$11,762
State:
$15,596
(% of AGI for various income ranges: 47.3% for AGIs $50k-75k, 196.9% for AGIs $100k-200k)
Taxes paid: $7,711 (reported on 2.2% of returns)
47885:
$7,711
State:
$7,542
(% of AGI for various income ranges: 45.7% for AGIs $50k-75k, 130.6% for AGIs $100k-200k)
Earned income credit: $2,241 (reported on 17.7% of returns)
Here:
$2,241
State:
$2,298
(% of AGI for various income ranges: 90.3% for AGIs below $25k, 72.4% for AGIs $25k-50k)
Percentage of individuals using paid preparers for their 2020 taxes: 96.7%
Here:
97%
State:
94%
(% for various income ranges: 96.3% for AGIs below $25k, 96.8% for AGIs $25k-50k, 96.7% for AGIs $50k-75k, 95.2% for AGIs $75k-100k, 98.1% for AGIs $100k-200k, 100.0% for AGIs over 200k)
Averages for the 2012 tax year for zip code 47885, filed in 2013:
Average Adjusted Gross Income (AGI) in 2012: $41,775 (Individual Income Tax Returns)
Here:
$41,775
State:
$52,932
Salary/wage: $38,292 (reported on 82.0% of returns)
Here:
$38,292
State:
$45,173
(% of AGI for various income ranges: 71.0% for AGIs below $25k, 77.1% for AGIs $25k-50k, 76.1% for AGIs $50k-75k, 81.0% for AGIs $75k-100k, 76.8% for AGIs $100k-200k, 54.8% for AGIs over 200k)
Taxable interest for individuals: $1,042 (reported on 25.4% of returns)
This zip code:
$1,042
Indiana:
$1,311
(% of AGI for various income ranges: 1.3% for AGIs below $25k, 0.6% for AGIs $25k-50k, 0.5% for AGIs $50k-75k, 0.4% for AGIs $75k-100k, 0.5% for AGIs $100k-200k, 1.0% for AGIs over 200k)
Ordinary dividends: $2,827 (reported on 12.4% of returns)
Here:
$2,827
State:
$4,690
(% of AGI for various income ranges: 0.9% for AGIs below $25k, 0.4% for AGIs $25k-50k, 0.8% for AGIs $50k-75k, 0.4% for AGIs $75k-100k, 1.2% for AGIs $100k-200k, 2.2% for AGIs over 200k)
Net capital gain/loss in AGI: +$2,443 (reported on 9.0% of returns)
Here:
+$2,443
State:
+$10,406
(% of AGI for various income ranges: 0.2% for AGIs $25k-50k, 0.3% for AGIs $50k-75k, 0.4% for AGIs $75k-100k, 1.0% for AGIs $100k-200k, 1.9% for AGIs over 200k)
Profit/loss from business: +$9,771 (reported on 10.0% of returns)
Here:
+$9,771
State:
+$11,105
(% of AGI for various income ranges: 3.3% for AGIs below $25k, 2.8% for AGIs $25k-50k, 1.6% for AGIs $50k-75k, 1.4% for AGIs $75k-100k, 3.8% for AGIs $100k-200k)
Taxable individual retirement arrangement distribution: $10,352 (reported on 10.2% of returns)
47885:
$10,352
Indiana:
$13,841
(% of AGI for various income ranges: 3.0% for AGIs below $25k, 2.7% for AGIs $25k-50k, 2.8% for AGIs $50k-75k, 2.9% for AGIs $75k-100k, 2.4% for AGIs $100k-200k)
Total itemized deductions: $18,604 (21% of AGI, reported on 16.8% of returns)
Here:
$18,604
State:
$20,913
Here:
20.8% of AGI
State:
18.2% of AGI
(% of AGI for various income ranges: 5.2% for AGIs below $25k, 4.2% for AGIs $25k-50k, 6.6% for AGIs $50k-75k, 8.5% for AGIs $75k-100k, 11.7% for AGIs $100k-200k, 9.7% for AGIs over 200k)
Charity contributions: $3,547 (reported on 12.4% of returns)
Here:
$3,547
State:
$4,697
(% of AGI for various income ranges: 0.4% for AGIs below $25k, 0.5% for AGIs $25k-50k, 0.9% for AGIs $50k-75k, 1.0% for AGIs $75k-100k, 1.9% for AGIs $100k-200k, 2.0% for AGIs over 200k)
Taxes paid: $5,938 (reported on 16.8% of returns)
47885:
$5,938
State:
$7,456
(% of AGI for various income ranges: 1.0% for AGIs below $25k, 0.9% for AGIs $25k-50k, 1.8% for AGIs $50k-75k, 2.3% for AGIs $75k-100k, 4.4% for AGIs $100k-200k, 5.4% for AGIs over 200k)
Earned income credit: $2,161 (reported on 22.0% of returns)
Here:
$2,161
State:
$2,265
(% of AGI for various income ranges: 6.7% for AGIs below $25k, 1.4% for AGIs $25k-50k)
Percentage of individuals using paid preparers for their 2012 taxes: 68.0%
Here:
68%
State:
53%
(% for various income ranges: 64.3% for AGIs below $25k, 71.4% for AGIs $25k-50k, 71.7% for AGIs $50k-75k, 66.7% for AGIs $75k-100k, 74.1% for AGIs $100k-200k, 75.0% for AGIs over 200k)
Averages for the 2004 tax year for zip code 47885, filed in 2005:
Average Adjusted Gross Income (AGI) in 2004: $35,757 (Individual Income Tax Returns)
Here:
$35,757
State:
$44,790
Salary/wage: $33,595 (reported on 86.1% of returns)
Here:
$33,595
State:
$39,615
(% of AGI for various income ranges: 103.7% for AGIs below $10k, 75.0% for AGIs $10k-25k, 85.7% for AGIs $25k-50k, 85.6% for AGIs $50k-75k, 85.1% for AGIs $75k-100k, 63.6% for AGIs over 100k)
Taxable interest for individuals: $1,311 (reported on 37.0% of returns)
This zip code:
$1,311
Indiana:
$1,535
(% of AGI for various income ranges: 6.4% for AGIs below $10k, 2.1% for AGIs $10k-25k, 1.0% for AGIs $25k-50k, 0.9% for AGIs $50k-75k, 1.3% for AGIs $75k-100k, 1.4% for AGIs over 100k)
Taxable dividends: $2,071 (reported on 15.9% of returns)
Here:
$2,071
State:
$2,998
(% of AGI for various income ranges: 1.5% for AGIs below $10k, 0.9% for AGIs $10k-25k, 0.4% for AGIs $25k-50k, 0.4% for AGIs $50k-75k, 0.6% for AGIs $75k-100k, 2.8% for AGIs over 100k)
Net capital gain/loss: +$3,274 (reported on 11.6% of returns)
Here:
+$3,274
State:
+$8,619
(% of AGI for various income ranges: -0.4% for AGIs below $10k, 0.4% for AGIs $10k-25k, 0.2% for AGIs $25k-50k, 0.7% for AGIs $50k-75k, 1.0% for AGIs $75k-100k, 3.6% for AGIs over 100k)
Profit/loss from business: +$10,635 (reported on 10.2% of returns)
Here:
+$10,635
State:
+$10,071
(% of AGI for various income ranges: 4.7% for AGIs below $10k, 3.2% for AGIs $10k-25k, 1.7% for AGIs $25k-50k, 1.4% for AGIs $50k-75k, 1.8% for AGIs $75k-100k, 8.4% for AGIs over 100k)
IRA payment deduction: $2,351 (reported on 1.8% of returns)
47885:
$2,351
Indiana:
$2,840
(% of AGI for various income ranges: 0.1% for AGIs $10k-25k, 0.2% for AGIs $25k-50k, 0.1% for AGIs $50k-75k, 0.3% for AGIs $75k-100k)
Self-employed pension: $16,647 (reported on 0.4% of returns)
Here:
$16,647
Indiana:
$15,305
Total itemized deductions: $14,956 (20% of AGI, reported on 18.6% of returns)
Here:
$14,956
State:
$17,065
Here:
20.0% of AGI
State:
19.5% of AGI
(% of AGI for various income ranges: 3.0% for AGIs below $10k, 3.0% for AGIs $10k-25k, 5.7% for AGIs $25k-50k, 8.4% for AGIs $50k-75k, 11.4% for AGIs $75k-100k, 10.5% for AGIs over 100k)
Charity contributions deductions: $2,524 (3% of AGI, reported on 14.5% of returns)
Here:
$2,524
State:
$3,550
Here:
3.1% of AGI
State:
3.8% of AGI
(% of AGI for various income ranges: 0.3% for AGIs $10k-25k, 0.5% for AGIs $25k-50k, 1.0% for AGIs $50k-75k, 1.5% for AGIs $75k-100k, 1.9% for AGIs over 100k)
Total tax: $4,563 (reported on 70.7% of returns)
47885:
$4,563
State:
$6,914
(% of AGI for various income ranges: 2.2% for AGIs below $10k, 3.9% for AGIs $10k-25k, 6.2% for AGIs $25k-50k, 8.3% for AGIs $50k-75k, 9.9% for AGIs $75k-100k, 18.1% for AGIs over 100k)
Earned income credit: $1,649 (reported on 18.9% of returns)
Here:
$1,649
State:
$1,685
Percentage of individuals using paid preparers for their 2004 taxes: 68.7%
Here:
69%
State:
59%
(% for various income ranges: 61.6% for AGIs below $10k, 70.6% for AGIs $10k-25k, 74.0% for AGIs $25k-50k, 70.1% for AGIs $50k-75k, 66.1% for AGIs $75k-100k, 65.1% for AGIs over 100k)
Likely homosexual households (counted as self-reported same-sex unmarried-partner households)
Lesbian couples: 0.4% of all households
Gay men: 0.0% of all households
Household received Food Stamps/SNAP in the past 12 months: 445 Household did not receive Food Stamps/SNAP in the past 12 months: 3,180
Women who had a birth in the past 12 months: 98 (24 now married, 64 unmarried) Women who did not have a birth in the past 12 months: 2,080 (814 now married, 1,264 unmarried)
Housing units in zip code 47885 with a mortgage: 1,749 (108 second mortgage, 108 both second mortgage and home equity loan) Houses without a mortgage: 165
Median monthly owner costs for units with a mortgage: $1,181 Median monthly owner costs for units without a mortgage: $464
Residents with income below the poverty level in 2022:
This zip code:
17.8%
Whole state:
12.6%
Residents with income below 50% of the poverty level in 2022:
This zip code:
8.1%
Whole state:
6.3%
Median number of rooms in houses and condos:
Here:
6.6
State:
6.6
Median number of rooms in apartments:
Here:
4.7
State:
4.3
Notable locations in this zip code not listed on our city pages
Notable locations in zip code 47885: Dresser Power Plant (A), Terre Haute Saddle Club (B), Shepardsville Volunteer Fire Department (C), Sugar Creek Fire Department Station 42 (D), Fayette Township Volunteer Fire Department of Sanford (E), Sugar Creek Fire Department Station 41 Headquarters (F), New Goshen Fire and Rescue (G). Display/hide their locations on the map
Churches in zip code 47885 include: Bethesda Church (A), New Vermillion Church (B), Pisgah Church (C), Rose Hill Church (D), Trinity Church (E). Display/hide their locations on the map
Cemeteries: Barbour Cemetery (1), Pleasantview Cemetery (2), Sheets Cemetery (3), Fort Hamilton Cemetery (4), Stults Cemetery (5). Display/hide their locations on the map
Lakes and reservoirs: Izaak Walton Lake (A), Green Valley Mine Pond (B), Grant Mine Pond (C), South Lake (D), North Lake (E), Windemere Lake (F), Saint Marys Lake (G), Lost Creek Conservation Club Lake (H). Display/hide their locations on the map
Parks in zip code 47885 include: Camp Illana (1), Green Valley Public Fishing Area (2), Dresser Memorial Park (3), Sycamore Park (4). Display/hide their locations on the map
1,066 married couples with children.
657 single-parent households (221 men, 436 women).
98.2% of residents of 47885 zip code speak English at home.
0.2% of residents speak Spanish at home (100% very well).
0.1% of residents speak other Indo-European language at home (71% very well, 29% well).
0.3% of residents speak Asian or Pacific Island language at home (60% very well, 40% well).
0.5% of residents speak other language at home (100% very well).
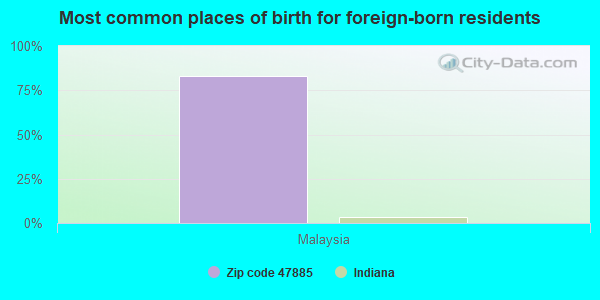
Foreign born population: 31 (0.3%) (100.0% of them are naturalized citizens)
This zip code:
0.3%
Whole state:
6.1%
83%Malaysia
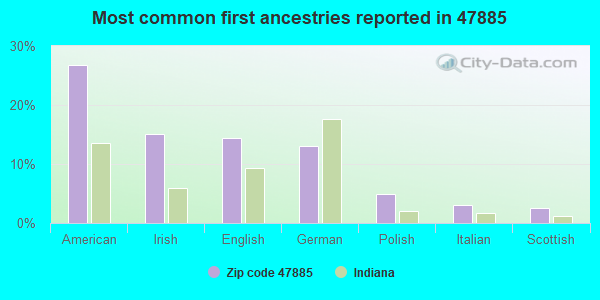
27%American
15%Irish
14%English
13%German
5%Polish
3%Italian
2%Scottish
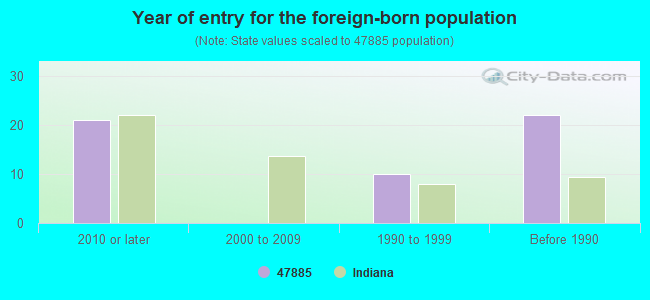
Year of entry for the foreign-born population
212010 or later
02000 to 2009
101990 to 1999
22Before 1990
Major facilities with environmental interests located in this zip code:
SISTERS OF PROVIDENCE (3301 SAINT MARYS ROAD in WEST TERRE HAUTE, IN)
AIR SYNTHETIC MINOR (AIRS/AFS) STATE MASTER (Indiana facility tracking) - ACES-CP-2895, AIR PROGRAM, UST-14216, UNDERGROUND STORAGE TANK PROGRAM National Pollutant Discharge Elimination System NON-MAJOR (Tracking pollutant discharge elimination systems) - permit COMMUNITY WATER SYSTEM (SDWIS) - SDWIS-IN5284020 19837, WATER TREATMENT PLANT Business SIC classification: COLLEGES, UNIVERSITIES, AND PROFESSIONAL SCHOOLS; RELIGIOUS ORGANIZATIONS Organizations: DAVID C ARNOLD 3784 090102 (CONTACT/OPERATOR)
, ST MARY OF THE WOODS THRALLS (CONTACT/OWNER)
Alternative names: SISTERS OF PROVIDENCE/ST. MARY OF WOODS, ST. MARY OF THE WOODS WWTP, THRALLS STATION, INC.
MARION HEIGHTS CONSERVANCY (699 W PINE AVE in WEST TERRE HAUTE, IN)
STATE MASTER (Indiana facility tracking) - CRTK-10283, EPCRA National Pollutant Discharge Elimination System NON-MAJOR (Tracking pollutant discharge elimination systems) - permit COMMUNITY WATER SYSTEM (SDWIS) - SDWIS-IN5284007 7602, WATER TREATMENT PLANT Business SIC classification: WATER SUPPLY Organizations: ANDREW K HEYEN (CONTACT/OPERATOR)
, MARION HEIGHTS CONSERVANCY DIS (CONTACT/OWNER)
Alternative names: MARION HEIGHTS CONSERVANCY DIS
MIRANT SUGAR CREEK LLC (6500 DARWIN ROAD in WEST TERRE HAUTE, IN)
AIR MAJOR (AIRS/AFS) AIR MINOR (AIRS/AFS) AIR PROGRAM (Clean Air Markets Division Business System) STATE MASTER (Indiana facility tracking) - RBLC-16218, AIR MAJOR National Pollutant Discharge Elimination System MAJOR (Tracking pollutant discharge elimination systems) - permit AIR MAJOR ("Best Available" air pollution technologies tracking) Business SIC classification: ELECTRIC SERVICES Organizations: UNKNOWN (CONTACT/OPERATOR)
, MIRANT SUGAR CREEK, LLC (OWNER/OPERATOR)
Alternative names: MIRANT SUGAR CREEK, LLC, SUGAR CREEK POWER PLANT
CINERGY PSI DRESSER MACHINE SHOP (5152 DARWIN RD in WEST TERRE HAUTE, IN)
STATE MASTER (Indiana facility tracking) - ACES-CP-2374, AIR PROGRAM, ACES-CP-2610, (Resource Conservation and Recovery Act (tracking hazardous waste)) Conditionally Exempt Small Quantity Generators, less than 100 kg/month of hazardous waste (Resource Conservation and Recovery Act (tracking hazardous waste)) - notification Organizations: PSI ENERGY INC (CONTACT/OWNER)
, PUBLIC SERVICE INDIANA (CONTACT/OWNER)
Alternative names: PSI ENERGY DRESSER MACHINE SHOP, PUBLIC SERVICE INDIANA
CONSOLIDATED ELEMENTARY SCH (4226 W OLD US 40 in WEST TERRE HAUTE, IN)
STATE MASTER (Indiana facility tracking) (National Center for Education Statistics) - STATE ID-8497 Conditionally Exempt Small Quantity Generators, less than 100 kg/month of hazardous waste (Resource Conservation and Recovery Act (tracking hazardous waste)) - notification Organizations: VIGO CO SCHOOL CORP (CONTACT/OWNER)
, VIGO COUNTY SCHOOL CORP (SCHOOL DISTRICT)
CLARK OIL 1441 (501 W NATIONAL in WEST TERRE HAUTE, IN)
STATE MASTER (Indiana facility tracking) - CRTK-8355, EPCRA, LUST-199812502, LEAKING STORAGE TANK, UST-2955, UNDERGROUND STORAGE TANK PROGRAM Conditionally Exempt Small Quantity Generators, less than 100 kg/month of hazardous waste (Resource Conservation and Recovery Act (tracking hazardous waste)) - notification Organizations: CLARK OIL AND REFINING CORP (CONTACT/OWNER)
Alternative names: CLARK OIL STATION NO 1441
BUG MAN THE (RR 12 BOX 401 in WEST TERRE HAUTE, IN)
STATE MASTER (Indiana facility tracking) (Resource Conservation and Recovery Act (tracking hazardous waste))
MIDWEST EXCHANGE (29 W PARIS AVE in WEST TERRE HAUTE, IN)
STATE MASTER (Indiana facility tracking) (Resource Conservation and Recovery Act (tracking hazardous waste)) Organizations: MURPHY DENNIS (CONTACT/OWNER)
CAE ENGINES (6951 W CONCANNON AVE in WEST TERRE HAUTE, IN)
STATE MASTER (Indiana facility tracking) Conditionally Exempt Small Quantity Generators, less than 100 kg/month of hazardous waste (Resource Conservation and Recovery Act (tracking hazardous waste)) Business NAICS classification: ALL OTHER AUTOMOTIVE REPAIR AND MAINTENANCE.
BGT GREEN VALLEY PROJECT, LLC (4004 W. CONCANNON AVENUE in WEST TERRE HAUTE, IN)
AIR MINOR (AIRS/AFS) Business SIC classification: ELECTRIC AND OTHER SERVICES COMBINED
MACKSVILLE STATION (601 NATIONAL AVE in WEST TERRE HAUTE, IN)
STATE MASTER (Indiana facility tracking) Conditionally Exempt Small Quantity Generators, less than 100 kg/month of hazardous waste (Resource Conservation and Recovery Act (tracking hazardous waste))
ALTERNATE FUELS (4004 CONCANNON ROAD in WEST TERRE HAUTE, IN)
AIR MAJOR (AIRS/AFS) STATE MASTER (Indiana facility tracking) Business SIC classification: NONCLASSIFIABLE ESTABLISHMENTS
GREEN VALLEY MINE (AMS) (UNDERGROUND in SANDFORD, IN)
SUPERFUND (Superfund database) STATE MASTER (Indiana facility tracking)
Housing units lacking complete plumbing facilities: 1.8% Housing units lacking complete kitchen facilities: 3.0%
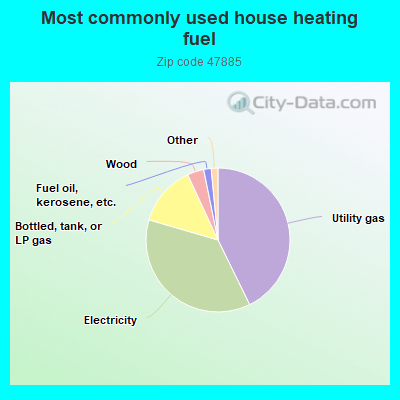
42.8%Utility gas
36.8%Electricity
13.6%Bottled, tank, or LP gas
3.7%Wood
1.7%Fuel oil, kerosene, etc.
0.8%No fuel used
0.8%Other fuel
Population in 1990: 11,459.
Place of birth for U.S.-born residents:
This state: 7,954
Northeast: 111
Midwest: 825
South: 210
West: 103
65% of the 47885 zip code residents lived in the same house 5 years ago. Out of people who lived in different houses, 81% lived in this county. Out of people who lived in different counties, 50% lived in Indiana.
97% of the 47885 zip code residents lived in the same house 1 year ago. Out of people who lived in different houses, 87% moved from this county. Out of people who lived in different houses, 17% moved from different county within same state. Out of people who lived in different houses, 11% moved from different state.
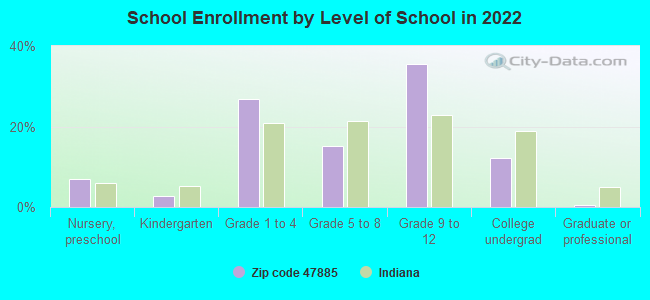
Private vs. public school enrollment:
Students in private schools in grades 1 to 8 (elementary and middle school): 132
Here:
14.0%
Indiana:
14.9%
Students in private schools in grades 9 to 12 (high school): 3
Here:
0.5%
Indiana:
11.4%
Students in private undergraduate colleges: 5
Here:
2.1%
Indiana:
22.3%
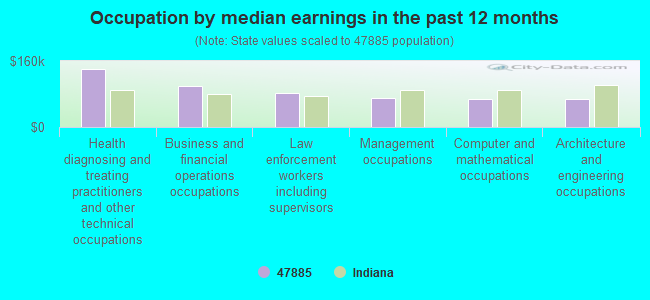
Occupation by median earnings in the past 12 months ($)
140,001Health diagnosing and treating practitioners and other technical occupations
99,170Business and financial operations occupations
83,296Law enforcement workers including supervisors
70,331Management occupations
68,076Computer and mathematical occupations
67,068Architecture and engineering occupations
Top industries in this zip code by the number of employees in 2005:
Utilities: Fossil Fuel Electric Power Generation (50-99 employees: 1 establishment)
Utilities: Electric Power Distribution (20-49: 1, 10-19: 2, 5-9: 1)
2002 - 2018 National Fire Incident Reporting System (NFIRS) incidents
Based on the data from the years 2002 - 2018 the average number of fires per year is 70. The highest number of reported fire incidents - 130 took place in 2003, and the least - 7 in 2014. The data has an increasing trend.
When looking into fire subcategories, the most incidents belonged to: Structure Fires (45.3%), and Outside Fires (34.5%).
Fire incident types reported to NFIRS in Zip Code 47885


 Nearest zip codes: 47876, 47809, 47863, 47807, 47804, 47884.


 Based on the data from the years 2002 - 2018 the average number of fires per year is 70. The highest number of reported fire incidents - 130 took place in 2003, and the least - 7 in 2014. The data has an increasing trend.
 When looking into fire subcategories, the most incidents belonged to: Structure Fires (45.3%), and Outside Fires (34.5%).