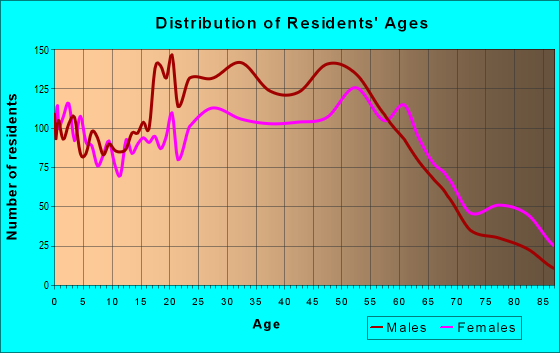
Estimated zip code population in 2022: 15,641 Zip code population in 2010: 16,305 Zip code population in 2000: 17,739
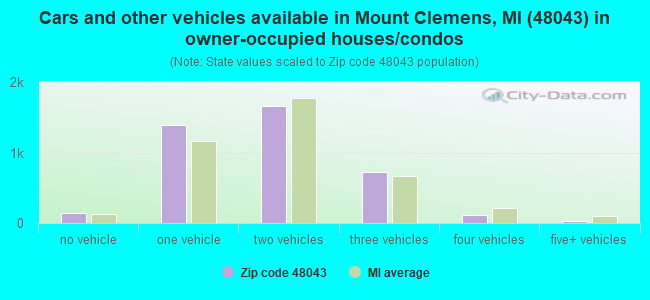
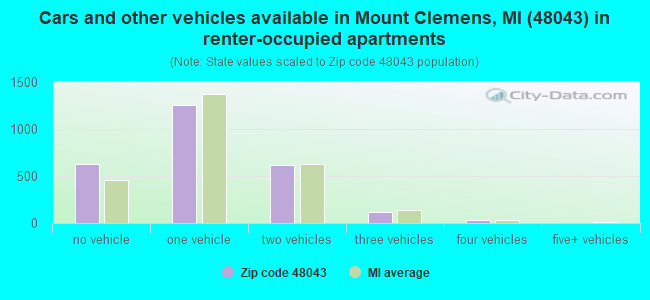
Houses and condos: 6,925 Renter-occupied apartments: 2,654
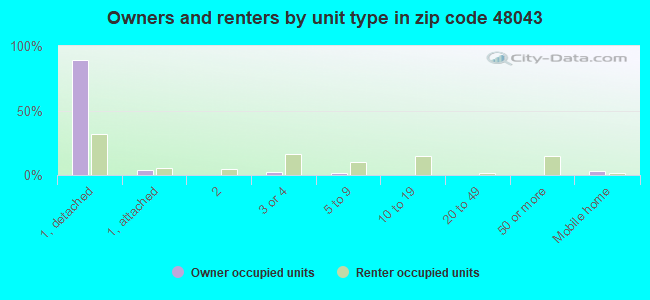
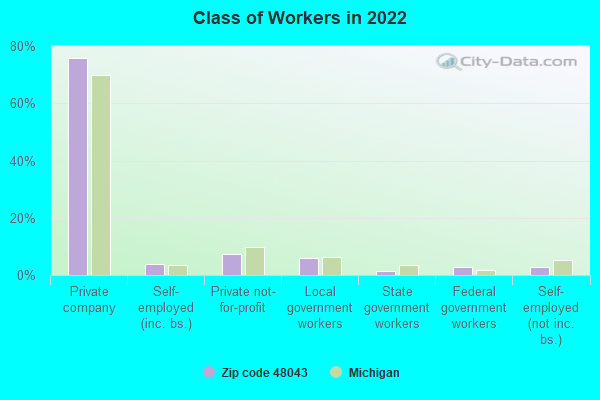
% of renters here:
40%
State:
27%
March 2022 cost of living index in zip code 48043: 95.0 (less than average, U.S. average is 100)
Land area: 4.1 sq. mi. Water area: 0.1 sq. mi.
Population density: 3,816 people per square mile
(average).
OSM Map
General Map
Google Map
MSN Map
OSM Map
General Map
Google Map
MSN Map
OSM Map
General Map
Google Map
MSN Map
OSM Map
General Map
Google Map
MSN Map
Please wait while loading the map...
Real estate property taxes paid for housing units in 2022:
This zip code:
1.7% ($2,796)
Michigan:
1.2% ($2,746)
Median real estate property taxes paid for housing units with mortgages in 2022: $2,915 (1.8%) Median real estate property taxes paid for housing units with no mortgage in 2022: $2,644 (1.5%)
Averages for the 2020 tax year for zip code 48043, filed in 2021:
Average Adjusted Gross Income (AGI) in 2020: $43,544 (Individual Income Tax Returns)
Here:
$43,544
State:
$68,945
Salary/wage: $40,049 (reported on 78.6% of returns)
Here:
$40,049
State:
$57,142
(% of AGI for various income ranges: 943.4% for AGIs below $25k, 3370.7% for AGIs $25k-50k, 6284.7% for AGIs $50k-75k, 10000.2% for AGIs $75k-100k, 15957.8% for AGIs $100k-200k, 62710.0% for AGIs over 200k)
Taxable interest for individuals: $638 (reported on 20.6% of returns)
This zip code:
$638
Michigan:
$1,630
(% of AGI for various income ranges: 7.2% for AGIs below $25k, 7.1% for AGIs $25k-50k, 15.7% for AGIs $50k-75k, 31.8% for AGIs $75k-100k, 105.6% for AGIs $100k-200k, 555.0% for AGIs over 200k)
Ordinary dividends: $2,825 (reported on 11.1% of returns)
Here:
$2,825
State:
$6,972
(% of AGI for various income ranges: 10.6% for AGIs below $25k, 23.7% for AGIs $25k-50k, 34.6% for AGIs $50k-75k, 69.0% for AGIs $75k-100k, 207.8% for AGIs $100k-200k, 2375.0% for AGIs over 200k)
Net capital gain/loss in AGI: +$6,572 (reported on 9.9% of returns)
Here:
+$6,572
State:
+$20,064
(% of AGI for various income ranges: 3.1% for AGIs below $25k, 16.5% for AGIs $25k-50k, 20.4% for AGIs $50k-75k, 123.2% for AGIs $75k-100k, 413.1% for AGIs $100k-200k, 12600.0% for AGIs over 200k)
Profit/loss from business: +$6,109 (reported on 14.4% of returns)
Here:
+$6,109
State:
+$11,172
(% of AGI for various income ranges: 66.9% for AGIs below $25k, 85.5% for AGIs $25k-50k, 93.6% for AGIs $50k-75k, 211.0% for AGIs $75k-100k, 642.8% for AGIs $100k-200k)
Taxable individual retirement arrangement distribution: $12,794 (reported on 6.3% of returns)
48043:
$12,794
Michigan:
$19,803
(% of AGI for various income ranges: 33.9% for AGIs below $25k, 55.1% for AGIs $25k-50k, 112.0% for AGIs $50k-75k, 220.2% for AGIs $75k-100k, 785.0% for AGIs $100k-200k)
Total itemized deductions: $23,977 (reported on 3.5% of returns)
Here:
$23,977
State:
$34,117
(% of AGI for various income ranges: 19.6% for AGIs below $25k, 63.5% for AGIs $25k-50k, 134.0% for AGIs $50k-75k, 308.0% for AGIs $75k-100k, 734.1% for AGIs $100k-200k)
Charity contributions: $7,155 (reported on 2.7% of returns)
Here:
$7,155
State:
$13,548
(% of AGI for various income ranges: 17.6% for AGIs $25k-50k, 23.5% for AGIs $50k-75k, 43.0% for AGIs $75k-100k, 234.4% for AGIs $100k-200k)
Taxes paid: $6,812 (reported on 3.5% of returns)
48043:
$6,812
State:
$7,972
(% of AGI for various income ranges: 3.9% for AGIs below $25k, 12.5% for AGIs $25k-50k, 39.5% for AGIs $50k-75k, 102.8% for AGIs $75k-100k, 227.8% for AGIs $100k-200k)
Earned income credit: $2,102 (reported on 18.9% of returns)
Here:
$2,102
State:
$2,251
(% of AGI for various income ranges: 88.9% for AGIs below $25k, 62.1% for AGIs $25k-50k)
Percentage of individuals using paid preparers for their 2020 taxes: 93.4%
Here:
93%
State:
93%
(% for various income ranges: 93.6% for AGIs below $25k, 93.7% for AGIs $25k-50k, 92.7% for AGIs $50k-75k, 94.8% for AGIs $75k-100k, 90.7% for AGIs $100k-200k, 100.0% for AGIs over 200k)
Averages for the 2012 tax year for zip code 48043, filed in 2013:
Average Adjusted Gross Income (AGI) in 2012: $37,566 (Individual Income Tax Returns)
Here:
$37,566
State:
$55,609
Salary/wage: $35,476 (reported on 80.3% of returns)
Here:
$35,476
State:
$46,782
(% of AGI for various income ranges: 69.3% for AGIs below $25k, 78.8% for AGIs $25k-50k, 79.4% for AGIs $50k-75k, 78.1% for AGIs $75k-100k, 75.2% for AGIs $100k-200k, 70.4% for AGIs over 200k)
Taxable interest for individuals: $1,055 (reported on 23.2% of returns)
This zip code:
$1,055
Michigan:
$1,491
(% of AGI for various income ranges: 0.8% for AGIs below $25k, 0.5% for AGIs $25k-50k, 0.5% for AGIs $50k-75k, 0.3% for AGIs $75k-100k, 0.7% for AGIs $100k-200k, 1.3% for AGIs over 200k)
Ordinary dividends: $2,841 (reported on 12.8% of returns)
Here:
$2,841
State:
$6,225
(% of AGI for various income ranges: 0.8% for AGIs below $25k, 0.8% for AGIs $25k-50k, 0.7% for AGIs $50k-75k, 0.9% for AGIs $75k-100k, 1.5% for AGIs $100k-200k, 1.3% for AGIs over 200k)
Net capital gain/loss in AGI: +$3 (reported on 9.1% of returns)
Here:
+$3
State:
+$9,326
(% of AGI for various income ranges: 0.2% for AGIs $100k-200k, 0.1% for AGIs over 200k)
Profit/loss from business: +$7,851 (reported on 14.0% of returns)
Here:
+$7,851
State:
+$11,523
(% of AGI for various income ranges: 9.7% for AGIs below $25k, 2.1% for AGIs $25k-50k, 1.7% for AGIs $50k-75k, 1.6% for AGIs $75k-100k, 1.6% for AGIs $100k-200k)
Taxable individual retirement arrangement distribution: $10,805 (reported on 8.7% of returns)
48043:
$10,805
Michigan:
$15,298
(% of AGI for various income ranges: 2.3% for AGIs below $25k, 2.0% for AGIs $25k-50k, 1.9% for AGIs $50k-75k, 3.3% for AGIs $75k-100k, 4.5% for AGIs $100k-200k)
Total itemized deductions: $16,193 (21% of AGI, reported on 22.4% of returns)
Here:
$16,193
State:
$21,628
Here:
21.2% of AGI
State:
18.4% of AGI
(% of AGI for various income ranges: 6.9% for AGIs below $25k, 7.9% for AGIs $25k-50k, 9.6% for AGIs $50k-75k, 11.2% for AGIs $75k-100k, 12.3% for AGIs $100k-200k, 11.5% for AGIs over 200k)
Charity contributions: $3,209 (reported on 18.9% of returns)
Here:
$3,209
State:
$4,225
(% of AGI for various income ranges: 0.9% for AGIs below $25k, 1.2% for AGIs $25k-50k, 1.4% for AGIs $50k-75k, 2.0% for AGIs $75k-100k, 2.2% for AGIs $100k-200k, 2.8% for AGIs over 200k)
Taxes paid: $5,559 (reported on 22.4% of returns)
48043:
$5,559
State:
$8,327
(% of AGI for various income ranges: 1.4% for AGIs below $25k, 2.2% for AGIs $25k-50k, 3.2% for AGIs $50k-75k, 3.9% for AGIs $75k-100k, 4.9% for AGIs $100k-200k, 5.9% for AGIs over 200k)
Earned income credit: $2,293 (reported on 24.1% of returns)
Here:
$2,293
State:
$2,306
(% of AGI for various income ranges: 7.7% for AGIs below $25k, 0.9% for AGIs $25k-50k)
Percentage of individuals using paid preparers for their 2012 taxes: 55.8%
Here:
56%
State:
57%
(% for various income ranges: 52.6% for AGIs below $25k, 57.3% for AGIs $25k-50k, 61.6% for AGIs $50k-75k, 60.0% for AGIs $75k-100k, 59.0% for AGIs $100k-200k, 80.0% for AGIs over 200k)
Averages for the 2004 tax year for zip code 48043, filed in 2005:
Average Adjusted Gross Income (AGI) in 2004: $37,219 (Individual Income Tax Returns)
Here:
$37,219
State:
$48,204
Salary/wage: $35,100 (reported on 84.5% of returns)
Here:
$35,100
State:
$42,791
(% of AGI for various income ranges: 78.6% for AGIs below $10k, 73.7% for AGIs $10k-25k, 82.7% for AGIs $25k-50k, 83.9% for AGIs $50k-75k, 84.6% for AGIs $75k-100k, 71.5% for AGIs over 100k)
Taxable interest for individuals: $1,169 (reported on 38.1% of returns)
This zip code:
$1,169
Michigan:
$1,725
(% of AGI for various income ranges: 4.2% for AGIs below $10k, 1.8% for AGIs $10k-25k, 0.9% for AGIs $25k-50k, 0.9% for AGIs $50k-75k, 0.9% for AGIs $75k-100k, 1.4% for AGIs over 100k)
Taxable dividends: $2,024 (reported on 18.4% of returns)
Here:
$2,024
State:
$3,420
(% of AGI for various income ranges: 1.9% for AGIs below $10k, 1.3% for AGIs $10k-25k, 0.6% for AGIs $25k-50k, 1.1% for AGIs $50k-75k, 0.5% for AGIs $75k-100k, 1.3% for AGIs over 100k)
Net capital gain/loss: +$4,387 (reported on 13.1% of returns)
Here:
+$4,387
State:
+$8,532
(% of AGI for various income ranges: -1.3% for AGIs below $10k, -0.1% for AGIs $10k-25k, 0.2% for AGIs $25k-50k, 0.8% for AGIs $50k-75k, 0.7% for AGIs $75k-100k, 5.7% for AGIs over 100k)
Profit/loss from business: +$7,465 (reported on 11.8% of returns)
Here:
+$7,465
State:
+$9,547
(% of AGI for various income ranges: 10.5% for AGIs below $10k, 4.1% for AGIs $10k-25k, 1.8% for AGIs $25k-50k, 1.7% for AGIs $50k-75k, 1.8% for AGIs $75k-100k, 2.3% for AGIs over 100k)
IRA payment deduction: $2,550 (reported on 1.4% of returns)
48043:
$2,550
Michigan:
$2,875
(% of AGI for various income ranges: 0.1% for AGIs $10k-25k, 0.2% for AGIs $25k-50k, 0.1% for AGIs $50k-75k, 0.1% for AGIs $75k-100k)
Self-employed pension: $10,545 (reported on 0.2% of returns)
Here:
$10,545
Michigan:
$13,826
Total itemized deductions: $14,895 (23% of AGI, reported on 34.8% of returns)
Here:
$14,895
State:
$18,509
Here:
23.1% of AGI
State:
20.7% of AGI
(% of AGI for various income ranges: 13.4% for AGIs below $10k, 9.3% for AGIs $10k-25k, 13.6% for AGIs $25k-50k, 15.7% for AGIs $50k-75k, 15.0% for AGIs $75k-100k, 14.4% for AGIs over 100k)
Charity contributions deductions: $2,460 (4% of AGI, reported on 30.8% of returns)
Here:
$2,460
State:
$3,365
Here:
3.6% of AGI
State:
3.6% of AGI
(% of AGI for various income ranges: 0.9% for AGIs below $10k, 1.1% for AGIs $10k-25k, 1.6% for AGIs $25k-50k, 2.2% for AGIs $50k-75k, 2.3% for AGIs $75k-100k, 2.8% for AGIs over 100k)
Total tax: $5,147 (reported on 74.2% of returns)
48043:
$5,147
State:
$7,691
(% of AGI for various income ranges: 2.7% for AGIs below $10k, 4.2% for AGIs $10k-25k, 7.7% for AGIs $25k-50k, 9.3% for AGIs $50k-75k, 11.0% for AGIs $75k-100k, 17.9% for AGIs over 100k)
Earned income credit: $1,558 (reported on 17.7% of returns)
Here:
$1,558
State:
$1,737
Percentage of individuals using paid preparers for their 2004 taxes: 62.2%
Here:
62%
State:
60%
(% for various income ranges: 59.1% for AGIs below $10k, 64.5% for AGIs $10k-25k, 60.6% for AGIs $25k-50k, 62.6% for AGIs $50k-75k, 65.1% for AGIs $75k-100k, 68.2% for AGIs over 100k)
Likely homosexual households (counted as self-reported same-sex unmarried-partner households)
Lesbian couples: 0.2% of all households
Gay men: 0.5% of all households
Household received Food Stamps/SNAP in the past 12 months: 1,444 Household did not receive Food Stamps/SNAP in the past 12 months: 5,311
Women who had a birth in the past 12 months: 192 (176 now married, 19 unmarried) Women who did not have a birth in the past 12 months: 3,509 (1,045 now married, 2,471 unmarried)
Housing units in zip code 48043 with a mortgage: 2,398 (138 second mortgage, 2 home equity loan, 122 both second mortgage and home equity loan) Houses without a mortgage: 208
Median monthly owner costs for units with a mortgage: $1,246 Median monthly owner costs for units without a mortgage: $542
Residents with income below the poverty level in 2022:
This zip code:
16.8%
Whole state:
13.4%
Residents with income below 50% of the poverty level in 2022:
This zip code:
11.1%
Whole state:
6.9%
Median number of rooms in houses and condos:
Here:
6.1
State:
6.5
Median number of rooms in apartments:
Here:
4.0
State:
4.3
Notable locations in this zip code not listed on our city pages
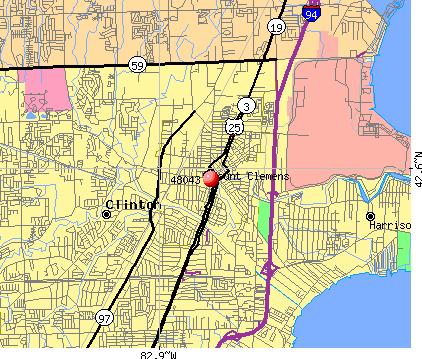
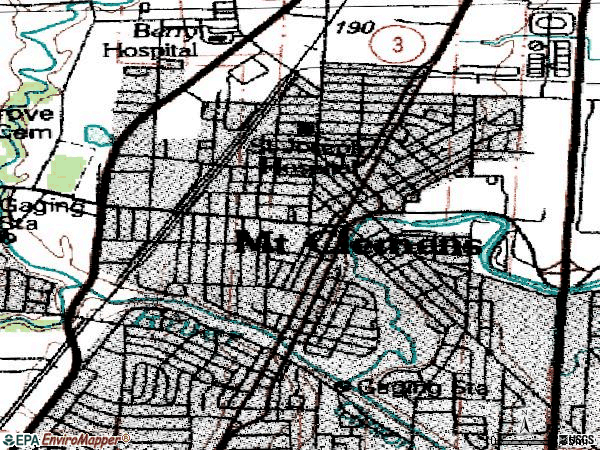
Notable locations in zip code 48043: Mount Clemens Station (A), Macomb County Courthouse (B), Crocker House Museum (C), Macomb County Administration Building (D), Macomb County Sheriff Department (E), Mount Clemens Police Department (F), Mount Clemens Public Library (G), Michigan Transit Museum (H), Byron Stuck Medical Library (I), Clemens Medical Center (J), Mount Clemens Fire Department (K). Display/hide their locations on the map
Shopping Centers: Clemens Center Shopping Center (1), Gibraltar Trade Center North Shopping Center (2), Farmer Jack Shopping Center (3). Display/hide their locations on the map
Churches in zip code 48043 include: North Broadway Church of Christ (A), Zion Temple Church in Jesus (B), Mount Clemens Apostolic Church (C), Christian Lighthouse Church (D), Cornelius First Seventh-Day Adventist Church (E), Zion United Church of Christ (F), Saint Peter's Catholic Church (G), First United Methodist Church (H), Calvary Missionary Baptist Church (I). Display/hide their locations on the map
Parks in zip code 48043 include: Shady Side Park (1), Alexander Macomb Historical Marker (2), Carnegie Library Historical Marker (3), Crocker House Historical Marker (4), Grace Episcopal Church Historical Marker (5), Methodist Episcopal Church Historical Marker (6), Mount Clemens Mineral Bath Industry Historical Marker (7), Saint Joseph Sanitarium and Bath House Historical Marker (8), Saint Mary's School Historical Marker (9). Display/hide their locations on the map
1,421 married couples with children.
1,056 single-parent households (312 men, 744 women).
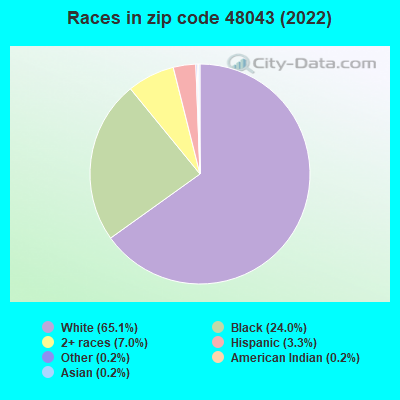
95.8% of residents of 48043 zip code speak English at home.
2.1% of residents speak Spanish at home (53% very well, 34% well, 9% not well, 3% not at all).
1.3% of residents speak other Indo-European language at home (64% very well, 32% well, 4% not well).
0.1% of residents speak Asian or Pacific Island language at home (82% very well, 18% not at all).
0.2% of residents speak other language at home (100% very well).
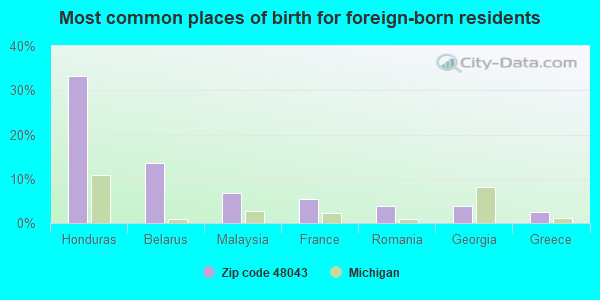
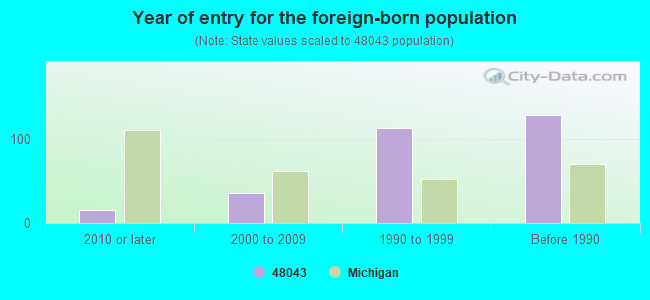
Foreign born population: 283 (1.8%) (65.7% of them are naturalized citizens)
Major facilities with environmental interests located in this zip code:
DU PONT MOUNT CLEMENS PLANT (400 GROESBECK HIGHWAY in MOUNT CLEMENS, MI)
AIR MAJOR (AIRS/AFS) (Integrated Compliance Information System) - ICIS-05-2005-0039, ENFORCEMENT/COMPLIANCE ACTIVITY FORMAL ENFORCEMENT ACTION (Integrated Compliance Information System) - ICIS-05-2005-0039, ENFORCEMENT/COMPLIANCE ACTIVITY COMPLIANCE ACTIVITY (Tracking inspections of insecticide, fungicide, and rodenticide, and toxic substances) CRITERIA AND HAZARDOUS AIR POLLUTANT INVENTORY (Inventory of air pollution sources) PERFORMANCE TRACK (National Environmental Performance Track) HAZARDOUS WASTE BIENNIAL REPORTER (Resource Conservation and Recovery Act (tracking hazardous waste)) Large Quantity Generators, more that 1000 kg of hazardous waste/month (Resource Conservation and Recovery Act (tracking hazardous waste)) TRI REPORTER (Tracking of toxic chemicals releasing facilities) Business SIC classification: PLASTICS MATERIALS, SYNTHETIC RESINS, AND NONVULCANIZABLE ELASTOMERS; PAINTS, VARNISHES, LACQUERS, ENAMELS, AND ALLIED PRODUCTS Business NAICS classification: PLASTICS MATERIAL AND RESIN MANUFACTURING.; PAINT AND COATING MANUFACTURING. Organizations: FORD MOTOR CO (CONTACT/OPERATOR)
, EI DUPONT DE NEMOURS AND CO (CONTACT/OWNER)
, EL DUPONT DE NEMOUR (CONTACT/OWNER)
Alternative names: DUPONT MOUNT CLEMENS FACILITY, DUPONT MT. CLEMENS FACILITY, DuPont Mt Clemens Plant , DUPONT PERFORMANCE COATINGS, E I DU PONT DE NEMOURS & CO, E.I. DUPONT DE NEMOURS & CO INC.
FORD MOTOR COMPANY MOUNT CLEMENS PLASTICS (151 LAFAYETTE AVENUE in MOUNT CLEMENS, MI)
(Integrated Compliance Information System) - ICIS-05-1984-0039, FORMAL ENFORCEMENT ACTION COMPLIANCE ACTIVITY (Tracking inspections of insecticide, fungicide, and rodenticide, and toxic substances) TSD (Resource Conservation and Recovery Act (tracking hazardous waste)) TRI REPORTER (Tracking of toxic chemicals releasing facilities) Business SIC classification: MOTOR VEHICLE PARTS AND ACCESSORIES Business NAICS classification: PLASTICS MATERIAL AND RESIN MANUFACTURING. Alternative names: FORD MOTOR CO. MOUNT CLEMENS PLASTICS PLANT, FORD MOTOR CO MT CLEMENS PLASTICS PLT
ENMANCO CORP (345 GROESBECK HWY in MOUNT CLEMENS, MI)
(Integrated Compliance Information System) - ICIS-05-1994-0123, FORMAL ENFORCEMENT ACTION (Resource Conservation and Recovery Act (tracking hazardous waste)) Business SIC classification: LOCAL TRUCKING WITHOUT STORAGE; REFUSE SYSTEMS Business NAICS classification: SOLID WASTE LANDFILL.
GEORGE WASHINGTON SCHOOL (196 N. ROSE STREET in MT. CLEMENS, MI)
(National Center for Education Statistics) - STATE ID-01393 Organizations: MT. CLEMENS COMMUNITY SCHOOL DISTRICT (SCHOOL DISTRICT)
EMHART CORPORATION (50501 E RUSSELL SCHMIDT in MOUNT CLEMENS, MI)
AIR MINOR (AIRS/AFS) (Resource Conservation and Recovery Act (tracking hazardous waste)) Business SIC classification: ADHESIVES AND SEALANTS; LUBRICATING OILS AND GREASES Organizations: CHESTERFIELD ASSOC (CONTACT/OWNER)
Alternative names: EMHART CORP WARREN DIV
CHIPPEWA VALLEY SCHOOLS (19120 CASS in MOUNT CLEMENS, MI)
COMPLIANCE ACTIVITY (Tracking inspections of insecticide, fungicide, and rodenticide, and toxic substances) (Resource Conservation and Recovery Act (tracking hazardous waste)) Organizations: CHIPPEWA VALLEY PUBLIC SCHOOLS (CONTACT/OPERATOR)
BENDIX CORP A&M DIV (118 N GROESBECK HWY in MOUNT CLEMENS, MI)
AFFORDABLE SELF STORAGE (24651 N RIVER RD in MOUNT CLEMENS, MI)
(Resource Conservation and Recovery Act (tracking hazardous waste)) Organizations: FIRST STATE BANK OF EAST DETROIT (CONTACT/OWNER)
AMOCO OIL CO 16814 SUNNYS (116 S GRATIOT AND CHURCH in MOUNT CLEMENS, MI)
(Resource Conservation and Recovery Act (tracking hazardous waste)) Organizations: AMOCO OIL COMPANY (CONTACT/OWNER)
Housing units lacking complete plumbing facilities: 0.4% Housing units lacking complete kitchen facilities: 0.7%
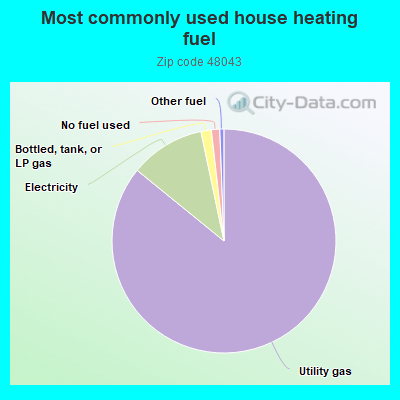
85.7%Utility gas
10.8%Electricity
1.5%Bottled, tank, or LP gas
1.2%No fuel used
0.6%Other fuel
Population in 1990: 67,489.
Place of birth for U.S.-born residents:
This state: 12,904
Northeast: 217
Midwest: 704
South: 1,062
West: 422
57% of the 48043 zip code residents lived in the same house 5 years ago. Out of people who lived in different houses, 67% lived in this county. Out of people who lived in different counties, 50% lived in Michigan.
83% of the 48043 zip code residents lived in the same house 1 year ago. Out of people who lived in different houses, 66% moved from this county. Out of people who lived in different houses, 23% moved from different county within same state. Out of people who lived in different houses, 6% moved from different state. Out of people who lived in different houses, 0% moved from abroad.
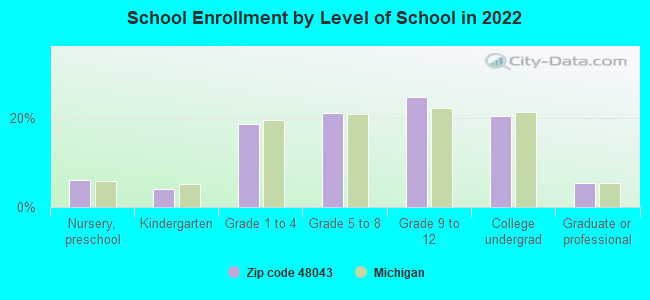
Private vs. public school enrollment:
Students in private schools in grades 1 to 8 (elementary and middle school): 26
Here:
2.2%
Michigan:
12.4%
Students in private schools in grades 9 to 12 (high school): 104
Here:
13.7%
Michigan:
9.8%
Students in private undergraduate colleges: 34
Here:
5.5%
Michigan:
14.9%
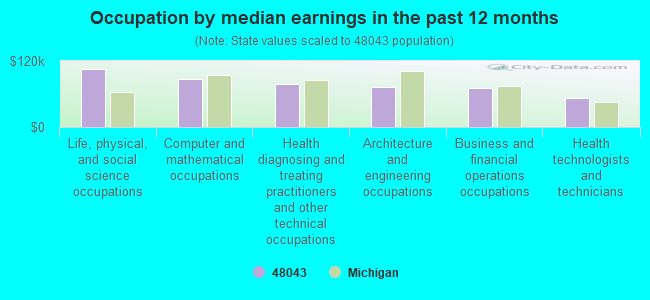
Occupation by median earnings in the past 12 months ($)
105,916Life, physical, and social science occupations
87,206Computer and mathematical occupations
78,108Health diagnosing and treating practitioners and other technical occupations
72,667Architecture and engineering occupations
71,557Business and financial operations occupations
51,983Health technologists and technicians
Companies with biggest federal contracts located in this zip code (MOUNT CLEMENS, MI):
INDUSTRIAL METAL SALES (95 SOUTHROSE ST; small business) : $131,264 in 11 contractsfrom 2005 to 2006
Contracts for Bars and Rods, Plate, Sheet, Strip, Foil; and Leaf, Pipe, Tube and Rigid Tubing by Army Signed by year:2000: $0; 2001: $0; 2002: $0; 2003: $0; 2004: $0; 2005: $96,759; 2006: $34,505.
Biggest contracts:
$32,437 with Army for Bars and Rods. Signed on 2006-05-01. Completion date: 2006-07-28.
$29,300 with Army for Plate, Sheet, Strip, Foil; and Leaf. Signed on 2005-03-25. Completion date: 2005-06-24.
$23,700 with Army for Bars and Rods. Signed on 2006-06-13. Completion date: 2006-07-01.
$21,769 with Army for Plate, Sheet, Strip, Foil; and Leaf. Signed on 2005-07-14. Completion date: 2005-08-04.
J W MITCHELL ENTERPRISESINC (162 LOIS LANE; small business) : $50,200 in 6 contractsfrom 2001 to 2002
Contracts for Training/Curriculum Development, Lectures For Training by Bureau of the Public Debt, Army Signed by year:2000: $0; 2001: $47,000; 2002: $3,200; 2003: $0; 2004: $0; 2005: $0; 2006: $0.
Biggest contracts:
$108,000 with Bureau of the Public Debt for Training/Curriculum Development. Taking place in WV. Signed on 2001-06-15. Completion date: 2002-05-15.
$25,000, same as above.Signed on 2001-04-15. Completion date: 2002-04-15.
$3,200 with Army for Lectures For Training. Signed on 2002-09-26. Completion date: 2002-09-26.
$1,000 with Bureau of the Public Debt for Training/Curriculum Development. Taking place in WV. Signed on 2001-09-15. Completion date: 2001-09-15.
HERBERT LUX OD PC (39 N WALNUT; small business) : $17,388 in 7 contractsfrom 2001 to 2003
Contracts for Optometry Services by Army Signed by year:2000: $0; 2001: $12,600; 2002: $7,377; 2003: -$2,589; 2004: $0; 2005: $0; 2006: $0.
Biggest contracts:
$8,010 with Army for Optometry Services. Taking place in KY. Signed on 2001-10-17. Completion date: 2002-09-30.
$8,010 with Army for Optometry Services. Signed on 2002-10-08. Completion date: 2003-09-30.
$4,590, same as above.Signed on 2001-10-17. Completion date: 2001-09-30.
$0, same as above.Signed on 2001-10-17. Completion date: 2001-09-30.
HM ENVIRONMENTAL SERVICES INC (287 N WILSON BLVD; small business)
$9,042 with Army for Oil Spill Response including Cleanup, Removal, Disposal and Operational Support. Signed on 2004-09-27. Completion date: 2004-10-15.
RIVERHOUSE CATERING & BANQUET (5 AMVET DR; small business)
$8,577 with Army for Food Services. Signed on 2000-07-20. Completion date: 2000-06-25.
PR MACHINING & PROTOTYPE, INC (39 N ROSE; small business)
$7,875 with Army for Hardware, Commercial. Signed on 2004-09-03. Completion date: 2004-09-29.
KELLEYSDRAPERIES INC (166 SOUTH MAIN ST; small business) : $7,623 in 2 contractsin 2002
$4,932 with Army for Draperies, Awnings, and Shades. Signed on 2002-05-17. Completion date: 2002-06-14.
$2,691, same as above.Signed on 2002-09-18. Completion date: 2002-10-16.
WEIGHT STATION FITNESS CENTERS (30 NORTH GROESBECK; small business)
$6,000 with Army for Miscellaneous Items. Signed on 2004-01-07. Completion date: 2004-09-30.
DETROIT CUSTOM SERVICES (150 N GROESBECK HWY; small business)
$4,724 with Army for Draperies, Awnings, and Shades. Signed on 2002-09-28. Completion date: 2002-10-18.
BAY AREA OFFICIAL ASSOCIATION (57 EASTMAN STREET; small business)
$3,000 with Army for Other Professional Services. Signed on 2004-01-29. Completion date: 2004-09-30.
Top industries in this zip code by the number of employees in 2005:
Health Care and Social Assistance: General Medical and Surgical Hospitals (over 1000 employees: 1 establishment)
Administrative and Support and Waste Management and Remediation Services: Janitorial Services (500-999: 1, 250-499: 1, 10-19: 2)
Administrative and Support and Waste Management and Remediation Services: Professional Employer Organizations (100-249: 5, 50-99: 1, 20-49: 1, 10-19: 1, 5-9: 1, 1-4: 1)
2002 - 2018 National Fire Incident Reporting System (NFIRS) incidents
Based on the data from the years 2002 - 2018 the average number of fire incidents per year is 90. The highest number of reported fire incidents - 117 took place in 2011, and the least - 68 in 2018. The data has a dropping trend.
When looking into fire subcategories, the most reports belonged to: Structure Fires (60.3%), and Outside Fires (24.0%).
Fire incident types reported to NFIRS in Zip Code 48043


 Nearest zip codes: 48036, 48035, 48038, 48045, 48082, 48044.


 Based on the data from the years 2002 - 2018 the average number of fire incidents per year is 90. The highest number of reported fire incidents - 117 took place in 2011, and the least - 68 in 2018. The data has a dropping trend.
 When looking into fire subcategories, the most reports belonged to: Structure Fires (60.3%), and Outside Fires (24.0%).