Estimated zip code population in 2022: 6,695 Zip code population in 2010: 5,753 Zip code population in 2000: 5,355
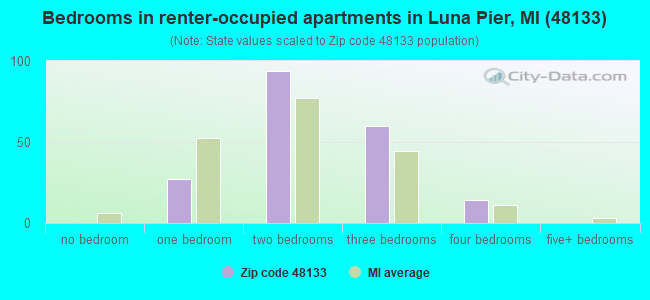
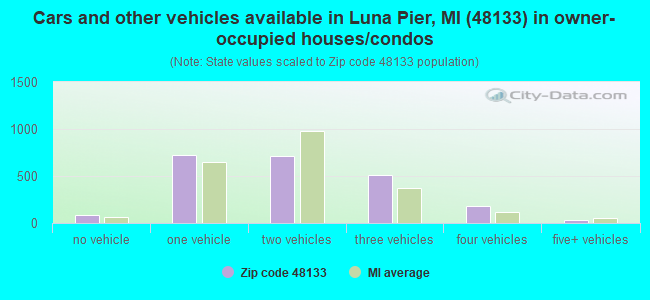
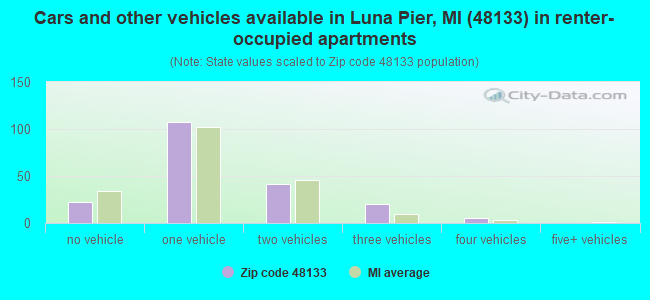
Houses and condos: 2,658 Renter-occupied apartments: 195
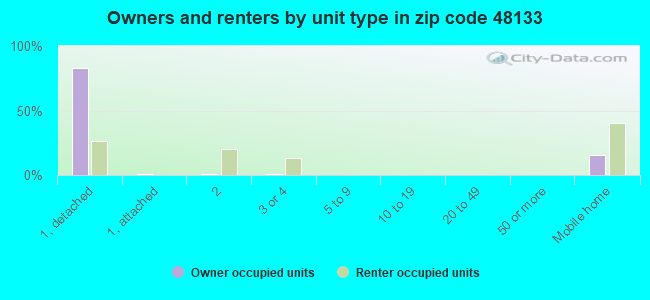
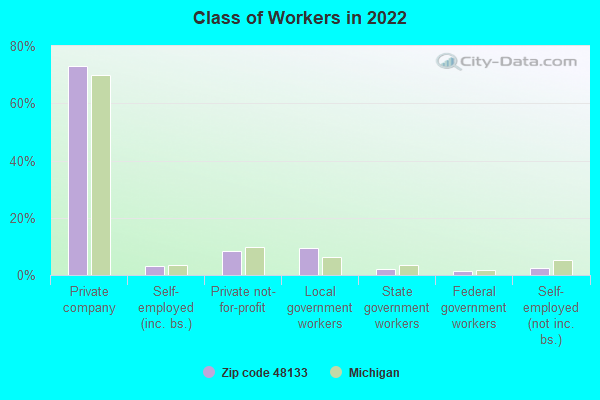
% of renters here:
8%
State:
27%
March 2022 cost of living index in zip code 48133: 90.5 (less than average, U.S. average is 100)
Land area: 26.9 sq. mi. Water area: 6.0 sq. mi.
Population density: 249 people per square mile
(very low).
OSM Map
General Map
Google Map
MSN Map
OSM Map
General Map
Google Map
MSN Map
OSM Map
General Map
Google Map
MSN Map
OSM Map
General Map
Google Map
MSN Map
Please wait while loading the map...
Real estate property taxes paid for housing units in 2022:
This zip code:
1.0% ($2,122)
Michigan:
1.2% ($2,746)
Median real estate property taxes paid for housing units with mortgages in 2022: $2,161 (1.0%) Median real estate property taxes paid for housing units with no mortgage in 2022: $2,087 (1.2%)
Business Search- 14 Million verified businesses
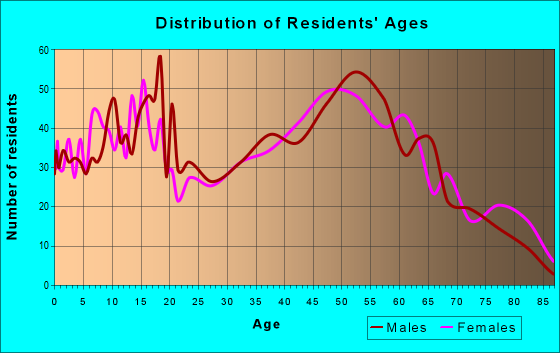
Males: 3,390
(50.6%)
Females: 3,304
(49.4%)
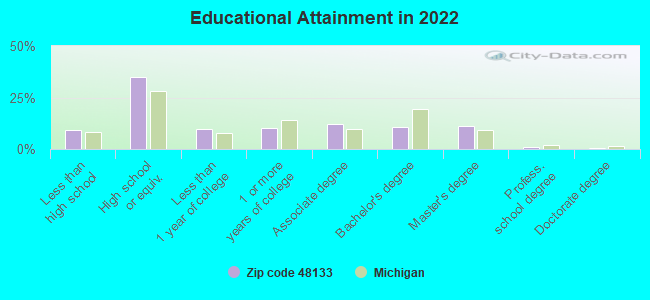
For population 25 years and over in 48133:
High school or higher: 90.4%
Bachelor's degree or higher: 23.4%
Graduate or professional degree: 12.8%
Unemployed: 9.4%
Mean travel time to work (commute): 26.8 minutes
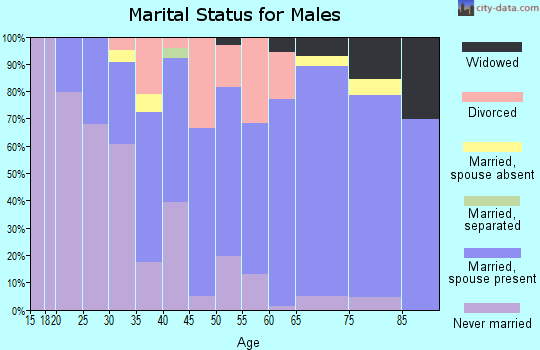
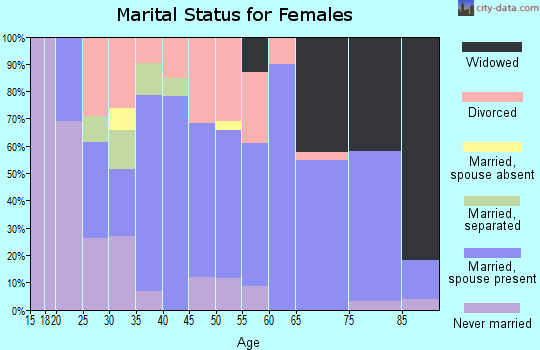
For population 15 years and over in 48133:
Never married: 31.1%
Now married: 53.1%
Separated: 0.1%
Widowed: 4.8%
Divorced: 10.8%
Zip code 48133 compared to state average:
Unemployed percentage above state average.
Black race population percentage significantly below state average.
Foreign-born population percentage significantly below state average.
Renting percentage significantly below state average.
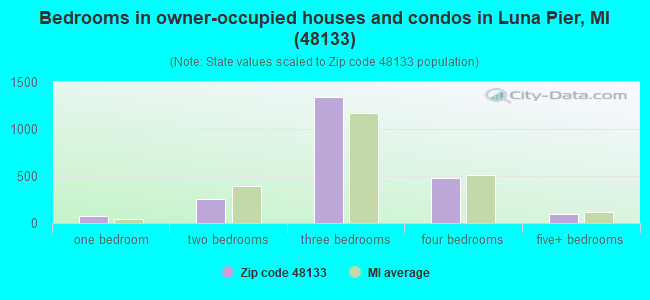
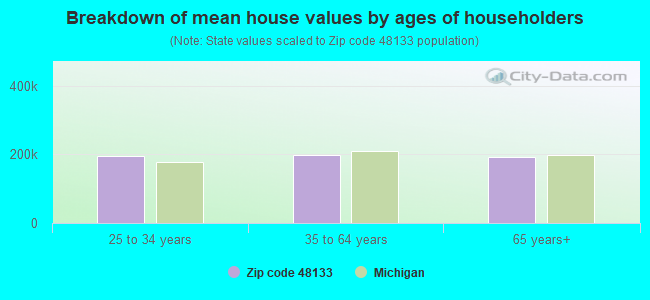
Estimated median house/condo value in 2022: $204,761
48133:
$204,761
Michigan:
$224,400
According to our research of Michigan and other state lists, there were 9 registered sex offenders living in 48133 zip code as of May 11, 2024. The ratio of all residents to sex offenders in zip code 48133 is 660 to 1. The ratio of registered sex offenders to all residents in this zip code is lower than the state average.
Median resident age:
This zip code:
39.1 years
Michigan median age:
40.3 years
Average household size:
This zip code:
2.8 people
Michigan:
2.4 people
Averages for the 2020 tax year for zip code 48133, filed in 2021:
Average Adjusted Gross Income (AGI) in 2020: $58,192 (Individual Income Tax Returns)
Here:
$58,192
State:
$68,945
Salary/wage: $52,419 (reported on 78.7% of returns)
Here:
$52,419
State:
$57,142
(% of AGI for various income ranges: 952.4% for AGIs below $25k, 3136.2% for AGIs $25k-50k, 6454.3% for AGIs $50k-75k, 9218.1% for AGIs $75k-100k, 14273.7% for AGIs $100k-200k)
Taxable interest for individuals: $749 (reported on 27.0% of returns)
This zip code:
$749
Michigan:
$1,630
(% of AGI for various income ranges: 12.9% for AGIs below $25k, 24.4% for AGIs $25k-50k, 35.3% for AGIs $50k-75k, 27.1% for AGIs $75k-100k, 33.7% for AGIs $100k-200k)
Ordinary dividends: $2,451 (reported on 16.3% of returns)
Here:
$2,451
State:
$6,972
(% of AGI for various income ranges: 25.2% for AGIs below $25k, 27.4% for AGIs $25k-50k, 47.0% for AGIs $50k-75k, 83.3% for AGIs $75k-100k, 123.7% for AGIs $100k-200k)
Net capital gain/loss in AGI: +$4,161 (reported on 13.7% of returns)
Here:
+$4,161
State:
+$20,064
(% of AGI for various income ranges: 7.6% for AGIs below $25k, 25.2% for AGIs $25k-50k, 37.7% for AGIs $50k-75k, 94.3% for AGIs $75k-100k, 264.1% for AGIs $100k-200k)
Profit/loss from business: +$10,170 (reported on 10.3% of returns)
Here:
+$10,170
State:
+$11,172
(% of AGI for various income ranges: 85.7% for AGIs below $25k, 75.6% for AGIs $25k-50k, 188.3% for AGIs $50k-75k, 88.1% for AGIs $75k-100k, 415.2% for AGIs $100k-200k)
Taxable individual retirement arrangement distribution: $15,804 (reported on 10.6% of returns)
48133:
$15,804
Michigan:
$19,803
(% of AGI for various income ranges: 59.7% for AGIs below $25k, 125.6% for AGIs $25k-50k, 168.7% for AGIs $50k-75k, 377.1% for AGIs $75k-100k, 797.4% for AGIs $100k-200k)
Total itemized deductions: $32,656 (reported on 3.4% of returns)
Here:
$32,656
State:
$34,117
(% of AGI for various income ranges: 309.0% for AGIs $50k-75k, 745.2% for AGIs $100k-200k)
Charity contributions: $6,271 (reported on 2.7% of returns)
Here:
$6,271
State:
$13,548
(% of AGI for various income ranges: 18.8% for AGIs $25k-50k, 127.8% for AGIs $100k-200k)
Taxes paid: $7,367 (reported on 3.4% of returns)
48133:
$7,367
State:
$7,972
(% of AGI for various income ranges: 65.3% for AGIs $50k-75k, 173.0% for AGIs $100k-200k)
Earned income credit: $2,117 (reported on 13.3% of returns)
Here:
$2,117
State:
$2,251
(% of AGI for various income ranges: 71.6% for AGIs below $25k, 65.2% for AGIs $25k-50k)
Percentage of individuals using paid preparers for their 2020 taxes: 93.5%
Here:
94%
State:
93%
(% for various income ranges: 92.7% for AGIs below $25k, 93.7% for AGIs $25k-50k, 93.2% for AGIs $50k-75k, 93.5% for AGIs $75k-100k, 94.7% for AGIs $100k-200k, 100.0% for AGIs over 200k)
Averages for the 2012 tax year for zip code 48133, filed in 2013:
Average Adjusted Gross Income (AGI) in 2012: $48,372 (Individual Income Tax Returns)
Here:
$48,372
State:
$55,609
Salary/wage: $43,725 (reported on 84.6% of returns)
Here:
$43,725
State:
$46,782
(% of AGI for various income ranges: 64.0% for AGIs below $25k, 73.6% for AGIs $25k-50k, 77.5% for AGIs $50k-75k, 77.8% for AGIs $75k-100k, 84.2% for AGIs $100k-200k, 62.1% for AGIs over 200k)
Taxable interest for individuals: $846 (reported on 30.7% of returns)
This zip code:
$846
Michigan:
$1,491
(% of AGI for various income ranges: 1.2% for AGIs below $25k, 0.6% for AGIs $25k-50k, 0.4% for AGIs $50k-75k, 0.5% for AGIs $75k-100k, 0.3% for AGIs $100k-200k, 1.1% for AGIs over 200k)
Ordinary dividends: $2,040 (reported on 16.1% of returns)
Here:
$2,040
State:
$6,225
(% of AGI for various income ranges: 1.2% for AGIs below $25k, 0.7% for AGIs $25k-50k, 0.8% for AGIs $50k-75k, 0.5% for AGIs $75k-100k, 0.7% for AGIs $100k-200k)
Profit/loss from business: +$7,690 (reported on 11.6% of returns)
Here:
+$7,690
State:
+$11,523
(% of AGI for various income ranges: 6.0% for AGIs below $25k, 1.5% for AGIs $25k-50k, 2.3% for AGIs $50k-75k, 1.2% for AGIs $75k-100k, 1.2% for AGIs $100k-200k)
Taxable individual retirement arrangement distribution: $9,918 (reported on 10.5% of returns)
48133:
$9,918
Michigan:
$15,298
(% of AGI for various income ranges: 4.1% for AGIs below $25k, 2.1% for AGIs $25k-50k, 2.5% for AGIs $50k-75k, 1.8% for AGIs $75k-100k, 2.0% for AGIs $100k-200k)
Total itemized deductions: $17,334 (19% of AGI, reported on 26.6% of returns)
Here:
$17,334
State:
$21,628
Here:
19.3% of AGI
State:
18.4% of AGI
(% of AGI for various income ranges: 5.1% for AGIs below $25k, 6.9% for AGIs $25k-50k, 9.0% for AGIs $50k-75k, 11.3% for AGIs $75k-100k, 11.7% for AGIs $100k-200k, 10.0% for AGIs over 200k)
Charity contributions: $2,434 (reported on 21.7% of returns)
Here:
$2,434
State:
$4,225
(% of AGI for various income ranges: 0.6% for AGIs below $25k, 0.6% for AGIs $25k-50k, 1.0% for AGIs $50k-75k, 1.1% for AGIs $75k-100k, 1.6% for AGIs $100k-200k, 1.2% for AGIs over 200k)
Taxes paid: $6,096 (reported on 26.6% of returns)
48133:
$6,096
State:
$8,327
(% of AGI for various income ranges: 0.8% for AGIs below $25k, 1.8% for AGIs $25k-50k, 2.8% for AGIs $50k-75k, 3.7% for AGIs $75k-100k, 4.8% for AGIs $100k-200k, 5.3% for AGIs over 200k)
Earned income credit: $2,256 (reported on 15.4% of returns)
Here:
$2,256
State:
$2,306
(% of AGI for various income ranges: 5.6% for AGIs below $25k, 0.9% for AGIs $25k-50k)
Percentage of individuals using paid preparers for their 2012 taxes: 59.9%
Here:
60%
State:
57%
(% for various income ranges: 57.1% for AGIs below $25k, 56.2% for AGIs $25k-50k, 63.2% for AGIs $50k-75k, 66.7% for AGIs $75k-100k, 66.7% for AGIs $100k-200k, 66.7% for AGIs over 200k)
Averages for the 2004 tax year for zip code 48133, filed in 2005:
Average Adjusted Gross Income (AGI) in 2004: $43,622 (Individual Income Tax Returns)
Here:
$43,622
State:
$48,204
Salary/wage: $41,229 (reported on 87.5% of returns)
Here:
$41,229
State:
$42,791
(% of AGI for various income ranges: 107.7% for AGIs below $10k, 73.0% for AGIs $10k-25k, 81.1% for AGIs $25k-50k, 85.9% for AGIs $50k-75k, 88.7% for AGIs $75k-100k, 77.4% for AGIs over 100k)
Taxable interest for individuals: $951 (reported on 42.9% of returns)
This zip code:
$951
Michigan:
$1,725
(% of AGI for various income ranges: 4.4% for AGIs below $10k, 2.1% for AGIs $10k-25k, 1.2% for AGIs $25k-50k, 0.9% for AGIs $50k-75k, 0.5% for AGIs $75k-100k, 0.5% for AGIs over 100k)
Taxable dividends: $1,121 (reported on 18.6% of returns)
Here:
$1,121
State:
$3,420
(% of AGI for various income ranges: 2.7% for AGIs below $10k, 1.0% for AGIs $10k-25k, 0.5% for AGIs $25k-50k, 0.3% for AGIs $50k-75k, 0.3% for AGIs $75k-100k, 0.4% for AGIs over 100k)
Net capital gain/loss: +$3,027 (reported on 13.1% of returns)
Here:
+$3,027
State:
+$8,532
(% of AGI for various income ranges: -2.1% for AGIs below $10k, -0.3% for AGIs $10k-25k, 0.3% for AGIs $25k-50k, 0.4% for AGIs $50k-75k, 1.2% for AGIs $75k-100k, 2.3% for AGIs over 100k)
Profit/loss from business: +$4,862 (reported on 11.6% of returns)
Here:
+$4,862
State:
+$9,547
(% of AGI for various income ranges: 4.6% for AGIs below $10k, 2.5% for AGIs $10k-25k, 1.5% for AGIs $25k-50k, 1.3% for AGIs $50k-75k, 1.3% for AGIs $75k-100k, 0.5% for AGIs over 100k)
IRA payment deduction: $2,729 (reported on 1.7% of returns)
48133:
$2,729
Michigan:
$2,875
Total itemized deductions: $15,460 (20% of AGI, reported on 32.9% of returns)
Here:
$15,460
State:
$18,509
Here:
20.1% of AGI
State:
20.7% of AGI
(% of AGI for various income ranges: 6.6% for AGIs below $10k, 6.9% for AGIs $10k-25k, 10.1% for AGIs $25k-50k, 12.5% for AGIs $50k-75k, 12.8% for AGIs $75k-100k, 13.1% for AGIs over 100k)
Charity contributions deductions: $2,112 (3% of AGI, reported on 28.5% of returns)
Here:
$2,112
State:
$3,365
Here:
2.6% of AGI
State:
3.6% of AGI
(% of AGI for various income ranges: 0.7% for AGIs below $10k, 0.7% for AGIs $10k-25k, 1.1% for AGIs $25k-50k, 1.3% for AGIs $50k-75k, 1.5% for AGIs $75k-100k, 1.8% for AGIs over 100k)
Total tax: $5,913 (reported on 76.9% of returns)
48133:
$5,913
State:
$7,691
(% of AGI for various income ranges: 2.5% for AGIs below $10k, 3.9% for AGIs $10k-25k, 6.6% for AGIs $25k-50k, 9.0% for AGIs $50k-75k, 10.4% for AGIs $75k-100k, 17.7% for AGIs over 100k)
Earned income credit: $1,582 (reported on 12.0% of returns)
Here:
$1,582
State:
$1,737
Percentage of individuals using paid preparers for their 2004 taxes: 63.0%
Here:
63%
State:
60%
(% for various income ranges: 51.7% for AGIs below $10k, 59.5% for AGIs $10k-25k, 62.7% for AGIs $25k-50k, 71.3% for AGIs $50k-75k, 70.4% for AGIs $75k-100k, 74.9% for AGIs over 100k)
Likely homosexual households (counted as self-reported same-sex unmarried-partner households)
Lesbian couples: 0.6% of all households
Gay men: 0.0% of all households
Household received Food Stamps/SNAP in the past 12 months: 282 Household did not receive Food Stamps/SNAP in the past 12 months: 2,132
Women who had a birth in the past 12 months: 105 (107 now married, 0 unmarried) Women who did not have a birth in the past 12 months: 1,255 (556 now married, 696 unmarried)
Housing units in zip code 48133 with a mortgage: 1,196 (202 second mortgage, 168 both second mortgage and home equity loan) Houses without a mortgage: 84
Median monthly owner costs for units with a mortgage: $1,300 Median monthly owner costs for units without a mortgage: $604
Residents with income below the poverty level in 2022:
This zip code:
12.7%
Whole state:
13.4%
Residents with income below 50% of the poverty level in 2022:
This zip code:
10.3%
Whole state:
6.9%
Median number of rooms in houses and condos:
Here:
6.6
State:
6.5
Median number of rooms in apartments:
Here:
4.1
State:
4.3
Notable locations in this zip code not listed on our city pages
Notable locations in zip code 48133: Erie Station (A), Erie Township Police Department (B), Morin Point Fire Department (C), Erie Township Fire Department (D). Display/hide their locations on the map
Churches in zip code 48133 include: Erie United Church (A), Saint Joseph's Church (B), Full Gospel Assembly Church (C), First Presbyterian Church (D). Display/hide their locations on the map
Cemeteries: Brigham Cemetery (1), Keeney Cemetery (2), Erie Union Cemetery (3), Saint Joseph Cemetery (4), Saint Joseph-Bay Settlement Cemetery (5). Display/hide their locations on the map
Streams, rivers, and creeks: Bay Creek (A), Yetter Drain (B), Shantee Creek (C), Indian Creek (D), Flat Creek (E), Little Lake Creek (F), Cousino Drain (G), Rapideau Drain (H). Display/hide their locations on the map
In group quarters: 4 (-1 institutionalized population)
Size of family households: 681 2-persons, 226 3-persons, 379 4-persons, 113 5-persons, 174 6-persons, 11 7-or-more-persons
Size of nonfamily households: 583 1-person, 243 2-persons
1,383 married couples with children.
169 single-parent households (53 men, 116 women).
99.3% of residents of 48133 zip code speak English at home.
0.2% of residents speak Spanish at home (36% very well, 64% well).
0.1% of residents speak other language at home (100% very well).
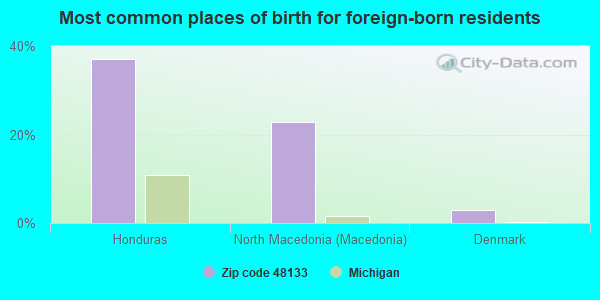
Foreign born population: 35 (0.5%) (72.5% of them are naturalized citizens)
This zip code:
0.5%
Whole state:
6.9%
37%Honduras
23%North Macedonia (Macedonia)
3%Denmark
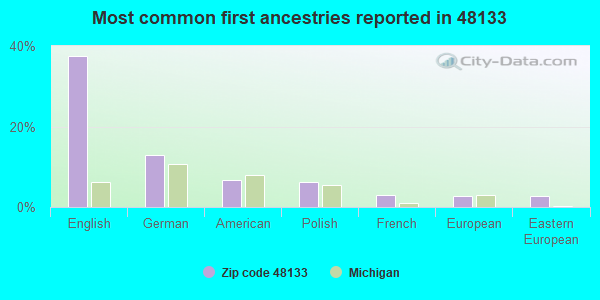
38%English
13%German
7%American
6%Polish
3%French
3%European
3%Eastern European
Year of entry for the foreign-born population
02010 or later
02000 to 2009
01990 to 1999
32Before 1990
Public high school in in zip code 48133 not listed on the city page:
Facilities with environmental interests located in this zip code:
ERIE COATINGS & CHEMICALS INCORPORATED (6828 S DIXIE HWY in ERIE, MI)
(Integrated Compliance Information System) - ICIS-05-1985-0414, FORMAL ENFORCEMENT ACTION, ICIS-05-1994-0408, TSD (Resource Conservation and Recovery Act (tracking hazardous waste)) - notification Business SIC classification: PAINTS, VARNISHES, LACQUERS, ENAMELS, AND ALLIED PRODUCTS Organizations: ERIE COATINGS AND CHEMICALS INC (CONTACT/OPERATOR)
ACME TOOL CO (9835 TELEGRAPH RD in ERIE, MI)
Conditionally Exempt Small Quantity Generators, less than 100 kg/month of hazardous waste (Resource Conservation and Recovery Act (tracking hazardous waste)) - notification Business NAICS classification: MACHINE TOOL (METAL FORMING TYPES) MANUFACTURING. Organizations: DAVID KING (CONTACT/OPERATOR)
AUTOMATIC HANDLING INTERNATIONAL INC (360 LAVOY RD in ERIE, MI)
Small Quantity Generators, between 100 kg and 1000 kg of hazardous waste/month (Resource Conservation and Recovery Act (tracking hazardous waste)) - notification Organizations: PIENTA DAVID J (CONTACT/OPERATOR)
Alternative names: AUTOMATIC HANDLING INC
AIR MAJOR (AIRS/AFS) CRITERIA AND HAZARDOUS AIR POLLUTANT INVENTORY (Inventory of air pollution sources) Business SIC classification: REFUSE SYSTEMS Business NAICS classification: SOLID WASTE LANDFILL. Alternative names: B F GAS SERVICES INCORPORATED
BFI OF WASTE SYSTEMS OF NORTH AMERICA (6749 DIXIE HWY in ERIE, MI)
Small Quantity Generators, between 100 kg and 1000 kg of hazardous waste/month (Resource Conservation and Recovery Act (tracking hazardous waste)) - notification Business NAICS classification: SOLID WASTE COLLECTION. Organizations: BROWNING FERRIS IND (CONTACT/OWNER)
Alternative names: BFI WASTE SYSTEMS OF NORTH AMERICA INCORPORATED
BI-STATE MARINE SERVICE LLC (7120 SUMMIT ST in ERIE, MI)
Conditionally Exempt Small Quantity Generators, less than 100 kg/month of hazardous waste (Resource Conservation and Recovery Act (tracking hazardous waste)) Small Quantity Generators, between 100 kg and 1000 kg of hazardous waste/month (Resource Conservation and Recovery Act (tracking hazardous waste)) - notification Alternative names: BAY HARBOR MARINA
MI DEPT/TRANSPORTATION BRIDGE B01-58151 (I75 NB/SB OVER HALFWAY CREEK in ERIE, MI)
Conditionally Exempt Small Quantity Generators, less than 100 kg/month of hazardous waste (Resource Conservation and Recovery Act (tracking hazardous waste)) Organizations: MICH DEPT OF TRANSPORTATION (CONTACT/OPERATOR)
Housing units lacking complete plumbing facilities: 1.4% Housing units lacking complete kitchen facilities: 3.8%
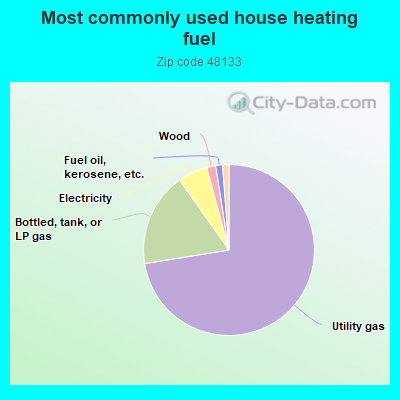
72.6%Utility gas
17.8%Bottled, tank, or LP gas
5.6%Electricity
1.7%Wood
1.3%Fuel oil, kerosene, etc.
1.2%Other fuel
Population in 1990: 5,101. Population change in the 1990s: +254 (+5.0%).
Place of birth for U.S.-born residents:
This state: 2,901
Northeast: 107
Midwest: 3,242
South: 374
West: 83
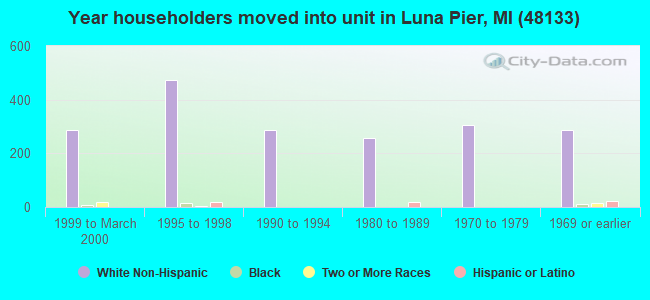
62% of the 48133 zip code residents lived in the same house 5 years ago. Out of people who lived in different houses, 43% lived in this county. Out of people who lived in different counties, 50% lived in Michigan.
96% of the 48133 zip code residents lived in the same house 1 year ago. Out of people who lived in different houses, 69% moved from this county. Out of people who lived in different houses, 23% moved from different county within same state. Out of people who lived in different houses, 11% moved from different state.
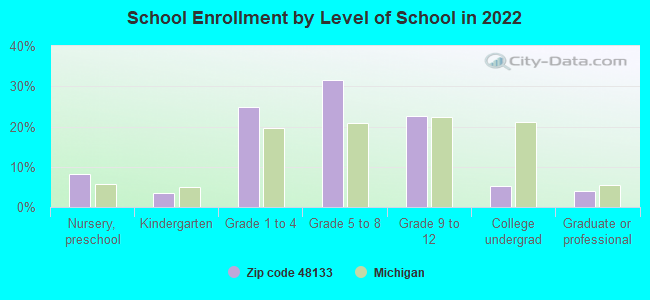
Private vs. public school enrollment:
Students in private schools in grades 1 to 8 (elementary and middle school): 90
Here:
8.8%
Michigan:
12.4%
Students in private schools in grades 9 to 12 (high school): 36
Here:
8.8%
Michigan:
9.8%
Students in private undergraduate colleges: 7
Here:
7.5%
Michigan:
14.9%
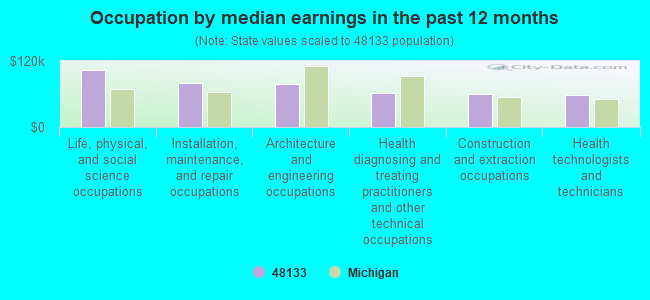
Occupation by median earnings in the past 12 months ($)
103,180Life, physical, and social science occupations
80,884Installation, maintenance, and repair occupations
77,396Architecture and engineering occupations
62,089Health diagnosing and treating practitioners and other technical occupations
59,585Construction and extraction occupations
58,689Health technologists and technicians
Companies with federal contracts located in this zip code:
G S P, LLC (222 LA VOY RD in ERIE, MI; small business) : $71,992 in 3 contractsin 2005
$38,621 with Army for Plate, Sheet, Strip, Foil; and Leaf. Taking place in FL. Signed on 2005-05-27. Completion date: 2005-08-30.
$29,808, same as above.Signed on 2005-03-08. Completion date: 2005-03-21.
$3,563, same as above.Signed on 2005-06-22. Completion date: 2005-06-23.
PRECISION MASKING INC (721 LA VOY RD in ERIE, MI)
$9,403 with Army for Vehicular Cab, Body, and Frame Structural Components. Signed on 2006-02-17. Completion date: 2006-03-14.
Top industries in this zip code by the number of employees in 2005:
Utilities: Electric Power Distribution (100-249 employees: 1 establishment, 20-49 employees: 1 establishment)
Administrative and Support and Waste Management and Remediation Services: Solid Waste Collection (100-249: 1)
2002 - 2018 National Fire Incident Reporting System (NFIRS) incidents
Based on the data from the years 2002 - 2018 the average number of fires per year is 25. The highest number of reported fire incidents - 56 took place in 2010, and the least - 11 in 2007. The data has a declining trend.
When looking into fire subcategories, the most incidents belonged to: Structure Fires (44.8%), and Outside Fires (31.6%).
Fire incident types reported to NFIRS in Zip Code 48133


 Nearest zip codes: 48157, 48145, 43611, 43612, 48177, 48182.
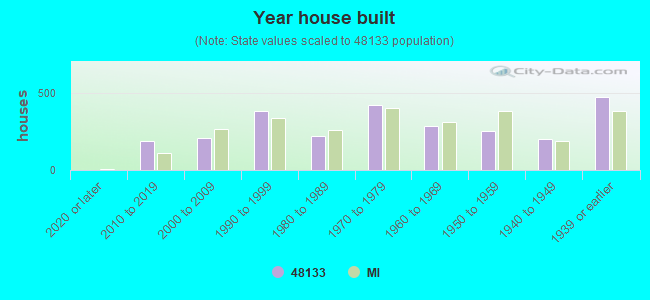


 (Students: 528, Location: 2400 MASON EAGLE DR, Grades: 9-12)
 Based on the data from the years 2002 - 2018 the average number of fires per year is 25. The highest number of reported fire incidents - 56 took place in 2010, and the least - 11 in 2007. The data has a declining trend.
 When looking into fire subcategories, the most incidents belonged to: Structure Fires (44.8%), and Outside Fires (31.6%).