Estimated zip code population in 2022: 21,340 Zip code population in 2010: 21,708 Zip code population in 2000: 20,824
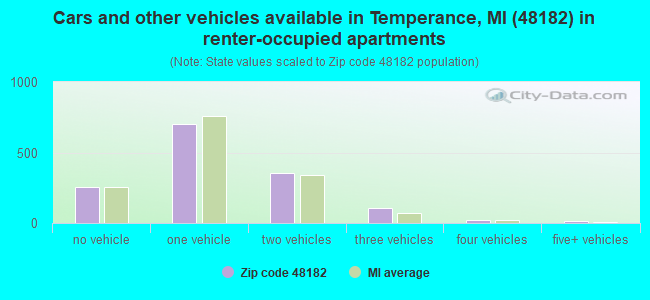
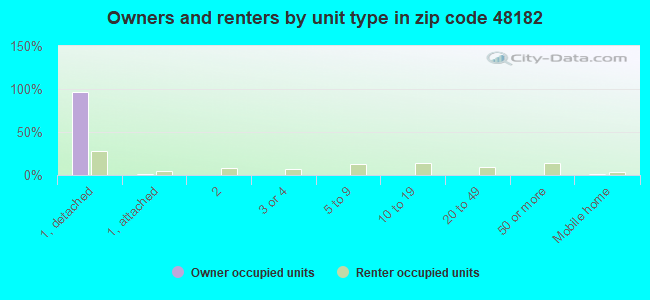
Houses and condos: 8,912 Renter-occupied apartments: 1,453
% of renters here:
17%
State:
27%
March 2022 cost of living index in zip code 48182: 96.2 (near average, U.S. average is 100)
Land area: 39.6 sq. mi. Water area: 0.2 sq. mi.
Population density: 538 people per square mile
(low).
OSM Map
General Map
Google Map
MSN Map
OSM Map
General Map
Google Map
MSN Map
OSM Map
General Map
Google Map
MSN Map
OSM Map
General Map
Google Map
MSN Map
Please wait while loading the map...
Real estate property taxes paid for housing units in 2022:
This zip code:
1.0% ($2,419)
Michigan:
1.2% ($2,746)
Median real estate property taxes paid for housing units with mortgages in 2022: $2,612 (1.0%) Median real estate property taxes paid for housing units with no mortgage in 2022: $2,135 (0.9%)
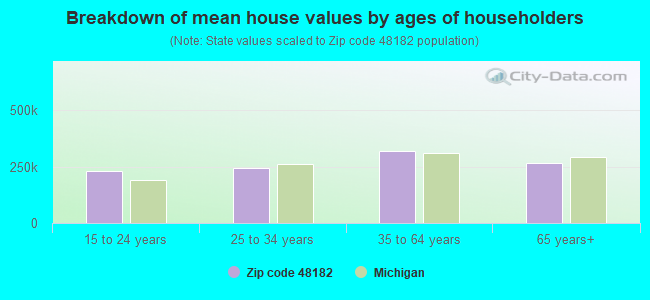
Estimated median house/condo value in 2022: $244,709
48182:
$244,709
Michigan:
$224,400
According to our research of Michigan and other state lists, there were 37 registered sex offenders living in 48182 zip code as of April 27, 2024. The ratio of all residents to sex offenders in zip code 48182 is 580 to 1. The ratio of registered sex offenders to all residents in this zip code is lower than the state average.
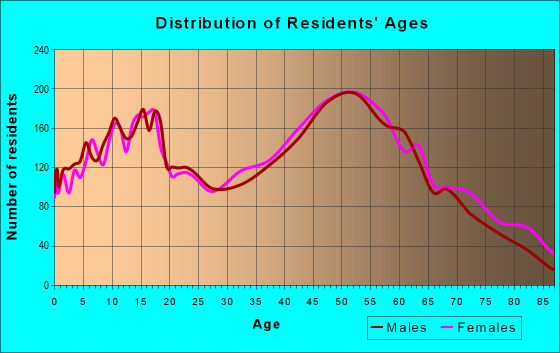
Median resident age:
This zip code:
46.3 years
Michigan median age:
40.3 years
Average household size:
This zip code:
2.4 people
Michigan:
2.4 people
Averages for the 2020 tax year for zip code 48182, filed in 2021:
Average Adjusted Gross Income (AGI) in 2020: $71,139 (Individual Income Tax Returns)
Here:
$71,139
State:
$68,945
Salary/wage: $63,292 (reported on 78.4% of returns)
Here:
$63,292
State:
$57,142
(% of AGI for various income ranges: 978.0% for AGIs below $25k, 3017.2% for AGIs $25k-50k, 5865.0% for AGIs $50k-75k, 8794.6% for AGIs $75k-100k, 16277.0% for AGIs $100k-200k, 60634.3% for AGIs over 200k)
Taxable interest for individuals: $1,028 (reported on 32.2% of returns)
This zip code:
$1,028
Michigan:
$1,630
(% of AGI for various income ranges: 18.6% for AGIs below $25k, 28.7% for AGIs $25k-50k, 34.2% for AGIs $50k-75k, 36.0% for AGIs $75k-100k, 76.1% for AGIs $100k-200k, 640.7% for AGIs over 200k)
Ordinary dividends: $3,490 (reported on 21.1% of returns)
Here:
$3,490
State:
$6,972
(% of AGI for various income ranges: 32.0% for AGIs below $25k, 49.8% for AGIs $25k-50k, 77.3% for AGIs $50k-75k, 94.1% for AGIs $75k-100k, 151.2% for AGIs $100k-200k, 1805.0% for AGIs over 200k)
Net capital gain/loss in AGI: +$7,342 (reported on 18.9% of returns)
Here:
+$7,342
State:
+$20,064
(% of AGI for various income ranges: 9.7% for AGIs below $25k, 26.6% for AGIs $25k-50k, 95.6% for AGIs $50k-75k, 125.3% for AGIs $75k-100k, 296.7% for AGIs $100k-200k, 5627.9% for AGIs over 200k)
Profit/loss from business: +$13,219 (reported on 12.4% of returns)
Here:
+$13,219
State:
+$11,172
(% of AGI for various income ranges: 83.9% for AGIs below $25k, 116.7% for AGIs $25k-50k, 149.7% for AGIs $50k-75k, 234.7% for AGIs $75k-100k, 442.2% for AGIs $100k-200k, 2745.7% for AGIs over 200k)
Taxable individual retirement arrangement distribution: $16,528 (reported on 13.4% of returns)
48182:
$16,528
Michigan:
$19,803
(% of AGI for various income ranges: 106.4% for AGIs below $25k, 206.1% for AGIs $25k-50k, 310.7% for AGIs $50k-75k, 424.8% for AGIs $75k-100k, 603.4% for AGIs $100k-200k, 1507.1% for AGIs over 200k)
Self-employed (Keogh) retirement plans: $23,300 (reported on 0.4% of returns)
48182:
$23,300
Michigan:
$25,132
(% of AGI for various income ranges: 67.5% for AGIs $100k-200k)
Total itemized deductions: $26,959 (reported on 5.4% of returns)
Here:
$26,959
State:
$34,117
(% of AGI for various income ranges: 33.8% for AGIs below $25k, 54.9% for AGIs $25k-50k, 202.6% for AGIs $50k-75k, 195.3% for AGIs $75k-100k, 384.4% for AGIs $100k-200k, 3129.3% for AGIs over 200k)
Charity contributions: $9,076 (reported on 4.2% of returns)
Here:
$9,076
State:
$13,548
(% of AGI for various income ranges: 13.6% for AGIs $25k-50k, 30.5% for AGIs $50k-75k, 43.4% for AGIs $75k-100k, 102.5% for AGIs $100k-200k, 1181.4% for AGIs over 200k)
Taxes paid: $7,310 (reported on 5.4% of returns)
48182:
$7,310
State:
$7,972
(% of AGI for various income ranges: 2.8% for AGIs below $25k, 11.1% for AGIs $25k-50k, 43.1% for AGIs $50k-75k, 64.5% for AGIs $75k-100k, 123.2% for AGIs $100k-200k, 827.9% for AGIs over 200k)
Earned income credit: $2,031 (reported on 8.2% of returns)
Here:
$2,031
State:
$2,251
(% of AGI for various income ranges: 49.8% for AGIs below $25k, 44.8% for AGIs $25k-50k, 1.6% for AGIs $50k-75k)
Percentage of individuals using paid preparers for their 2020 taxes: 93.7%
Here:
94%
State:
93%
(% for various income ranges: 92.7% for AGIs below $25k, 93.7% for AGIs $25k-50k, 93.9% for AGIs $50k-75k, 93.3% for AGIs $75k-100k, 95.4% for AGIs $100k-200k, 92.5% for AGIs over 200k)
Averages for the 2012 tax year for zip code 48182, filed in 2013:
Average Adjusted Gross Income (AGI) in 2012: $58,858 (Individual Income Tax Returns)
Here:
$58,858
State:
$55,609
Salary/wage: $53,199 (reported on 83.0% of returns)
Here:
$53,199
State:
$46,782
(% of AGI for various income ranges: 64.2% for AGIs below $25k, 68.5% for AGIs $25k-50k, 72.9% for AGIs $50k-75k, 80.7% for AGIs $75k-100k, 83.0% for AGIs $100k-200k, 58.7% for AGIs over 200k)
Taxable interest for individuals: $920 (reported on 38.6% of returns)
This zip code:
$920
Michigan:
$1,491
(% of AGI for various income ranges: 1.7% for AGIs below $25k, 0.9% for AGIs $25k-50k, 0.7% for AGIs $50k-75k, 0.3% for AGIs $75k-100k, 0.3% for AGIs $100k-200k, 0.8% for AGIs over 200k)
Ordinary dividends: $2,515 (reported on 21.5% of returns)
Here:
$2,515
State:
$6,225
(% of AGI for various income ranges: 1.6% for AGIs below $25k, 1.0% for AGIs $25k-50k, 0.9% for AGIs $50k-75k, 0.6% for AGIs $75k-100k, 0.8% for AGIs $100k-200k, 1.5% for AGIs over 200k)
Net capital gain/loss in AGI: +$2,189 (reported on 16.4% of returns)
Here:
+$2,189
State:
+$9,326
(% of AGI for various income ranges: 0.1% for AGIs $50k-75k, 0.2% for AGIs $75k-100k, 0.7% for AGIs $100k-200k, 2.9% for AGIs over 200k)
Profit/loss from business: +$10,750 (reported on 13.2% of returns)
Here:
+$10,750
State:
+$11,523
(% of AGI for various income ranges: 4.3% for AGIs below $25k, 2.4% for AGIs $25k-50k, 2.0% for AGIs $50k-75k, 2.2% for AGIs $75k-100k, 2.0% for AGIs $100k-200k, 3.2% for AGIs over 200k)
Taxable individual retirement arrangement distribution: $13,276 (reported on 13.2% of returns)
48182:
$13,276
Michigan:
$15,298
(% of AGI for various income ranges: 5.8% for AGIs below $25k, 3.8% for AGIs $25k-50k, 3.6% for AGIs $50k-75k, 2.6% for AGIs $75k-100k, 2.4% for AGIs $100k-200k, 1.9% for AGIs over 200k)
Self-employment retirement plans: $15,920 (reported on 0.5% of returns)
48182:
$15,920
Michigan:
$20,834
Total itemized deductions: $19,263 (19% of AGI, reported on 36.8% of returns)
Here:
$19,263
State:
$21,628
Here:
19.2% of AGI
State:
18.4% of AGI
(% of AGI for various income ranges: 9.3% for AGIs below $25k, 9.7% for AGIs $25k-50k, 11.5% for AGIs $50k-75k, 12.3% for AGIs $75k-100k, 13.3% for AGIs $100k-200k, 12.8% for AGIs over 200k)
Charity contributions: $2,765 (reported on 30.5% of returns)
Here:
$2,765
State:
$4,225
(% of AGI for various income ranges: 0.7% for AGIs below $25k, 1.0% for AGIs $25k-50k, 1.3% for AGIs $50k-75k, 1.4% for AGIs $75k-100k, 1.7% for AGIs $100k-200k, 1.7% for AGIs over 200k)
Taxes paid: $7,330 (reported on 36.6% of returns)
48182:
$7,330
State:
$8,327
(% of AGI for various income ranges: 1.9% for AGIs below $25k, 2.4% for AGIs $25k-50k, 3.7% for AGIs $50k-75k, 4.6% for AGIs $75k-100k, 5.7% for AGIs $100k-200k, 6.1% for AGIs over 200k)
Earned income credit: $1,862 (reported on 10.3% of returns)
Here:
$1,862
State:
$2,306
(% of AGI for various income ranges: 3.4% for AGIs below $25k, 0.8% for AGIs $25k-50k)
Percentage of individuals using paid preparers for their 2012 taxes: 61.6%
Here:
62%
State:
57%
(% for various income ranges: 56.0% for AGIs below $25k, 60.7% for AGIs $25k-50k, 66.9% for AGIs $50k-75k, 66.9% for AGIs $75k-100k, 64.3% for AGIs $100k-200k, 73.7% for AGIs over 200k)
Averages for the 2004 tax year for zip code 48182, filed in 2005:
Average Adjusted Gross Income (AGI) in 2004: $50,841 (Individual Income Tax Returns)
Here:
$50,841
State:
$48,204
Salary/wage: $48,422 (reported on 85.8% of returns)
Here:
$48,422
State:
$42,791
(% of AGI for various income ranges: 116.9% for AGIs below $10k, 64.2% for AGIs $10k-25k, 73.7% for AGIs $25k-50k, 83.6% for AGIs $50k-75k, 89.0% for AGIs $75k-100k, 80.8% for AGIs over 100k)
Taxable interest for individuals: $1,149 (reported on 54.2% of returns)
This zip code:
$1,149
Michigan:
$1,725
(% of AGI for various income ranges: 7.7% for AGIs below $10k, 3.8% for AGIs $10k-25k, 1.8% for AGIs $25k-50k, 0.9% for AGIs $50k-75k, 0.7% for AGIs $75k-100k, 0.9% for AGIs over 100k)
Taxable dividends: $1,445 (reported on 27.5% of returns)
Here:
$1,445
State:
$3,420
(% of AGI for various income ranges: 4.5% for AGIs below $10k, 1.3% for AGIs $10k-25k, 1.0% for AGIs $25k-50k, 0.6% for AGIs $50k-75k, 0.5% for AGIs $75k-100k, 0.8% for AGIs over 100k)
Net capital gain/loss: +$2,490 (reported on 19.7% of returns)
Here:
+$2,490
State:
+$8,532
(% of AGI for various income ranges: -0.7% for AGIs below $10k, -0.1% for AGIs $10k-25k, 0.3% for AGIs $25k-50k, 0.5% for AGIs $50k-75k, 0.5% for AGIs $75k-100k, 2.1% for AGIs over 100k)
Profit/loss from business: +$11,066 (reported on 13.1% of returns)
Here:
+$11,066
State:
+$9,547
(% of AGI for various income ranges: 7.6% for AGIs below $10k, 3.9% for AGIs $10k-25k, 3.5% for AGIs $25k-50k, 2.4% for AGIs $50k-75k, 1.6% for AGIs $75k-100k, 3.4% for AGIs over 100k)
IRA payment deduction: $2,856 (reported on 2.2% of returns)
48182:
$2,856
Michigan:
$2,875
(% of AGI for various income ranges: 0.3% for AGIs $10k-25k, 0.2% for AGIs $25k-50k, 0.2% for AGIs $50k-75k, 0.1% for AGIs $75k-100k, 0.1% for AGIs over 100k)
Self-employed pension: $10,739 (reported on 0.7% of returns)
Here:
$10,739
Michigan:
$13,826
(% of AGI for various income ranges: 0.0% for AGIs $25k-50k, 0.1% for AGIs $50k-75k, 0.0% for AGIs $75k-100k, 0.4% for AGIs over 100k)
Total itemized deductions: $16,646 (20% of AGI, reported on 44.5% of returns)
Here:
$16,646
State:
$18,509
Here:
20.5% of AGI
State:
20.7% of AGI
(% of AGI for various income ranges: 16.4% for AGIs below $10k, 8.9% for AGIs $10k-25k, 13.4% for AGIs $25k-50k, 15.6% for AGIs $50k-75k, 15.9% for AGIs $75k-100k, 14.5% for AGIs over 100k)
Charity contributions deductions: $2,336 (3% of AGI, reported on 39.8% of returns)
Here:
$2,336
State:
$3,365
Here:
2.8% of AGI
State:
3.6% of AGI
(% of AGI for various income ranges: 0.7% for AGIs below $10k, 1.1% for AGIs $10k-25k, 1.5% for AGIs $25k-50k, 1.7% for AGIs $50k-75k, 1.9% for AGIs $75k-100k, 2.3% for AGIs over 100k)
Total tax: $6,804 (reported on 81.5% of returns)
48182:
$6,804
State:
$7,691
(% of AGI for various income ranges: 3.6% for AGIs below $10k, 4.3% for AGIs $10k-25k, 7.2% for AGIs $25k-50k, 8.7% for AGIs $50k-75k, 10.1% for AGIs $75k-100k, 16.1% for AGIs over 100k)
Earned income credit: $1,532 (reported on 7.2% of returns)
Here:
$1,532
State:
$1,737
Percentage of individuals using paid preparers for their 2004 taxes: 60.2%
Here:
60%
State:
60%
(% for various income ranges: 48.2% for AGIs below $10k, 58.8% for AGIs $10k-25k, 62.7% for AGIs $25k-50k, 65.6% for AGIs $50k-75k, 62.2% for AGIs $75k-100k, 67.2% for AGIs over 100k)
Likely homosexual households (counted as self-reported same-sex unmarried-partner households)
Lesbian couples: 0.1% of all households
Gay men: 0.1% of all households
Household received Food Stamps/SNAP in the past 12 months: 868 Household did not receive Food Stamps/SNAP in the past 12 months: 7,853
Women who had a birth in the past 12 months: 242 (169 now married, 73 unmarried) Women who did not have a birth in the past 12 months: 3,818 (1,761 now married, 2,051 unmarried)
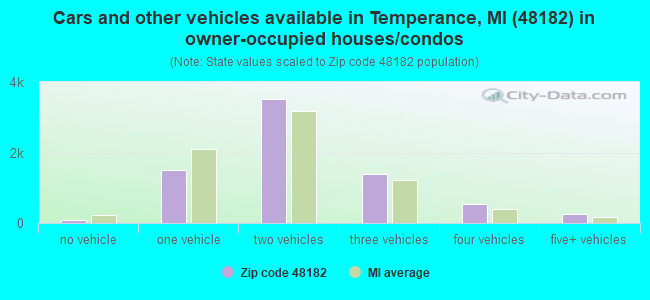
Housing units in zip code 48182 with a mortgage: 4,569 (491 second mortgage, 6 home equity loan, 442 both second mortgage and home equity loan) Houses without a mortgage: 188
Median monthly owner costs for units with a mortgage: $1,379 Median monthly owner costs for units without a mortgage: $545
Residents with income below the poverty level in 2022:
This zip code:
7.1%
Whole state:
13.4%
Residents with income below 50% of the poverty level in 2022:
This zip code:
5.3%
Whole state:
6.9%
Median number of rooms in houses and condos:
Here:
7.0
State:
6.5
Median number of rooms in apartments:
Here:
4.2
State:
4.3
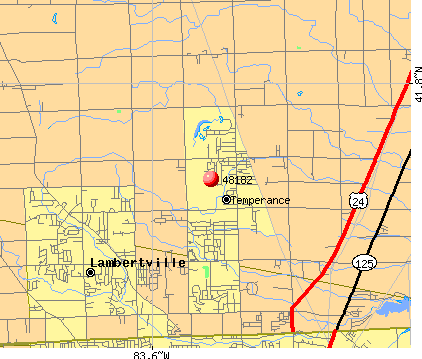
Notable locations in this zip code not listed on our city pages
Notable locations in zip code 48182: Willits Station (A), Temperance Station (B), Giant Oaks Golf Course (C), Samaria Station (D), Monroe Community Ambulance Bedford Township (E), Bedford Township Hall (F), Bedford Fire Department District 1 (G), Bedford Library (H). Display/hide their locations on the map
Churches in zip code 48182 include: DeLand Church (A), First Baptist Church (B), Our Lady of Mount Carmel Church (C), Bedford Christian Community Church (D), Saint Paul's Lutheran Church (E), Bedford Missionary Church (F), United Methodist Church (G), Grace United Methodist Church (H), Church of God (I). Display/hide their locations on the map
Cemeteries: Saint Anthonys Cemetery (1), Hitchcock Cemetery (2), Our Lady of Mount Carmel Cemetery (3), Weeks Cemetery (4), Bedford Memorial Cemetery (5), Neriah Cemetery (6). Display/hide their locations on the map
Parks in zip code 48182 include: Vienna Park (1), Samaria Park (2), Indian Creek Park (3), Carr Park (4), Miller Park (5). Display/hide their locations on the map
3,012 married couples with children.
1,034 single-parent households (700 men, 334 women).
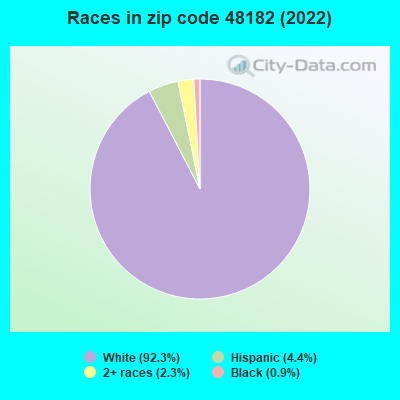
96.4% of residents of 48182 zip code speak English at home.
1.9% of residents speak Spanish at home (86% very well, 14% well).
1.2% of residents speak other Indo-European language at home (89% very well, 11% well).
0.1% of residents speak Asian or Pacific Island language at home (100% very well).
0.3% of residents speak other language at home (54% very well, 46% well).
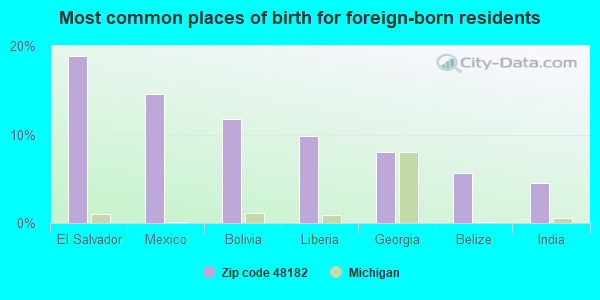
Foreign born population: 428 (2.0%) (69.8% of them are naturalized citizens)
This zip code:
2.0%
Whole state:
6.9%
19%El Salvador
15%Mexico
12%Bolivia
10%Liberia
8%Georgia
6%Belize
4%India
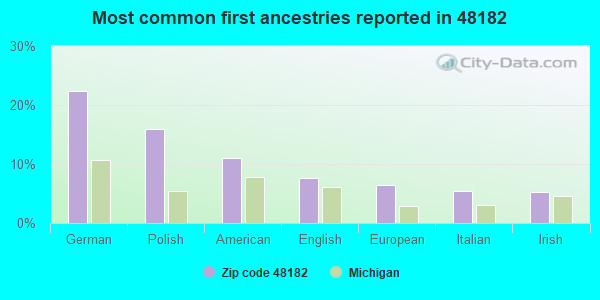
22%German
16%Polish
11%American
8%English
6%European
5%Italian
5%Irish
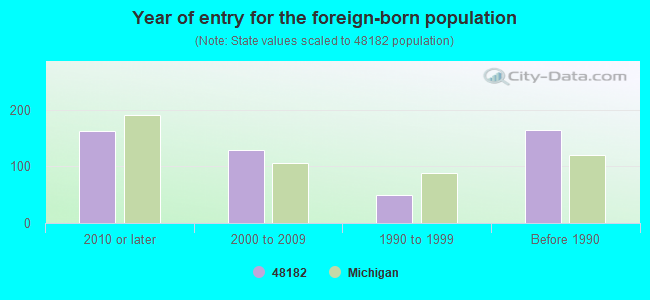
Year of entry for the foreign-born population
1632010 or later
1292000 to 2009
491990 to 1999
165Before 1990
Facilities with environmental interests located in this zip code:
BEDFORD JUNIOR HIGH SCHOOL (8405 JACKMAN ROAD in TEMPERANCE, MI)
(Geographic Names Information System) (National Center for Education Statistics) - STATE ID-06177 Organizations: BEDFORD PUBLIC SCHOOLS (SCHOOL DISTRICT)
BEDFORD SENIOR HIGH SCHOOL (8285 JACKMAN ROAD in TEMPERANCE, MI)
(National Center for Education Statistics) - STATE ID-00250 Organizations: BEDFORD PUBLIC SCHOOLS (SCHOOL DISTRICT)
BEDFORD AUTO WASH (7370 LEWIS in TEMPERANCE, MI)
(Resource Conservation and Recovery Act (tracking hazardous waste)) Organizations: RONALD OMAR (CONTACT/OPERATOR)
MI DEPT/ENVIRONMENTAL QUALITY (W-1/2 NW-1/4 SEC 28 T85 R7E in TEMPERANCE, MI)
(Resource Conservation and Recovery Act (tracking hazardous waste)) Business NAICS classification: SOLID WASTE LANDFILL. Alternative names: MIDNR STEVENS LANDFILL
ADVANCED CONVEYOR SYST & FAB INC (7310 EXPRESS ROAD in TEMPERANCE, MI)
Conditionally Exempt Small Quantity Generators, less than 100 kg/month of hazardous waste (Resource Conservation and Recovery Act (tracking hazardous waste)) - notification Organizations: PCT, LLC (CONTACT/OWNER)
BEDFORD HIGH SCHOOL WAREHOUSE (8485 DOUGLAS RD in TEMPERANCE, MI)
Conditionally Exempt Small Quantity Generators, less than 100 kg/month of hazardous waste (Resource Conservation and Recovery Act (tracking hazardous waste)) - notification Organizations: BEDFORD HIGH SCHOOL BOARD OF EDUCATION (CONTACT/OPERATOR)
MET-L-TEC INC (7193 SULIER BEDFORD IND PK in TEMPERANCE, MI)
Conditionally Exempt Small Quantity Generators, less than 100 kg/month of hazardous waste (Resource Conservation and Recovery Act (tracking hazardous waste)) Organizations: MET L TECH (CONTACT/OPERATOR)
Alternative names: MET L TECH
FORM TECH STEEL CO LLC (177 REED DR in TEMPERANCE, MI)
Conditionally Exempt Small Quantity Generators, less than 100 kg/month of hazardous waste (Resource Conservation and Recovery Act (tracking hazardous waste))
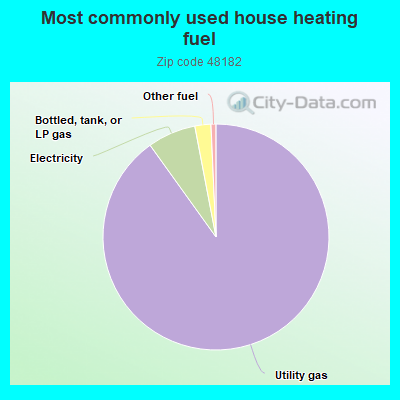
Housing units lacking complete plumbing facilities: 0.1% Housing units lacking complete kitchen facilities: 0.7%
90.1%Utility gas
6.9%Electricity
2.3%Bottled, tank, or LP gas
0.7%Other fuel
Population in 1990: 15,581. Population change in the 1990s: +5,243 (+33.6%).
Place of birth for U.S.-born residents:
This state: 5,685
Northeast: 488
Midwest: 14,083
South: 584
West: 227
61% of the 48182 zip code residents lived in the same house 5 years ago. Out of people who lived in different houses, 43% lived in this county. Out of people who lived in different counties, 50% lived in Michigan.
95% of the 48182 zip code residents lived in the same house 1 year ago. Out of people who lived in different houses, 42% moved from this county. Out of people who lived in different houses, 11% moved from different county within same state. Out of people who lived in different houses, 59% moved from different state.
Private vs. public school enrollment:
Students in private schools in grades 1 to 8 (elementary and middle school): 80
Here:
4.6%
Michigan:
12.4%
Students in private schools in grades 9 to 12 (high school): 97
Here:
7.3%
Michigan:
9.8%
Students in private undergraduate colleges: 75
Here:
9.7%
Michigan:
14.9%
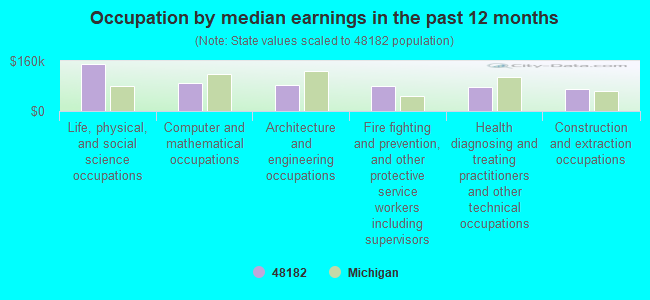
Occupation by median earnings in the past 12 months ($)
150,924Life, physical, and social science occupations
91,144Computer and mathematical occupations
83,252Architecture and engineering occupations
80,246Fire fighting and prevention, and other protective service workers including supervisors
75,610Health diagnosing and treating practitioners and other technical occupations
68,831Construction and extraction occupations
Companies with federal contracts located in this zip code:
ROLLED ALLOYS INC (125 W STERNS RD in TEMPERANCE, MI; small business) : $9,506 in 2 contractsfrom 2005 to 2006
$5,962 with Navy for Bars and Rods. Signed on 2006-04-06. Completion date: 2006-04-17.
$3,544 with Navy for Miscellaneous Welding, Soldering, and Brazing Supplies and Accessories. Signed on 2005-01-20. Completion date: 2003-08-15.
LAKE ERIE MEDICAL AND SURGICAL (7560 LEWIS AVE in TEMPERANCE, MI; small business)
$4,935 with Army for Medical and Surgical Instruments, Equipment, and Supplies. Signed on 2004-07-31. Completion date: 2004-08-19.
Top industries in this zip code by the number of employees in 2005:
Other Services (except Public Administration): Commercial and Industrial Machinery and Equipment (except Automotive and Electronic) Repair and Maintenance (100-249 employees: 1 establishment, 1-4 employees: 1 establishment)
Other Services (except Public Administration): Religious Organizations (20-49: 2, 10-19: 2, 5-9: 2, 1-4: 1)
2002 - 2018 National Fire Incident Reporting System (NFIRS) incidents
According to the data from the years 2002 - 2018 the average number of fire incidents per year is 47. The highest number of fire incidents - 104 took place in 2005, and the least - 21 in 2003. The data has an increasing trend.
When looking into fire subcategories, the most incidents belonged to: Structure Fires (53.4%), and Outside Fires (32.8%).
Fire incident types reported to NFIRS in Zip Code 48182
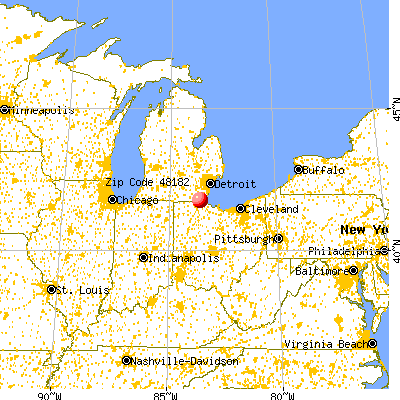


 Nearest zip codes: 48177, 48144, 43613, 43612, 48140, 48133.


 According to the data from the years 2002 - 2018 the average number of fire incidents per year is 47. The highest number of fire incidents - 104 took place in 2005, and the least - 21 in 2003. The data has an increasing trend.
 When looking into fire subcategories, the most incidents belonged to: Structure Fires (53.4%), and Outside Fires (32.8%).