Estimated zip code population in 2022: 42,366 Zip code population in 2010: 43,182 Zip code population in 2000: 40,891
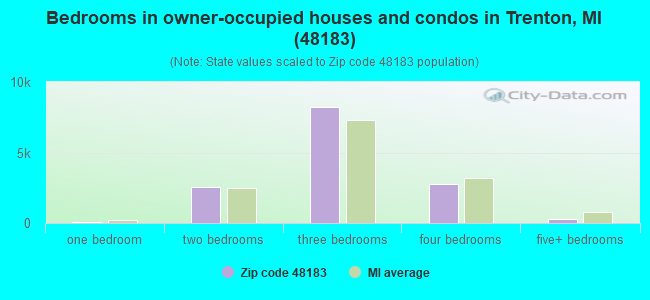
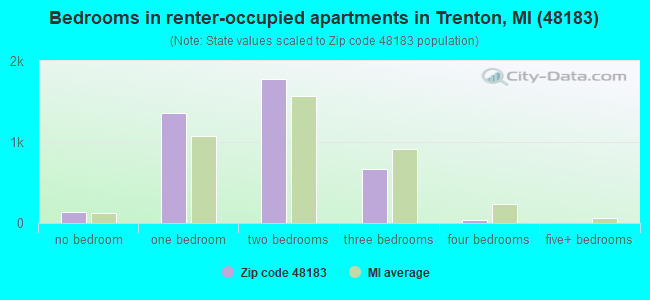
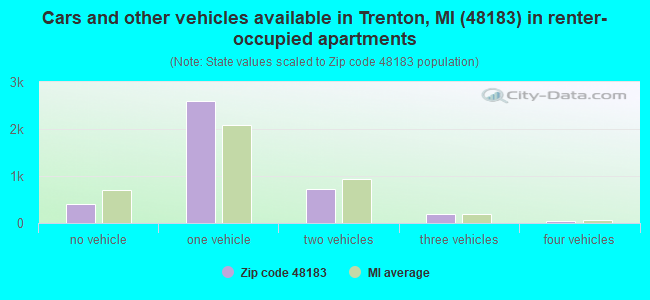
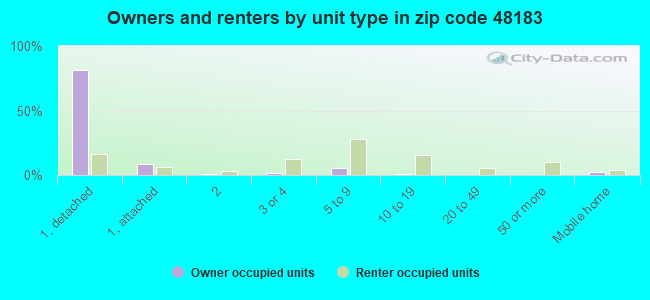
Houses and condos: 18,413 Renter-occupied apartments: 3,971
% of renters here:
22%
State:
27%
March 2022 cost of living index in zip code 48183: 95.4 (near average, U.S. average is 100)
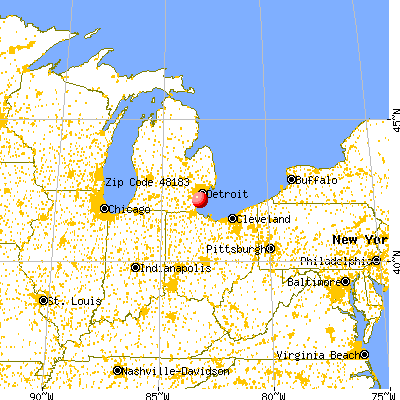
Land area: 18.6 sq. mi. Water area: 0.8 sq. mi.
Population density: 2,279 people per square mile
(low).
OSM Map
General Map
Google Map
MSN Map
OSM Map
General Map
Google Map
MSN Map
OSM Map
General Map
Google Map
MSN Map
OSM Map
General Map
Google Map
MSN Map
Please wait while loading the map...
Real estate property taxes paid for housing units in 2022:
This zip code:
1.7% ($3,891)
Michigan:
1.2% ($2,746)
Median real estate property taxes paid for housing units with mortgages in 2022: $4,144 (1.7%) Median real estate property taxes paid for housing units with no mortgage in 2022: $3,614 (1.7%)
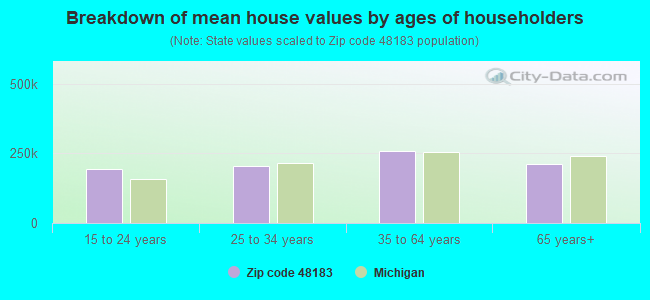
Estimated median house/condo value in 2022: $226,074
48183:
$226,074
Michigan:
$224,400
According to our research of Michigan and other state lists, there were 61 registered sex offenders living in 48183 zip code as of April 27, 2024. The ratio of all residents to sex offenders in zip code 48183 is 705 to 1. The ratio of registered sex offenders to all residents in this zip code is lower than the state average.
Median resident age:
This zip code:
46.2 years
Michigan median age:
40.3 years
Average household size:
This zip code:
2.3 people
Michigan:
2.4 people
Averages for the 2020 tax year for zip code 48183, filed in 2021:
Average Adjusted Gross Income (AGI) in 2020: $62,479 (Individual Income Tax Returns)
Here:
$62,479
State:
$68,945
Salary/wage: $57,650 (reported on 77.1% of returns)
Here:
$57,650
State:
$57,142
(% of AGI for various income ranges: 913.2% for AGIs below $25k, 3065.3% for AGIs $25k-50k, 5831.9% for AGIs $50k-75k, 8387.8% for AGIs $75k-100k, 15988.9% for AGIs $100k-200k, 55756.5% for AGIs over 200k)
Taxable interest for individuals: $939 (reported on 31.4% of returns)
This zip code:
$939
Michigan:
$1,630
(% of AGI for various income ranges: 15.7% for AGIs below $25k, 23.4% for AGIs $25k-50k, 30.5% for AGIs $50k-75k, 50.3% for AGIs $75k-100k, 73.8% for AGIs $100k-200k, 613.9% for AGIs over 200k)
Ordinary dividends: $3,265 (reported on 18.3% of returns)
Here:
$3,265
State:
$6,972
(% of AGI for various income ranges: 20.8% for AGIs below $25k, 34.8% for AGIs $25k-50k, 63.2% for AGIs $50k-75k, 83.7% for AGIs $75k-100k, 148.9% for AGIs $100k-200k, 1841.7% for AGIs over 200k)
Net capital gain/loss in AGI: +$6,604 (reported on 15.9% of returns)
Here:
+$6,604
State:
+$20,064
(% of AGI for various income ranges: 6.4% for AGIs below $25k, 28.5% for AGIs $25k-50k, 53.6% for AGIs $50k-75k, 102.1% for AGIs $75k-100k, 258.2% for AGIs $100k-200k, 5437.0% for AGIs over 200k)
Profit/loss from business: +$8,260 (reported on 12.3% of returns)
Here:
+$8,260
State:
+$11,172
(% of AGI for various income ranges: 55.6% for AGIs below $25k, 72.7% for AGIs $25k-50k, 103.5% for AGIs $50k-75k, 131.4% for AGIs $75k-100k, 293.1% for AGIs $100k-200k, 2126.1% for AGIs over 200k)
Taxable individual retirement arrangement distribution: $17,618 (reported on 12.0% of returns)
48183:
$17,618
Michigan:
$19,803
(% of AGI for various income ranges: 81.8% for AGIs below $25k, 136.4% for AGIs $25k-50k, 280.6% for AGIs $50k-75k, 397.8% for AGIs $75k-100k, 680.3% for AGIs $100k-200k, 2851.3% for AGIs over 200k)
Self-employed (Keogh) retirement plans: $19,860 (reported on 0.2% of returns)
48183:
$19,860
Michigan:
$25,132
(% of AGI for various income ranges: 38.3% for AGIs $100k-200k)
Total itemized deductions: $24,446 (reported on 5.7% of returns)
Here:
$24,446
State:
$34,117
(% of AGI for various income ranges: 32.2% for AGIs below $25k, 74.2% for AGIs $25k-50k, 209.6% for AGIs $50k-75k, 291.4% for AGIs $75k-100k, 450.7% for AGIs $100k-200k, 2099.6% for AGIs over 200k)
Charity contributions: $7,020 (reported on 4.6% of returns)
Here:
$7,020
State:
$13,548
(% of AGI for various income ranges: 3.0% for AGIs below $25k, 8.9% for AGIs $25k-50k, 34.6% for AGIs $50k-75k, 51.2% for AGIs $75k-100k, 126.2% for AGIs $100k-200k, 736.5% for AGIs over 200k)
Taxes paid: $7,770 (reported on 5.7% of returns)
48183:
$7,770
State:
$7,972
(% of AGI for various income ranges: 6.0% for AGIs below $25k, 16.7% for AGIs $25k-50k, 73.0% for AGIs $50k-75k, 110.5% for AGIs $75k-100k, 153.8% for AGIs $100k-200k, 540.9% for AGIs over 200k)
Earned income credit: $2,002 (reported on 9.8% of returns)
Here:
$2,002
State:
$2,251
(% of AGI for various income ranges: 56.3% for AGIs below $25k, 44.6% for AGIs $25k-50k, 0.7% for AGIs $50k-75k)
Percentage of individuals using paid preparers for their 2020 taxes: 94.0%
Here:
94%
State:
93%
(% for various income ranges: 93.4% for AGIs below $25k, 94.3% for AGIs $25k-50k, 94.2% for AGIs $50k-75k, 94.4% for AGIs $75k-100k, 94.2% for AGIs $100k-200k, 95.2% for AGIs over 200k)
Averages for the 2012 tax year for zip code 48183, filed in 2013:
Average Adjusted Gross Income (AGI) in 2012: $53,027 (Individual Income Tax Returns)
Here:
$53,027
State:
$55,609
Salary/wage: $49,248 (reported on 80.8% of returns)
Here:
$49,248
State:
$46,782
(% of AGI for various income ranges: 63.8% for AGIs below $25k, 68.7% for AGIs $25k-50k, 73.3% for AGIs $50k-75k, 76.3% for AGIs $75k-100k, 81.6% for AGIs $100k-200k, 69.4% for AGIs over 200k)
Taxable interest for individuals: $887 (reported on 37.4% of returns)
This zip code:
$887
Michigan:
$1,491
(% of AGI for various income ranges: 1.4% for AGIs below $25k, 0.9% for AGIs $25k-50k, 0.5% for AGIs $50k-75k, 0.4% for AGIs $75k-100k, 0.5% for AGIs $100k-200k, 0.7% for AGIs over 200k)
Ordinary dividends: $2,570 (reported on 20.6% of returns)
Here:
$2,570
State:
$6,225
(% of AGI for various income ranges: 1.3% for AGIs below $25k, 1.2% for AGIs $25k-50k, 1.0% for AGIs $50k-75k, 0.8% for AGIs $75k-100k, 0.7% for AGIs $100k-200k, 2.2% for AGIs over 200k)
Net capital gain/loss in AGI: +$1,355 (reported on 13.6% of returns)
Here:
+$1,355
State:
+$9,326
(% of AGI for various income ranges: 0.2% for AGIs $50k-75k, 0.2% for AGIs $75k-100k, 0.4% for AGIs $100k-200k, 2.5% for AGIs over 200k)
Profit/loss from business: +$9,883 (reported on 10.0% of returns)
Here:
+$9,883
State:
+$11,523
(% of AGI for various income ranges: 5.9% for AGIs below $25k, 2.3% for AGIs $25k-50k, 1.3% for AGIs $50k-75k, 1.2% for AGIs $75k-100k, 1.3% for AGIs $100k-200k, 2.4% for AGIs over 200k)
Taxable individual retirement arrangement distribution: $13,438 (reported on 12.6% of returns)
48183:
$13,438
Michigan:
$15,298
(% of AGI for various income ranges: 4.0% for AGIs below $25k, 3.4% for AGIs $25k-50k, 3.0% for AGIs $50k-75k, 3.4% for AGIs $75k-100k, 2.8% for AGIs $100k-200k, 3.4% for AGIs over 200k)
Self-employment retirement plans: $11,100 (reported on 0.2% of returns)
48183:
$11,100
Michigan:
$20,834
Total itemized deductions: $17,970 (20% of AGI, reported on 35.7% of returns)
Here:
$17,970
State:
$21,628
Here:
19.9% of AGI
State:
18.4% of AGI
(% of AGI for various income ranges: 9.4% for AGIs below $25k, 9.6% for AGIs $25k-50k, 12.3% for AGIs $50k-75k, 12.9% for AGIs $75k-100k, 13.0% for AGIs $100k-200k, 13.1% for AGIs over 200k)
Charity contributions: $2,594 (reported on 31.3% of returns)
Here:
$2,594
State:
$4,225
(% of AGI for various income ranges: 0.8% for AGIs below $25k, 1.1% for AGIs $25k-50k, 1.5% for AGIs $50k-75k, 1.6% for AGIs $75k-100k, 1.8% for AGIs $100k-200k, 1.7% for AGIs over 200k)
Taxes paid: $7,120 (reported on 35.6% of returns)
48183:
$7,120
State:
$8,327
(% of AGI for various income ranges: 2.3% for AGIs below $25k, 3.0% for AGIs $25k-50k, 4.4% for AGIs $50k-75k, 5.0% for AGIs $75k-100k, 5.9% for AGIs $100k-200k, 6.1% for AGIs over 200k)
Earned income credit: $2,041 (reported on 12.2% of returns)
Here:
$2,041
State:
$2,306
(% of AGI for various income ranges: 4.5% for AGIs below $25k, 0.7% for AGIs $25k-50k)
Percentage of individuals using paid preparers for their 2012 taxes: 61.5%
Here:
61%
State:
57%
(% for various income ranges: 56.7% for AGIs below $25k, 61.7% for AGIs $25k-50k, 66.8% for AGIs $50k-75k, 64.5% for AGIs $75k-100k, 64.8% for AGIs $100k-200k, 75.0% for AGIs over 200k)
Averages for the 2004 tax year for zip code 48183, filed in 2005:
Average Adjusted Gross Income (AGI) in 2004: $50,889 (Individual Income Tax Returns)
Here:
$50,889
State:
$48,204
Salary/wage: $48,261 (reported on 84.7% of returns)
Here:
$48,261
State:
$42,791
(% of AGI for various income ranges: 81.4% for AGIs below $10k, 63.2% for AGIs $10k-25k, 73.5% for AGIs $25k-50k, 80.6% for AGIs $50k-75k, 86.5% for AGIs $75k-100k, 82.0% for AGIs over 100k)
Taxable interest for individuals: $1,152 (reported on 55.8% of returns)
This zip code:
$1,152
Michigan:
$1,725
(% of AGI for various income ranges: 4.5% for AGIs below $10k, 3.5% for AGIs $10k-25k, 1.8% for AGIs $25k-50k, 1.1% for AGIs $50k-75k, 0.9% for AGIs $75k-100k, 0.8% for AGIs over 100k)
Taxable dividends: $1,890 (reported on 29.0% of returns)
Here:
$1,890
State:
$3,420
(% of AGI for various income ranges: 2.7% for AGIs below $10k, 2.0% for AGIs $10k-25k, 1.3% for AGIs $25k-50k, 1.0% for AGIs $50k-75k, 0.8% for AGIs $75k-100k, 0.9% for AGIs over 100k)
Net capital gain/loss: +$2,887 (reported on 20.2% of returns)
Here:
+$2,887
State:
+$8,532
(% of AGI for various income ranges: -2.3% for AGIs below $10k, 0.0% for AGIs $10k-25k, 0.2% for AGIs $25k-50k, 0.3% for AGIs $50k-75k, 0.6% for AGIs $75k-100k, 2.7% for AGIs over 100k)
Profit/loss from business: +$8,327 (reported on 9.6% of returns)
Here:
+$8,327
State:
+$9,547
(% of AGI for various income ranges: 3.6% for AGIs below $10k, 4.0% for AGIs $10k-25k, 1.8% for AGIs $25k-50k, 1.3% for AGIs $50k-75k, 0.8% for AGIs $75k-100k, 1.6% for AGIs over 100k)
IRA payment deduction: $3,041 (reported on 2.0% of returns)
48183:
$3,041
Michigan:
$2,875
(% of AGI for various income ranges: 0.2% for AGIs below $10k, 0.2% for AGIs $10k-25k, 0.2% for AGIs $25k-50k, 0.1% for AGIs $50k-75k, 0.1% for AGIs $75k-100k, 0.1% for AGIs over 100k)
Self-employed pension: $11,075 (reported on 0.3% of returns)
Here:
$11,075
Michigan:
$13,826
Total itemized deductions: $17,256 (21% of AGI, reported on 44.9% of returns)
Here:
$17,256
State:
$18,509
Here:
21.2% of AGI
State:
20.7% of AGI
(% of AGI for various income ranges: 9.8% for AGIs below $10k, 10.8% for AGIs $10k-25k, 13.5% for AGIs $25k-50k, 16.4% for AGIs $50k-75k, 17.0% for AGIs $75k-100k, 15.1% for AGIs over 100k)
Charity contributions deductions: $2,398 (3% of AGI, reported on 42.2% of returns)
Here:
$2,398
State:
$3,365
Here:
2.9% of AGI
State:
3.6% of AGI
(% of AGI for various income ranges: 0.7% for AGIs below $10k, 1.2% for AGIs $10k-25k, 1.7% for AGIs $25k-50k, 2.0% for AGIs $50k-75k, 2.2% for AGIs $75k-100k, 2.2% for AGIs over 100k)
Total tax: $6,851 (reported on 80.0% of returns)
48183:
$6,851
State:
$7,691
(% of AGI for various income ranges: 2.1% for AGIs below $10k, 4.2% for AGIs $10k-25k, 7.4% for AGIs $25k-50k, 9.1% for AGIs $50k-75k, 10.0% for AGIs $75k-100k, 15.1% for AGIs over 100k)
Earned income credit: $1,571 (reported on 8.0% of returns)
Here:
$1,571
State:
$1,737
Percentage of individuals using paid preparers for their 2004 taxes: 62.2%
Here:
62%
State:
60%
(% for various income ranges: 51.6% for AGIs below $10k, 61.9% for AGIs $10k-25k, 64.0% for AGIs $25k-50k, 66.5% for AGIs $50k-75k, 65.8% for AGIs $75k-100k, 66.1% for AGIs over 100k)
Likely homosexual households (counted as self-reported same-sex unmarried-partner households)
Lesbian couples: 0.1% of all households
Gay men: 0.0% of all households
Household received Food Stamps/SNAP in the past 12 months: 1,381 Household did not receive Food Stamps/SNAP in the past 12 months: 16,494
Women who had a birth in the past 12 months: 549 (284 now married, 259 unmarried) Women who did not have a birth in the past 12 months: 7,982 (3,165 now married, 4,816 unmarried)
Housing units in zip code 48183 with a mortgage: 7,773 (805 second mortgage, 14 home equity loan, 781 both second mortgage and home equity loan) Houses without a mortgage: 384
Median monthly owner costs for units with a mortgage: $1,547 Median monthly owner costs for units without a mortgage: $669
Residents with income below the poverty level in 2022:
This zip code:
10.5%
Whole state:
13.4%
Residents with income below 50% of the poverty level in 2022:
This zip code:
5.2%
Whole state:
6.9%
Median number of rooms in houses and condos:
Here:
6.2
State:
6.5
Median number of rooms in apartments:
Here:
3.9
State:
4.3
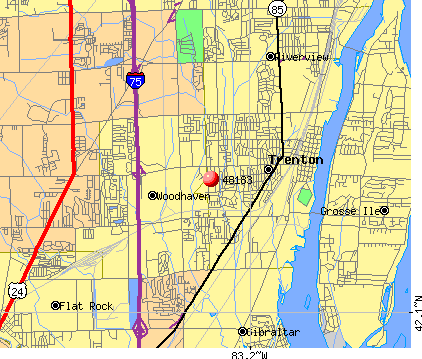
Notable locations in this zip code not listed on our city pages
Notable locations in zip code 48183: Trenton Riverside Marina (A), Detroit Dragway (B), Woodhaven City Hall (C), Woodhaven Fire Department Station 1 Headquarters (D), Woodhaven Police Station (E), Trenton Fire Department Station 1 Headquarters (F), Trenton Police Station (G), Henry Ford Medical Center - Woodhaven (H), Brownstown Township Fire Department Station 3 (I), Brownstown Township Hall (J), Brownstown Township Police Station (K), Oakwood Healthcare Center - Brownstown (L), Trenton Fire Department Station 2 (M), Woodhaven Fire Department Station 2 (N). Display/hide their locations on the map
Shopping Centers: Trenton Shopping Center (1), Woodhaven Village Square Shopping Center (2), Woodhaven Commons Shopping Center (3). Display/hide their locations on the map
Streams, rivers, and creeks: Gudith Drain (A), Blakely Drain (B), Clark Drain (C), Clee Drain (D), Number One Drain (E). Display/hide their locations on the map
Parks in zip code 48183 include: Affolter Park (1), Elizabeth Park (2), Fort-Allen Park (3), Frazier Park (4), Battle of Monguagon Historical Marker (5), Detroit River Historical Marker (6), Detroit River Recovery Historical Marker (7), Wagstaff-Duddleston Home Historical Marker (8), Haas Park (9). Display/hide their locations on the map
5,125 married couples with children.
2,869 single-parent households (530 men, 2,339 women).
95.1% of residents of 48183 zip code speak English at home.
1.4% of residents speak Spanish at home (73% very well, 23% well, 5% not well).
2.7% of residents speak other Indo-European language at home (65% very well, 22% well, 11% not well, 1% not at all).
0.7% of residents speak Asian or Pacific Island language at home (80% very well, 19% well, 1% not well).
0.2% of residents speak other language at home (93% very well, 7% not well).
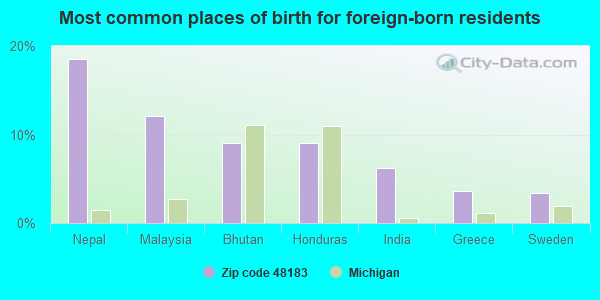
Foreign born population: 1,904 (4.5%) (68.0% of them are naturalized citizens)
This zip code:
4.5%
Whole state:
6.9%
19%Nepal
12%Malaysia
9%Bhutan
9%Honduras
6%India
4%Greece
3%Sweden
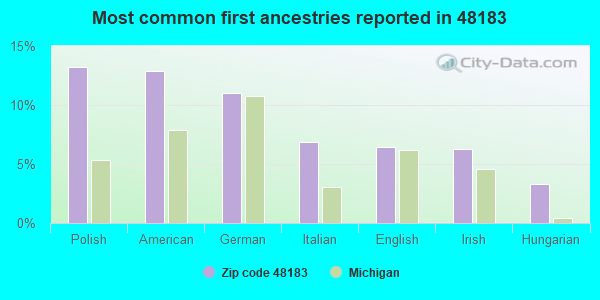
13%Polish
13%American
11%German
7%Italian
6%English
6%Irish
3%Hungarian
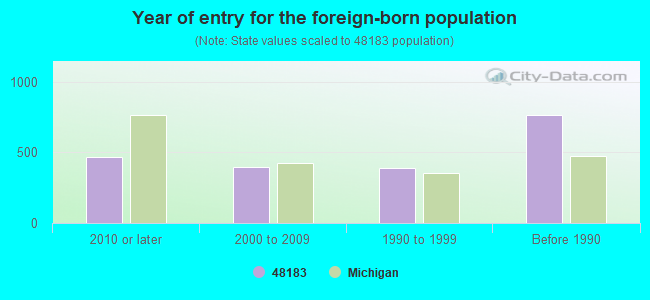
Year of entry for the foreign-born population
4682010 or later
3992000 to 2009
3881990 to 1999
764Before 1990
Public elementary/middle school in in zip code 48183 not listed on the city page:
Major facilities with environmental interests located in this zip code:
DSC LIMITED TRENTON PLANT (1491 WEST JEFFERSON AVENUE in TRENTON, MI)
AIR MAJOR (AIRS/AFS) (Integrated Compliance Information System) - ICIS-05-1996-0462, FORMAL ENFORCEMENT ACTION, ICIS-05-1995-0337, ICIS-05-1999-0517, ICIS-05-1996-0199, CRITERIA AND HAZARDOUS AIR POLLUTANT INVENTORY (Inventory of air pollution sources) National Pollutant Discharge Elimination System MAJOR (Tracking pollutant discharge elimination systems) - permit HAZARDOUS WASTE BIENNIAL REPORTER (Resource Conservation and Recovery Act (tracking hazardous waste)) - ICIS-, ENFORCEMENT/COMPLIANCE ACTIVITY Large Quantity Generators, more that 1000 kg of hazardous waste/month (Resource Conservation and Recovery Act (tracking hazardous waste)) - ICIS-, ENFORCEMENT/COMPLIANCE ACTIVITY TSD (Resource Conservation and Recovery Act (tracking hazardous waste)) - notification - ICIS-, ENFORCEMENT/COMPLIANCE ACTIVITY Large Quantity Generators, more that 1000 kg of hazardous waste/month (Resource Conservation and Recovery Act (tracking hazardous waste)) TRI REPORTER (Tracking of toxic chemicals releasing facilities) Business SIC classification: STEEL WORKS, BLAST FURNACES (INCLUDING COKE OVENS), AND ROLLING MILLS Organizations: DETROIT STEEL COMPANY (CONTACT/OPERATOR)
, DSC LTD (CONTACT/OWNER)
Alternative names: DETROIT STEEL CO., DETROIT STEEL CO., DSC TRENTON PLANT
ALLWASTE TANK CLEANING INC (27007 FORT ST in TRENTON, MI)
(Resource Conservation and Recovery Act (tracking hazardous waste)) HAZARDOUS WASTE BIENNIAL REPORTER (Resource Conservation and Recovery Act (tracking hazardous waste)) - ICIS-, ENFORCEMENT/COMPLIANCE ACTIVITY Large Quantity Generators, more that 1000 kg of hazardous waste/month (Resource Conservation and Recovery Act (tracking hazardous waste)) - ICIS-, ENFORCEMENT/COMPLIANCE ACTIVITY Organizations: ALLWASTE TANK CLEANING, INC. (CONTACT/OPERATOR)
Alternative names: ROGERS CARTAGE CO
DETROIT EDISON TRENTON CHANNEL POWER PLANT (4695 W. JEFFERSON AVE. in TRENTON, MI)
AIR MAJOR (AIRS/AFS) AIR PROGRAM (Clean Air Markets Division Business System) OIL CONTROL (Facility Response Plan for oil discharge) CRITERIA AND HAZARDOUS AIR POLLUTANT INVENTORY (Inventory of air pollution sources) National Pollutant Discharge Elimination System MAJOR (Tracking pollutant discharge elimination systems) - permit Conditionally Exempt Small Quantity Generators, less than 100 kg/month of hazardous waste (Resource Conservation and Recovery Act (tracking hazardous waste)) HAZARDOUS WASTE BIENNIAL REPORTER (Resource Conservation and Recovery Act (tracking hazardous waste)) Large Quantity Generators, more that 1000 kg of hazardous waste/month (Resource Conservation and Recovery Act (tracking hazardous waste)) USED OIL PROGRAM (Resource Conservation and Recovery Act (tracking hazardous waste)) TRI REPORTER (Tracking of toxic chemicals releasing facilities) Business SIC classification: ELECTRIC SERVICES Business NAICS classification: FOSSIL FUEL ELECTRIC POWER GENERATION.; FOSSIL FUEL ELECTRIC POWER GENERATION. Organizations: DETROIT EDISON COMPANY (CONTACT/OPERATOR)
Alternative names: DECO-TRENTON PLT, DETROIT EDISON CO. ENV. MGT. & RESOURCES, DETROIT EDISON CO TRENT CH CAR DUMP HSE, DETROIT EDISON CO. ENV. MGT. & RESOURCES, DETROIT EDISON TRENTON CHANNEL PLANT
EDW C LEVY COMPANY PLANTS 4 & 5 (55 KING RD in TRENTON, MI)
AIR MINOR (AIRS/AFS) (Integrated Compliance Information System) - ICIS-05-1986-0488, FORMAL ENFORCEMENT ACTION Conditionally Exempt Small Quantity Generators, less than 100 kg/month of hazardous waste (Resource Conservation and Recovery Act (tracking hazardous waste)) Business SIC classification: MINERALS AND EARTHS, GROUND OR OTHERWISE TREATED Business NAICS classification: GROUND OR TREATED MINERAL AND EARTH MANUFACTURING. Organizations: LEVY EDW C CO (CONTACT/OPERATOR)
Alternative names: LEVY EDW C CO PLT 4 AND 5
BATES ELEMENTARY SCHOOL (22811 GUDITH ROAD in WOODHAVEN, MI)
(National Center for Education Statistics) - STATE ID-00216 Organizations: WOODHAVEN-BROWNSTOWN SCHOOL DISTRICT (SCHOOL DISTRICT)
FRANK E. WEISS ELEM. SCHOOL (26631 REAUME ROAD in WOODHAVEN, MI)
(National Center for Education Statistics) - STATE ID-06951 Organizations: GIBRALTAR SCHOOL DISTRICT (SCHOOL DISTRICT)
FORD WOODHAVEN STAMPING PLANT (20900 WEST RD. in WOODHAVEN, MI)
CRITERIA AND HAZARDOUS AIR POLLUTANT INVENTORY (Inventory of air pollution sources) HAZARDOUS WASTE BIENNIAL REPORTER (Resource Conservation and Recovery Act (tracking hazardous waste)) Large Quantity Generators, more that 1000 kg of hazardous waste/month (Resource Conservation and Recovery Act (tracking hazardous waste)) - notification TRI REPORTER (Tracking of toxic chemicals releasing facilities) Business SIC classification: AUTOMOTIVE STAMPINGS Business NAICS classification: MOTOR VEHICLE METAL STAMPING. Organizations: FORD MOTOR CO WOODHAVEN STAMPING PLANT (CONTACT/OPERATOR)
, FORD MOTOR CO (CONTACT/OWNER)
Alternative names: FORD MOTOR CO WOODHAVEN STAMP, FORD-WOODHAVEN STAMPING PT
ERVING ELEMENTARY SCHOOL (24175 HALL ROAD in WOODHAVEN, MI)
(National Center for Education Statistics) - STATE ID-06682 Organizations: WOODHAVEN-BROWNSTOWN SCHOOL DISTRICT (SCHOOL DISTRICT)
ACUSTAR INCORPORATED (5437 WEST JEFFERSON AVENUE in TRENTON, MI)
(Resource Conservation and Recovery Act (tracking hazardous waste)) TRI REPORTER (Tracking of toxic chemicals releasing facilities) Business SIC classification: PAINTS, VARNISHES, LACQUERS, ENAMELS, AND ALLIED PRODUCTS; ADHESIVES AND SEALANTS Alternative names: ACUSTAR INC-CHEM DIV, CHRYSLER CORPORATION
FORD MOTOR COMPANY (WOODHAVEN STAMPING PLANT in WOODHAVEN, MI)
National Pollutant Discharge Elimination System NON-MAJOR (Tracking pollutant discharge elimination systems) - permit Business SIC classification: AUTOMOTIVE STAMPINGS Alternative names: FORD-WOODHAVEN STAMPING PT
GIBRALTAR SCHOOL DISTRICT (28291 FORT ST in TRENTON, MI)
(Resource Conservation and Recovery Act (tracking hazardous waste)) Organizations: LARRY M KORYCINSKI (CONTACT/OPERATOR)
E AND L TRANSPORT CO (21000 HAYDEN DR in WOODHAVEN, MI)
(Resource Conservation and Recovery Act (tracking hazardous waste)) Business NAICS classification: GENERAL FREIGHT TRUCKING, LONG-DISTANCE, TRUCKLOAD.
DETROITER TRUCKSTOP (21055 WEST RD in WOODHAVEN, MI)
Housing units lacking complete kitchen facilities: 1.0%
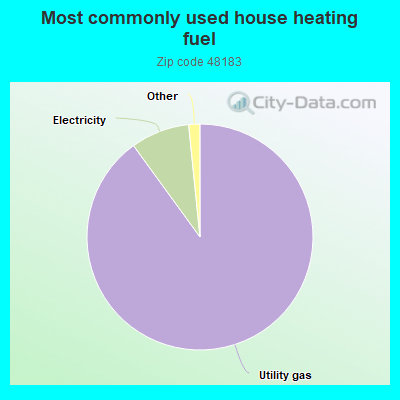
90.0%Utility gas
8.4%Electricity
0.6%Bottled, tank, or LP gas
0.5%No fuel used
Population in 1990: 38,874. Population change in the 1990s: +2,017 (+5.2%).
Place of birth for U.S.-born residents:
This state: 35,050
Northeast: 595
Midwest: 2,167
South: 1,942
West: 460
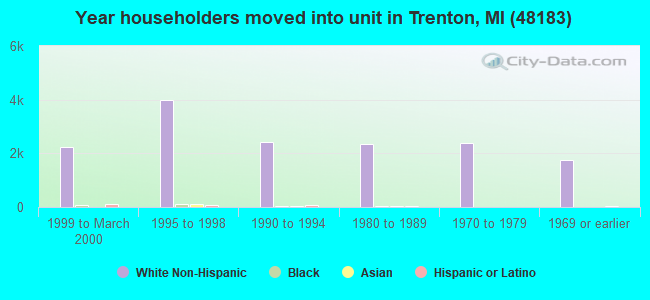
59% of the 48183 zip code residents lived in the same house 5 years ago. Out of people who lived in different houses, 83% lived in this county. Out of people who lived in different counties, 50% lived in Michigan.
92% of the 48183 zip code residents lived in the same house 1 year ago. Out of people who lived in different houses, 69% moved from this county. Out of people who lived in different houses, 10% moved from different county within same state. Out of people who lived in different houses, 22% moved from different state.
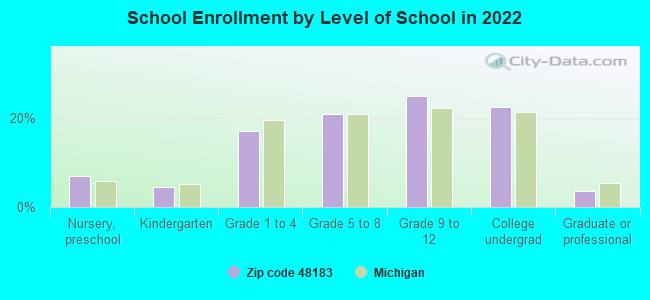
Private vs. public school enrollment:
Students in private schools in grades 1 to 8 (elementary and middle school): 265
Here:
7.9%
Michigan:
12.4%
Students in private schools in grades 9 to 12 (high school): 170
Here:
7.7%
Michigan:
9.8%
Students in private undergraduate colleges: 471
Here:
23.6%
Michigan:
14.9%
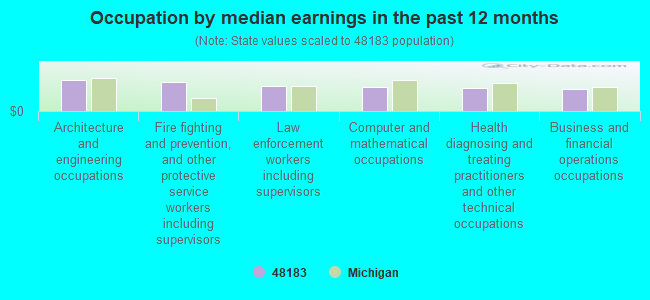
Occupation by median earnings in the past 12 months ($)
108,803Architecture and engineering occupations
100,280Fire fighting and prevention, and other protective service workers including supervisors
88,271Law enforcement workers including supervisors
82,404Computer and mathematical occupations
79,308Health diagnosing and treating practitioners and other technical occupations
78,098Business and financial operations occupations
Companies with federal contracts located in this zip code:
ABC PAVING COMPANY (2650 VAN HORN RD in TRENTON, MI) : $1,506,988 in 11 contractsfrom 2000 to 2005
Contracts for Maintenance, Repair or Alteration of Real Property -- Highways, Roads, Streets, Bridges, and Railways (includes resurfacing), Maintenance, Repair or Alteration of Real Property -- Airport Runways, Maintenance, Repair or Alteration of Real Property -- Miscellaneous Buildings, Maintenance, Repair or Alteration of Real Property -- Other Non-Building Facilities, and moreby Army, United States Coast Guard (disused code: now 7008), EPA Signed by year:2000: $74,000; 2001: $0; 2002: $540,000; 2003: $823,363; 2004: $11,325; 2005: $58,300; 2006: $0.
Biggest contracts:
$668,400 with Army for Maintenance, Repair or Alteration of Real Property -- Highways, Roads, Streets, Bridges, and Railways (includes resurfacing). Signed on 2003-09-20. Completion date: 2003-12-31.
$540,000 with Army for Maintenance, Repair or Alteration of Real Property -- Airport Runways. Signed on 2002-09-30. Completion date: 2003-04-10.
$117,203, same as above.Signed on 2003-09-27. Completion date: 2004-01-14.
$74,000 with United States Coast Guard (disused code: now 7008) for Maintenance, Repair or Alteration of Real Property -- Miscellaneous Buildings. Signed on 2000-06-15. Completion date: 2000-08-15.
PARKER MACHINE & ENGINEERING, (25028 RESEARCH WAY in WOODHAVEN, MI; small business) : $510,331 in 51 contractsfrom 2002 to 2006
Contracts for Valves, Powered, Miscellaneous Engine Accessories, Nonaircraft, Miscellaneous Power Transmission Equipment, Vehicular Power Transmission Components, and moreby Defense Logistics Agency, Army Signed by year:2000: $0; 2001: $0; 2002: $925; 2003: $0; 2004: $163,012; 2005: $275,232; 2006: $71,162.
Biggest contracts:
$59,356 with Defense Logistics Agency for Valves, Powered. Signed on 2004-03-09. Completion date: 2004-07-27.
$39,320 with Defense Logistics Agency for Miscellaneous Engine Accessories, Nonaircraft. Signed on 2005-10-12. Completion date: 2006-03-13.
$30,677 with Defense Logistics Agency for Miscellaneous Power Transmission Equipment. Signed on 2004-02-18. Completion date: 2004-08-06.
$22,691 with Defense Logistics Agency for Vehicular Power Transmission Components. Signed on 2005-07-21. Completion date: 2006-01-18.
AIR-FLO CLEANING SYSTEMS (21955 KING ROAD in TRENTON, MI; small business) : $474,497 in 20 contractsfrom 2000 to 2005
Contracts for Maintenance, Repair and Rebuilding of Equipment -- Furnace, Steam Plant, and Drying Equipment; and Nuclear Reactors, Other Housekeeping Services, Maintenance, Repair and Rebuilding of Equipment -- Miscellaneous, Maintenance, Repair and Rebuilding of Equipment -- Electric Wire, and Power and Distribution Equipment, and moreby Air Force, Department of Veterans Affairs, Army Signed by year:2000: $104,000; 2001: $85,055; 2002: $61,905; 2003: $70,461; 2004: $73,499; 2005: $79,577; 2006: $0.
Biggest contracts:
$76,598 with Air Force for Maintenance, Repair and Rebuilding of Equipment -- Furnace, Steam Plant, and Drying Equipment; and Nuclear Reactors. Taking place in OH. Signed on 2005-10-20. Completion date: 2006-09-30.
$60,000 with Department of Veterans Affairs for Other Housekeeping Services. Taking place in DC. Signed on 2000-03-15. Completion date: 2000-10-15.
$58,323 with Air Force for Maintenance, Repair and Rebuilding of Equipment -- Furnace, Steam Plant, and Drying Equipment; and Nuclear Reactors. Taking place in OH. Signed on 2004-11-19. Completion date: 2005-09-30.
$58,323, same as above.Signed on 2003-10-27. Completion date: 2004-09-30.
E C KORNEFFEL CO (2691 VERTERANS PARKWAY in TRENTON, MI; small business) : $188,580 in 2 contractsin 2001
$188,580 with U.S. Army Corps of Engineers - civil program financing only for Construction of Structures and Facilities -- Other Non-Building Facilities. Signed on 2001-11-27. Completion date: 2001-12-31.
$0, same as above.Signed on 2001-11-27. Completion date: 2001-12-31.
YAMATO INTERNATIONAL CORPORATI (22036 COMMERCE DR in WOODHAVEN, MI; small business) : $5,844 in 2 contractsin 2006
$5,844 with Army for Packaging and Packing Bulk Materials. Taking place in IN. Signed on 2006-03-09. Completion date: 2006-04-19.
$0, same as above.Signed on 2006-03-09. Completion date: 2006-04-19.
MICHIGAN PUMPING SERVICE, INC (605 HARRISON in TRENTON, MI; small business)
$3,080 with Army for Trash/Garbage Collection Services - Including Portable Sanitation Services. Signed on 2001-09-25. Completion date: 2001-06-01.
Top industries in this zip code by the number of employees in 2005:
Professional, Scientific, and Technical Services: Other Accounting Services (500-999 employees: 1 establishment, 20-49 employees: 1 establishment, 1-4 employees: 2 establishments)
2002 - 2018 National Fire Incident Reporting System (NFIRS) incidents
According to the data from the years 2002 - 2018 the average number of fire incidents per year is 134. The highest number of fire incidents - 191 took place in 2007, and the least - 99 in 2014. The data has a decreasing trend.
When looking into fire subcategories, the most incidents belonged to: Structure Fires (53.8%), and Outside Fires (23.6%).
Fire incident types reported to NFIRS in Zip Code 48183


 Nearest zip codes: 48193, 48173, 48138, 48195, 48134, 48192.


 (Students: 432, Location: 21320 ROCHE RD, Grades: PK-5)
 According to the data from the years 2002 - 2018 the average number of fire incidents per year is 134. The highest number of fire incidents - 191 took place in 2007, and the least - 99 in 2014. The data has a decreasing trend.
 When looking into fire subcategories, the most incidents belonged to: Structure Fires (53.8%), and Outside Fires (23.6%).