Estimated zip code population in 2022: 66,264 Zip code population in 2010: 61,132 Zip code population in 2000: 55,520
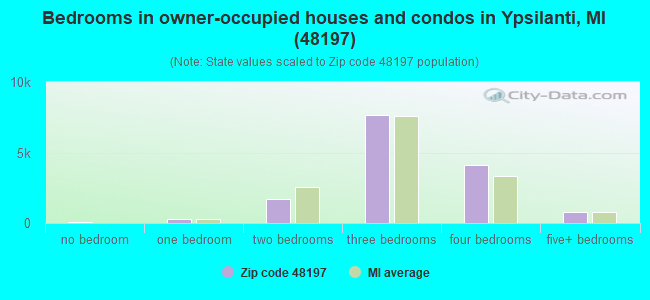
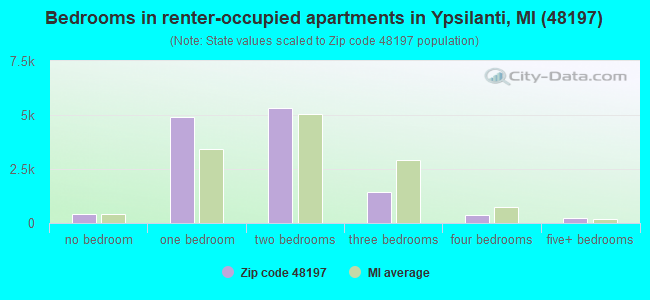
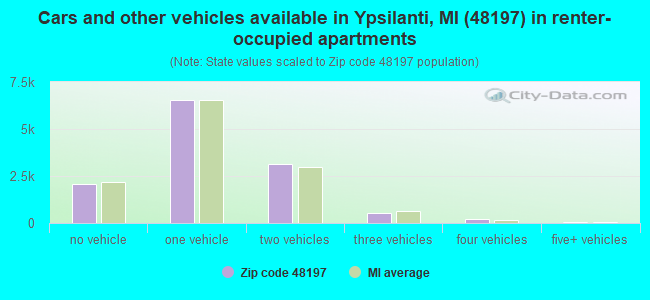
Houses and condos: 28,050 Renter-occupied apartments: 12,587
% of renters here:
46%
State:
27%
March 2022 cost of living index in zip code 48197: 100.3 (near average, U.S. average is 100)
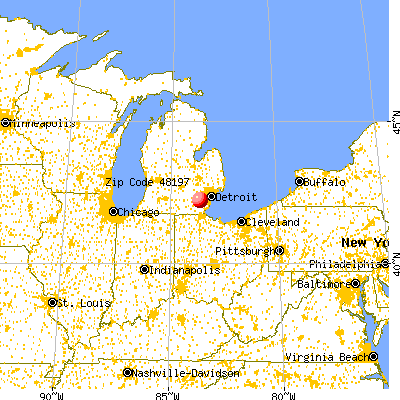
Land area: 41.9 sq. mi. Water area: 1.2 sq. mi.
Population density: 1,581 people per square mile
(low).
OSM Map
General Map
Google Map
MSN Map
OSM Map
General Map
Google Map
MSN Map
OSM Map
General Map
Google Map
MSN Map
OSM Map
General Map
Google Map
MSN Map
Please wait while loading the map...
Real estate property taxes paid for housing units in 2022:
This zip code:
1.6% ($4,512)
Michigan:
1.2% ($2,746)
Median real estate property taxes paid for housing units with mortgages in 2022: $4,678 (1.6%) Median real estate property taxes paid for housing units with no mortgage in 2022: $4,253 (1.6%)
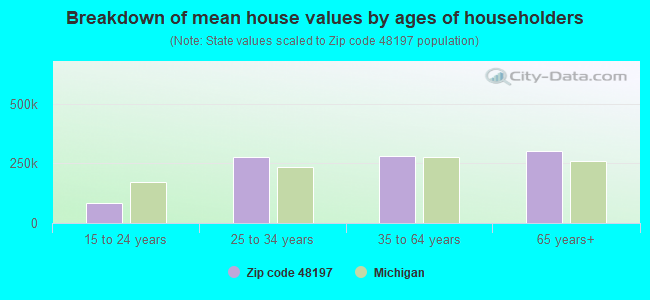
Estimated median house/condo value in 2022: $288,451
48197:
$288,451
Michigan:
$224,400
According to our research of Michigan and other state lists, there were 171 registered sex offenders living in 48197 zip code as of April 26, 2024. The ratio of all residents to sex offenders in zip code 48197 is 397 to 1. The ratio of registered sex offenders to all residents in this zip code is lower than the state average.
Median resident age:
This zip code:
32.4 years
Michigan median age:
40.3 years
Average household size:
This zip code:
2.3 people
Michigan:
2.4 people
Averages for the 2020 tax year for zip code 48197, filed in 2021:
Average Adjusted Gross Income (AGI) in 2020: $59,835 (Individual Income Tax Returns)
Here:
$59,835
State:
$68,945
Salary/wage: $55,048 (reported on 83.3% of returns)
Here:
$55,048
State:
$57,142
(% of AGI for various income ranges: 1025.1% for AGIs below $25k, 3478.6% for AGIs $25k-50k, 6608.0% for AGIs $50k-75k, 9616.9% for AGIs $75k-100k, 18803.6% for AGIs $100k-200k, 56718.3% for AGIs over 200k)
Taxable interest for individuals: $768 (reported on 25.6% of returns)
This zip code:
$768
Michigan:
$1,630
(% of AGI for various income ranges: 7.6% for AGIs below $25k, 12.8% for AGIs $25k-50k, 22.1% for AGIs $50k-75k, 43.6% for AGIs $75k-100k, 65.8% for AGIs $100k-200k, 372.6% for AGIs over 200k)
Ordinary dividends: $3,186 (reported on 16.2% of returns)
Here:
$3,186
State:
$6,972
(% of AGI for various income ranges: 11.3% for AGIs below $25k, 24.1% for AGIs $25k-50k, 56.4% for AGIs $50k-75k, 102.1% for AGIs $75k-100k, 170.4% for AGIs $100k-200k, 1438.3% for AGIs over 200k)
Net capital gain/loss in AGI: +$8,454 (reported on 15.2% of returns)
Here:
+$8,454
State:
+$20,064
(% of AGI for various income ranges: 8.0% for AGIs below $25k, 19.7% for AGIs $25k-50k, 60.1% for AGIs $50k-75k, 150.6% for AGIs $75k-100k, 360.8% for AGIs $100k-200k, 6542.3% for AGIs over 200k)
Profit/loss from business: +$8,248 (reported on 17.0% of returns)
Here:
+$8,248
State:
+$11,172
(% of AGI for various income ranges: 95.0% for AGIs below $25k, 124.9% for AGIs $25k-50k, 185.4% for AGIs $50k-75k, 205.6% for AGIs $75k-100k, 406.8% for AGIs $100k-200k, 2059.7% for AGIs over 200k)
Taxable individual retirement arrangement distribution: $17,722 (reported on 6.5% of returns)
48197:
$17,722
Michigan:
$19,803
(% of AGI for various income ranges: 26.6% for AGIs below $25k, 58.7% for AGIs $25k-50k, 143.2% for AGIs $50k-75k, 289.4% for AGIs $75k-100k, 523.5% for AGIs $100k-200k, 1516.0% for AGIs over 200k)
Self-employed (Keogh) retirement plans: $14,538 (reported on 0.3% of returns)
48197:
$14,538
Michigan:
$25,132
(% of AGI for various income ranges: 19.7% for AGIs $100k-200k, 176.6% for AGIs over 200k)
Total itemized deductions: $26,081 (reported on 7.4% of returns)
Here:
$26,081
State:
$34,117
(% of AGI for various income ranges: 31.9% for AGIs below $25k, 80.8% for AGIs $25k-50k, 288.8% for AGIs $50k-75k, 496.7% for AGIs $75k-100k, 813.9% for AGIs $100k-200k, 3031.4% for AGIs over 200k)
Charity contributions: $9,331 (reported on 5.7% of returns)
Here:
$9,331
State:
$13,548
(% of AGI for various income ranges: 2.7% for AGIs below $25k, 12.8% for AGIs $25k-50k, 50.4% for AGIs $50k-75k, 98.4% for AGIs $75k-100k, 250.9% for AGIs $100k-200k, 1399.4% for AGIs over 200k)
Taxes paid: $7,942 (reported on 7.4% of returns)
48197:
$7,942
State:
$7,972
(% of AGI for various income ranges: 4.9% for AGIs below $25k, 22.2% for AGIs $25k-50k, 92.4% for AGIs $50k-75k, 175.6% for AGIs $75k-100k, 269.8% for AGIs $100k-200k, 713.1% for AGIs over 200k)
Earned income credit: $2,008 (reported on 13.0% of returns)
Here:
$2,008
State:
$2,251
(% of AGI for various income ranges: 64.1% for AGIs below $25k, 53.1% for AGIs $25k-50k, 0.8% for AGIs $50k-75k)
Percentage of individuals using paid preparers for their 2020 taxes: 92.9%
Here:
93%
State:
93%
(% for various income ranges: 91.8% for AGIs below $25k, 94.2% for AGIs $25k-50k, 93.8% for AGIs $50k-75k, 92.7% for AGIs $75k-100k, 92.0% for AGIs $100k-200k, 94.6% for AGIs over 200k)
Averages for the 2012 tax year for zip code 48197, filed in 2013:
Average Adjusted Gross Income (AGI) in 2012: $48,356 (Individual Income Tax Returns)
Here:
$48,356
State:
$55,609
Salary/wage: $44,396 (reported on 88.1% of returns)
Here:
$44,396
State:
$46,782
(% of AGI for various income ranges: 78.4% for AGIs below $25k, 82.6% for AGIs $25k-50k, 81.2% for AGIs $50k-75k, 82.1% for AGIs $75k-100k, 83.9% for AGIs $100k-200k, 66.3% for AGIs over 200k)
Taxable interest for individuals: $692 (reported on 26.6% of returns)
This zip code:
$692
Michigan:
$1,491
(% of AGI for various income ranges: 0.4% for AGIs below $25k, 0.3% for AGIs $25k-50k, 0.4% for AGIs $50k-75k, 0.3% for AGIs $75k-100k, 0.3% for AGIs $100k-200k, 0.8% for AGIs over 200k)
Ordinary dividends: $2,652 (reported on 14.8% of returns)
Here:
$2,652
State:
$6,225
(% of AGI for various income ranges: 0.8% for AGIs below $25k, 0.6% for AGIs $25k-50k, 0.7% for AGIs $50k-75k, 0.7% for AGIs $75k-100k, 0.7% for AGIs $100k-200k, 2.1% for AGIs over 200k)
Net capital gain/loss in AGI: +$3,470 (reported on 11.4% of returns)
Here:
+$3,470
State:
+$9,326
(% of AGI for various income ranges: 0.1% for AGIs $25k-50k, 0.2% for AGIs $50k-75k, 0.3% for AGIs $75k-100k, 0.7% for AGIs $100k-200k, 6.1% for AGIs over 200k)
Profit/loss from business: +$8,470 (reported on 15.3% of returns)
Here:
+$8,470
State:
+$11,523
(% of AGI for various income ranges: 8.3% for AGIs below $25k, 2.2% for AGIs $25k-50k, 1.4% for AGIs $50k-75k, 1.8% for AGIs $75k-100k, 1.7% for AGIs $100k-200k, 4.7% for AGIs over 200k)
Taxable individual retirement arrangement distribution: $13,580 (reported on 6.5% of returns)
48197:
$13,580
Michigan:
$15,298
(% of AGI for various income ranges: 1.5% for AGIs below $25k, 1.4% for AGIs $25k-50k, 1.6% for AGIs $50k-75k, 1.9% for AGIs $75k-100k, 2.1% for AGIs $100k-200k, 2.4% for AGIs over 200k)
Self-employment retirement plans: $18,129 (reported on 0.3% of returns)
48197:
$18,129
Michigan:
$20,834
Total itemized deductions: $18,721 (20% of AGI, reported on 31.5% of returns)
Here:
$18,721
State:
$21,628
Here:
20.4% of AGI
State:
18.4% of AGI
(% of AGI for various income ranges: 5.7% for AGIs below $25k, 9.1% for AGIs $25k-50k, 12.8% for AGIs $50k-75k, 14.5% for AGIs $75k-100k, 14.5% for AGIs $100k-200k, 12.1% for AGIs over 200k)
Charity contributions: $3,498 (reported on 26.0% of returns)
Here:
$3,498
State:
$4,225
(% of AGI for various income ranges: 0.5% for AGIs below $25k, 1.3% for AGIs $25k-50k, 1.7% for AGIs $50k-75k, 2.0% for AGIs $75k-100k, 2.4% for AGIs $100k-200k, 2.9% for AGIs over 200k)
Taxes paid: $6,957 (reported on 31.4% of returns)
48197:
$6,957
State:
$8,327
(% of AGI for various income ranges: 1.4% for AGIs below $25k, 2.6% for AGIs $25k-50k, 4.4% for AGIs $50k-75k, 5.4% for AGIs $75k-100k, 5.9% for AGIs $100k-200k, 5.4% for AGIs over 200k)
Earned income credit: $2,138 (reported on 17.9% of returns)
Here:
$2,138
State:
$2,306
(% of AGI for various income ranges: 6.2% for AGIs below $25k, 0.9% for AGIs $25k-50k)
Percentage of individuals using paid preparers for their 2012 taxes: 48.1%
Here:
48%
State:
57%
(% for various income ranges: 48.0% for AGIs below $25k, 46.8% for AGIs $25k-50k, 48.6% for AGIs $50k-75k, 49.6% for AGIs $75k-100k, 47.8% for AGIs $100k-200k, 63.2% for AGIs over 200k)
Averages for the 2004 tax year for zip code 48197, filed in 2005:
Average Adjusted Gross Income (AGI) in 2004: $47,122 (Individual Income Tax Returns)
Here:
$47,122
State:
$48,204
Salary/wage: $44,512 (reported on 90.6% of returns)
Here:
$44,512
State:
$42,791
(% of AGI for various income ranges: 106.4% for AGIs below $10k, 82.0% for AGIs $10k-25k, 85.8% for AGIs $25k-50k, 87.6% for AGIs $50k-75k, 89.5% for AGIs $75k-100k, 81.7% for AGIs over 100k)
Taxable interest for individuals: $1,012 (reported on 41.8% of returns)
This zip code:
$1,012
Michigan:
$1,725
(% of AGI for various income ranges: 3.2% for AGIs below $10k, 1.3% for AGIs $10k-25k, 0.7% for AGIs $25k-50k, 0.6% for AGIs $50k-75k, 0.8% for AGIs $75k-100k, 1.0% for AGIs over 100k)
Taxable dividends: $1,833 (reported on 21.2% of returns)
Here:
$1,833
State:
$3,420
(% of AGI for various income ranges: 2.1% for AGIs below $10k, 1.0% for AGIs $10k-25k, 0.6% for AGIs $25k-50k, 0.5% for AGIs $50k-75k, 0.6% for AGIs $75k-100k, 1.1% for AGIs over 100k)
Net capital gain/loss: +$4,609 (reported on 15.8% of returns)
Here:
+$4,609
State:
+$8,532
(% of AGI for various income ranges: -1.1% for AGIs below $10k, 0.0% for AGIs $10k-25k, 0.4% for AGIs $25k-50k, 0.3% for AGIs $50k-75k, 0.6% for AGIs $75k-100k, 3.9% for AGIs over 100k)
Profit/loss from business: +$8,036 (reported on 13.0% of returns)
Here:
+$8,036
State:
+$9,547
(% of AGI for various income ranges: 5.3% for AGIs below $10k, 4.1% for AGIs $10k-25k, 2.1% for AGIs $25k-50k, 1.9% for AGIs $50k-75k, 1.1% for AGIs $75k-100k, 2.5% for AGIs over 100k)
IRA payment deduction: $2,669 (reported on 1.8% of returns)
48197:
$2,669
Michigan:
$2,875
(% of AGI for various income ranges: 0.2% for AGIs below $10k, 0.1% for AGIs $10k-25k, 0.2% for AGIs $25k-50k, 0.1% for AGIs $50k-75k, 0.1% for AGIs $75k-100k, 0.1% for AGIs over 100k)
Self-employed pension: $11,652 (reported on 0.5% of returns)
Here:
$11,652
Michigan:
$13,826
(% of AGI for various income ranges: 0.0% for AGIs $25k-50k, 0.0% for AGIs $50k-75k, 0.1% for AGIs $75k-100k, 0.2% for AGIs over 100k)
Total itemized deductions: $18,371 (23% of AGI, reported on 40.8% of returns)
Here:
$18,371
State:
$18,509
Here:
22.9% of AGI
State:
20.7% of AGI
(% of AGI for various income ranges: 11.4% for AGIs below $10k, 7.8% for AGIs $10k-25k, 12.6% for AGIs $25k-50k, 18.7% for AGIs $50k-75k, 19.2% for AGIs $75k-100k, 16.1% for AGIs over 100k)
Charity contributions deductions: $3,027 (4% of AGI, reported on 35.5% of returns)
Here:
$3,027
State:
$3,365
Here:
3.6% of AGI
State:
3.6% of AGI
(% of AGI for various income ranges: 0.7% for AGIs below $10k, 0.9% for AGIs $10k-25k, 1.6% for AGIs $25k-50k, 2.4% for AGIs $50k-75k, 2.7% for AGIs $75k-100k, 2.8% for AGIs over 100k)
Total tax: $6,412 (reported on 77.5% of returns)
48197:
$6,412
State:
$7,691
(% of AGI for various income ranges: 2.7% for AGIs below $10k, 4.3% for AGIs $10k-25k, 7.5% for AGIs $25k-50k, 9.2% for AGIs $50k-75k, 10.0% for AGIs $75k-100k, 15.1% for AGIs over 100k)
Earned income credit: $1,588 (reported on 12.7% of returns)
Here:
$1,588
State:
$1,737
Percentage of individuals using paid preparers for their 2004 taxes: 50.1%
Here:
50%
State:
60%
(% for various income ranges: 45.3% for AGIs below $10k, 53.2% for AGIs $10k-25k, 49.6% for AGIs $25k-50k, 51.8% for AGIs $50k-75k, 48.0% for AGIs $75k-100k, 53.0% for AGIs over 100k)
Likely homosexual households (counted as self-reported same-sex unmarried-partner households)
Lesbian couples: 0.3% of all households
Gay men: 0.3% of all households
Household received Food Stamps/SNAP in the past 12 months: 4,030 Household did not receive Food Stamps/SNAP in the past 12 months: 23,299
Women who had a birth in the past 12 months: 1,095 (634 now married, 453 unmarried) Women who did not have a birth in the past 12 months: 17,698 (5,351 now married, 12,384 unmarried)
Housing units in zip code 48197 with a mortgage: 9,595 (1,011 second mortgage, 7 home equity loan, 922 both second mortgage and home equity loan) Houses without a mortgage: 57
Median monthly owner costs for units with a mortgage: $1,751 Median monthly owner costs for units without a mortgage: $730
Residents with income below the poverty level in 2022:
This zip code:
13.8%
Whole state:
13.4%
Residents with income below 50% of the poverty level in 2022:
This zip code:
7.4%
Whole state:
6.9%
Median number of rooms in houses and condos:
Here:
6.6
State:
6.5
Median number of rooms in apartments:
Here:
3.7
State:
4.3
Notable locations in this zip code not listed on our city pages
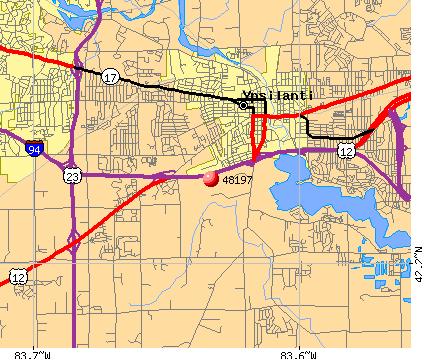
Notable locations in zip code 48197: Camp Crawford (A), Rynearson Stadium (B), Ypsilanti Station (C), Detroit Greenfield RV Park (D), Washtenaw Country Club (E), Eagle Crest Golf Club (F), Pine View Golf Course (G), President's Residence (H), Still Hall (I), Pease Auditorium (J), Ford Hall (K), Boone Hall (L), Pierce Hall (M), Starkweather Hall (N), Welch Hall (O), King Hall (P), McKenny Student Union (Q), Bowen Field House (R), Hoyt Hall (S), Goddard Residence Hall (T). Display/hide their locations on the map
Shopping Centers: Roundtree Village Shopping Center (1), Roundtree Place Shopping Center (2), Carpenter Plaza Shopping Center (3), Arbor Square Plaza Shopping Center (4), Ypsilanti Commons Shopping Center (5). Display/hide their locations on the map
Churches in zip code 48197 include: Friends Church (A), Saint Joseph Church (B), Ypsilanti Missionary Church (C), Labor of Love Church (D), Cross and Resurrection Lutheran Church (E), Community Freewill Baptist Church (F), Lincoln Community Methodist Church (G), Beautiful Gate Church (H), Huron Christian Church (I). Display/hide their locations on the map
Cemeteries: Alban Cemetery (1), Union-Udell Cemetery (2), Woodlawn Cemetery (3), Stony Creek Cemetery (4), Saint Luke's Episcopal Church Cloister Garth Cemetery (5), First Presbyterian Church Memorial Garden (6), Comstock Cemetery (7). Display/hide their locations on the map
Parks in zip code 48197 include: Eastern Michigan College Historical Marker (1), Elijah McCoy Historical Marker (2), First Methodist Episcopal Church Historical Marker (3), First Presbyterian Church Historical Marker (4), Ladies Literary Club Historical Marker (5), Ypsilanti Historical Marker (6), Ypsilanti Water Tower Historical Marker (7), Pine Park (8), Lakeside Park (9). Display/hide their locations on the map
8,248 married couples with children.
3,274 single-parent households (747 men, 2,527 women).
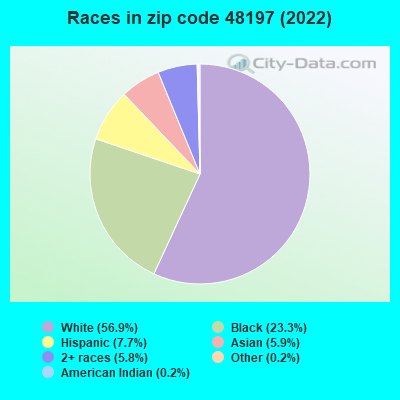
83.7% of residents of 48197 zip code speak English at home.
4.6% of residents speak Spanish at home (74% very well, 12% well, 11% not well, 4% not at all).
4.2% of residents speak other Indo-European language at home (72% very well, 18% well, 7% not well, 3% not at all).
3.1% of residents speak Asian or Pacific Island language at home (68% very well, 20% well, 11% not well, 2% not at all).
3.9% of residents speak other language at home (63% very well, 23% well, 9% not well, 4% not at all).
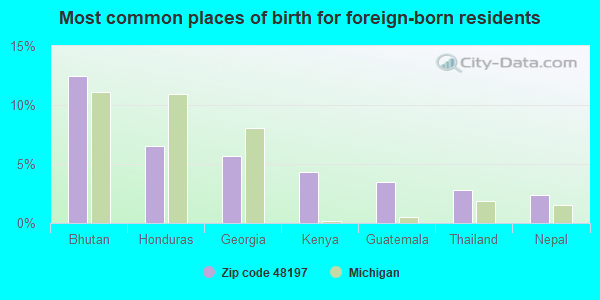
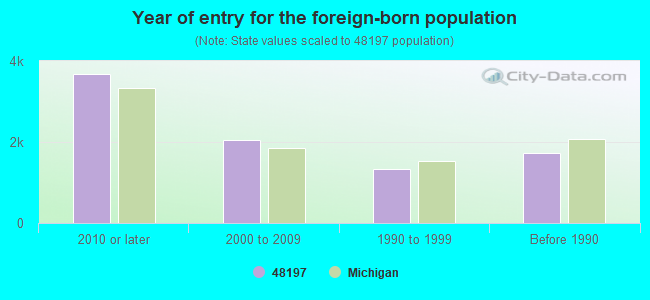
Foreign born population: 7,847 (11.8%) (60.3% of them are naturalized citizens)
Major facilities with environmental interests located in this zip code:
EASTERN MICHIGAN UNIVERSITY HEATING PLAN (700 OAKWOOD in YPSILANTI, MI)
(Integrated Compliance Information System) - ICIS-05-1988-0156, FORMAL ENFORCEMENT ACTION National Pollutant Discharge Elimination System NON-MAJOR (Tracking pollutant discharge elimination systems) - permit HAZARDOUS WASTE BIENNIAL REPORTER (Resource Conservation and Recovery Act (tracking hazardous waste)) (Resource Conservation and Recovery Act (tracking hazardous waste)) Organizations: EASTERN MICH UNIV-STEAM PLT (CONTACT/OWNER)
Alternative names: EASTERN MICHIGAN UNIVERSITY HEATING PLT, EASTERN MICH UNIV-STEAM PLT
ESTABROOK SCHOOL (1555 W. CROSS STREET in YPSILANTI, MI)
(Geographic Names Information System) (National Center for Education Statistics) - STATE ID-01157 Organizations: SCHOOL DISTRICT OF YPSILANTI (SCHOOL DISTRICT)
FORD MOTOR CO RAWSONVILLE PLANT (MCKEANE ROAD AND TEXTILE ROAD in YPSILANTI, MI)
AIR MAJOR (AIRS/AFS) CRITERIA AND HAZARDOUS AIR POLLUTANT INVENTORY (Inventory of air pollution sources) HAZARDOUS WASTE BIENNIAL REPORTER (Resource Conservation and Recovery Act (tracking hazardous waste)) Large Quantity Generators, more that 1000 kg of hazardous waste/month (Resource Conservation and Recovery Act (tracking hazardous waste)) - notification TRI REPORTER (Tracking of toxic chemicals releasing facilities) Business SIC classification: MOTOR VEHICLE PARTS AND ACCESSORIES Business NAICS classification: GASOLINE ENGINE AND ENGINE PARTS MANUFACTURING.; OTHER MOTOR VEHICLE ELECTRICAL AND ELECTRONIC EQUIPMENT MANUFACTURING. Organizations: MARK WILLIS (CONTACT/OPERATOR)
Alternative names: VISTEON CORP. RAWSONVILLE PLANT, VISTEON CORP. RAWSONVILLE PLANT, VISTEON RAWSONVILLE PLANT
CHILD'S ELEMENTARY (7300 BEMIS in YPSILANTI, MI)
(National Center for Education Statistics) - STATE ID-09148 Organizations: LINCOLN CONSOLIDATED SCHOOL DISTRICT (SCHOOL DISTRICT)
CHAPELLE COMMUNITY SCHOOL (111 S. WALLACE BOULEVARD in YPSILANTI, MI)
(National Center for Education Statistics) - STATE ID-00988 Organizations: SCHOOL DISTRICT OF YPSILANTI (SCHOOL DISTRICT)
ARDIS RENAISSANCE ACADEMY (2100 ELLSWORTH ROAD in YPSILANTI, MI)
(National Center for Education Statistics) - STATE ID-06129 Organizations: SCHOOL DISTRICT OF YPSILANTI (SCHOOL DISTRICT)
AMERICAN AGRI PRODUCTS INC (1574 MARGARITA ST in YPSILANTI, MI)
(Integrated Compliance Information System) - ICIS-05-1985-0220, FORMAL ENFORCEMENT ACTION Business SIC classification: NONCLASSIFIABLE ESTABLISHMENTS
GENERAL MOTORS CORPORATION (2930 ECORSE ROAD in YPSILANTI, MI)
HAZARDOUS WASTE BIENNIAL REPORTER (Resource Conservation and Recovery Act (tracking hazardous waste)) Large Quantity Generators, more that 1000 kg of hazardous waste/month (Resource Conservation and Recovery Act (tracking hazardous waste)) TSD (Resource Conservation and Recovery Act (tracking hazardous waste)) Organizations: GM POWERTRAIN (CONTACT/OPERATOR)
Alternative names: GM POWERTRAIN, GMC HYDRA-MATIC DIV YPSILANTI
CHARTER TOWNSHIP OF YPSILANTI (7200 SOUTH HURON RIVER DRIVE in YPSILANTI, MI)
National Pollutant Discharge Elimination System NON-MAJOR (Tracking pollutant discharge elimination systems) - permit Conditionally Exempt Small Quantity Generators, less than 100 kg/month of hazardous waste (Resource Conservation and Recovery Act (tracking hazardous waste)) - notification Organizations: CHARTER TWP OF YPSILANTI (CONTACT/OWNER)
ALLSTAR AUTOMOTIVE LLC (320 S FORD in YPSILANTI, MI)
(Resource Conservation and Recovery Act (tracking hazardous waste)) Organizations: CHRIS FREITAS (CONTACT/OWNER)
ALPHA ENVIRONMENTAL SERVICES INC (4995 CARPENTER RD. in YPSILANTI, MI)
HAZARDOUS WASTE BIENNIAL REPORTER (Resource Conservation and Recovery Act (tracking hazardous waste)) TRANSPORTER (Resource Conservation and Recovery Act (tracking hazardous waste)) Business NAICS classification: HAZARDOUS WASTE COLLECTION. Organizations: DAVID CLYDE (PROPERTY OWNER) (CONTACT/OWNER)
Alternative names: EQIS
MI DEPT/TRANSPORTATION BRIDGE (I-94 UNDER RAWSONVILLE RD in YPSILANTI, MI)
(Resource Conservation and Recovery Act (tracking hazardous waste)) Organizations: MICH DEPT OF TRANSPORTATION (CONTACT/OPERATOR)
Alternative names: MIDOT BRIDGE I-94 UNDER RAWSONVILLE RD
MI DEPT/TRANSPORTATION (NE QUADRANT US 12 BL AND WIARD in YPSILANTI, MI)
(Resource Conservation and Recovery Act (tracking hazardous waste)) Organizations: MICH DEPT OF TRANSPORTATION (CONTACT/OPERATOR)
Alternative names: MIDOT RIGHT OF WAY US-12
Housing units lacking complete plumbing facilities: 0.2% Housing units lacking complete kitchen facilities: 0.5%
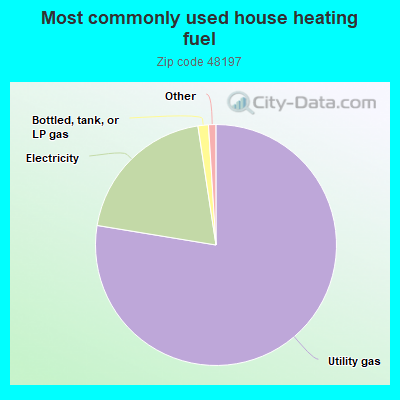
77.6%Utility gas
20.0%Electricity
1.4%Bottled, tank, or LP gas
Population in 1990: 46,790. Population change in the 1990s: +8,730 (+18.7%).
Place of birth for U.S.-born residents:
This state: 43,117
Northeast: 2,876
Midwest: 5,083
South: 4,200
West: 2,427
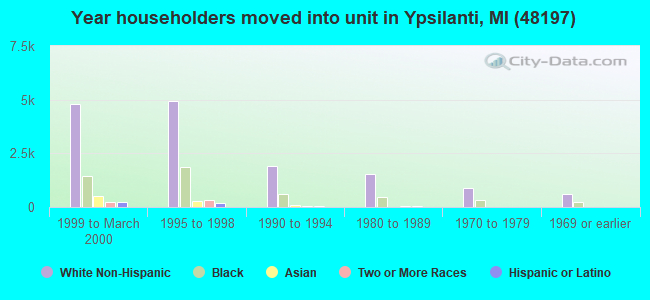
37% of the 48197 zip code residents lived in the same house 5 years ago. Out of people who lived in different houses, 44% lived in this county. Out of people who lived in different counties, 50% lived in Michigan.
85% of the 48197 zip code residents lived in the same house 1 year ago. Out of people who lived in different houses, 49% moved from this county. Out of people who lived in different houses, 33% moved from different county within same state. Out of people who lived in different houses, 13% moved from different state. Out of people who lived in different houses, 4% moved from abroad.
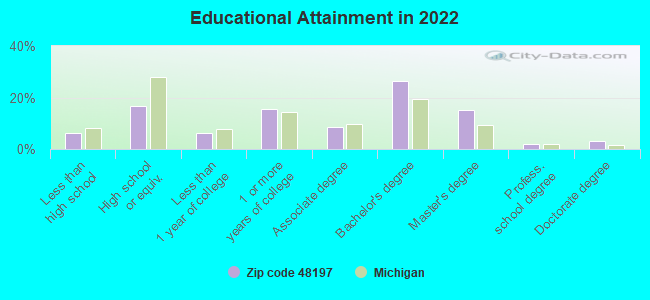
Private vs. public school enrollment:
Students in private schools in grades 1 to 8 (elementary and middle school): 1,014
Here:
17.3%
Michigan:
12.4%
Students in private schools in grades 9 to 12 (high school): 277
Here:
8.6%
Michigan:
9.8%
Students in private undergraduate colleges: 463
Here:
5.6%
Michigan:
14.9%
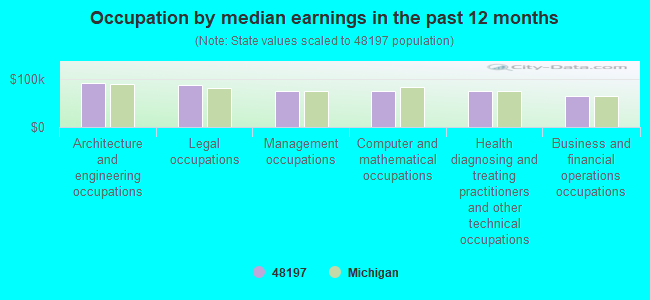
Occupation by median earnings in the past 12 months ($)
92,200Architecture and engineering occupations
87,494Legal occupations
76,292Management occupations
75,383Computer and mathematical occupations
74,531Health diagnosing and treating practitioners and other technical occupations
65,368Business and financial operations occupations
Companies with federal contracts located in this zip code (YPSILANTI, MI):
GENERAL DYNAMICS ADVANCED INFO (1200 JOE HALL DRIVE) : $19,154,327 in 86 contractsfrom 2001 to 2006
Contracts for Other Defense -- Applied Research and Exploratory Development (R&D), Other Research and Development -- Engineering Development (R&D), Maintenance, Repair and Rebuilding of Equipment -- Communication, Detection, and Coherent Radiation Equipment, Defense Missile and Space Systems -- Advanced Development (R&D), and moreby Department of Defense, Air Force, Navy, Defense Advanced Research Projects Agency, and others Signed by year:2000: $0; 2001: $2,820,564; 2002: $5,047,480; 2003: $1,705,198; 2004: $271,653; 2005: $8,149,225; 2006: $1,160,207.
Biggest contracts:
$4,657,326 with Department of Defense for Other Defense -- Applied Research and Exploratory Development (R&D). Signed on 2005-05-05. Completion date: 2006-01-01.
$2,391,343 with Air Force for Other Defense -- Applied Research and Exploratory Development (R&D). Taking place in VA. Signed on 2002-03-04. Completion date: 2003-06-30.
$1,396,991 with Air Force for Other Research and Development -- Engineering Development (R&D). Taking place in FL. Signed on 2005-09-12. Completion date: 2006-09-30.
$1,000,000 with Air Force for Other Defense -- Applied Research and Exploratory Development (R&D). Taking place in VA. Signed on 2001-09-14. Completion date: 2004-03-31.
EASTERN MICHIGAN UNIVERSITY (101 WELCH HALL) : $416,790 in 8 contractsfrom 2003 to 2005
Contracts for Educational Services, Tuition, Registration, and Membership Fees by Army, Air Force Signed by year:2000: $0; 2001: $0; 2002: $0; 2003: $164,981; 2004: $145,100; 2005: $106,709; 2006: $0.
Biggest contracts:
$164,981 with Army for Educational Services. Signed on 2003-06-06. Completion date: 2003-06-06.
$93,767, same as above.Signed on 2005-08-05. Completion date: 2005-08-05.
$73,790, same as above.Signed on 2004-07-16. Completion date: 2004-07-16.
$71,310, same as above.Signed on 2004-04-13. Completion date: 2004-04-13.
FACILITIES RESOURCING, LLC (3020 PACKARD ROAD; small business) : $396,586 in 56 contractsfrom 2005 to 2006
Contracts for Waste Treatment and Storage by Defense Logistics Agency Signed by year:2000: $0; 2001: $0; 2002: $0; 2003: $0; 2004: $0; 2005: $233,731; 2006: $162,855.
Biggest contracts:
$22,674 with Defense Logistics Agency for Waste Treatment and Storage. Taking place in AL. Signed on 2005-07-21. Completion date: 2005-08-20.
$20,732, same as above.Signed on 2006-01-31. Completion date: 2006-03-02.
$20,400, same as above.Signed on 2006-06-27. Completion date: 2006-07-27.
$20,400, same as above.Signed on 2006-04-13. Completion date: 2006-05-13.
AARON HARP (1101 PEARL ST) : $94,550 in 4 contractsfrom 2001 to 2005
$38,014 with U.S. Army Corps of Engineers - civil program financing only for Economic Studies. Taking place in MT. Signed on 2001-03-13. Completion date: 2001-07-13.
$34,058 with U.S. Army Corps of Engineers - civil program financing only for Environmental Studies and Assessments. Taking place in MT. Signed on 2003-07-18. Completion date: 2003-11-20.
$11,239 with Army for Certifications and Accreditations for products and institutions other than educational institutions. Taking place in WA. Signed on 2005-09-30. Completion date: 2005-10-31.
$11,239 with U.S. Army Corps of Engineers - civil program financing only for Certifications and Accreditations for products and institutions other than educational institutions. Taking place in WA. Signed on 2005-09-30. Completion date: 2005-10-31.
MOTIONPORT, LLC (3845 MAPLE DRIVE)
$71,165 with Army for Other ADP and Telecommunications Services (includes data storage on tapes, compact disks, etc.). Signed on 2004-04-16. Completion date: 2005-04-30.
INTERSTATE HOTELS & RESORTS IN (1275 SOUTH HURON STREET) : $12,616 in 4 contractsfrom 2005 to 2006
$6,120 with Army for Food Services. Signed on 2006-03-01. Completion date: 2006-03-04.
$3,284 with Drug Enforcement Administration for Training/Curriculum Development. Signed on 2005-11-08. Completion date: 2005-11-17.
$3,033 with Army for Education Services. Signed on 2005-02-14. Completion date: 2005-02-13.
$179 with Drug Enforcement Administration for Training/Curriculum Development. Signed on 2005-11-29. Completion date: 2005-11-29.
ROBERT HUGHES (2080 MIDVALE ST; small business)
$300 with Department of Veterans Affairs for Other Research and Development -- Management and Support (R&D). Signed on 2003-06-15. Completion date: 2005-01-15.
Top industries in this zip code by the number of employees in 2005:
Health Care and Social Assistance: Offices of Physicians (except Mental Health Specialists) (100-249 employees: 2 establishments, 50-99 employees: 2 establishments, 20-49 employees: 16 establishments, 10-19 employees: 10 establishments, 5-9 employees: 9 establishments, 1-4 employees: 25 establishments)
Administrative and Support and Waste Management and Remediation Services: Temporary Help Services (250-499: 2, 20-49: 1, 1-4: 1)
2002 - 2018 National Fire Incident Reporting System (NFIRS) incidents
Based on the data from the years 2002 - 2018 the average number of fire incidents per year is 129. The highest number of fires - 193 took place in 2003, and the least - 82 in 2010. The data has a dropping trend.
When looking into fire subcategories, the most incidents belonged to: Structure Fires (50.5%), and Outside Fires (28.8%).
Fire incident types reported to NFIRS in Zip Code 48197


 Nearest zip codes: 48190, 48108, 48198, 48191, 48104, 48109.


 Based on the data from the years 2002 - 2018 the average number of fire incidents per year is 129. The highest number of fires - 193 took place in 2003, and the least - 82 in 2010. The data has a dropping trend.
 When looking into fire subcategories, the most incidents belonged to: Structure Fires (50.5%), and Outside Fires (28.8%).