Estimated zip code population in 2022: 43,110 Zip code population in 2010: 39,038 Zip code population in 2000: 46,136
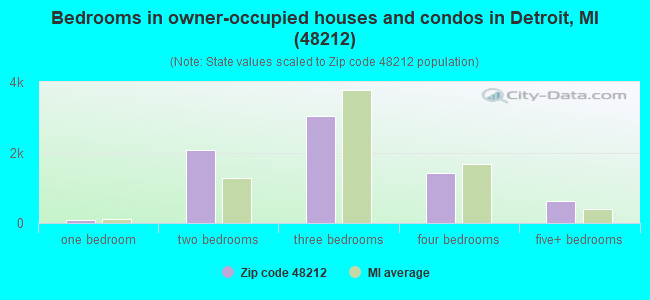
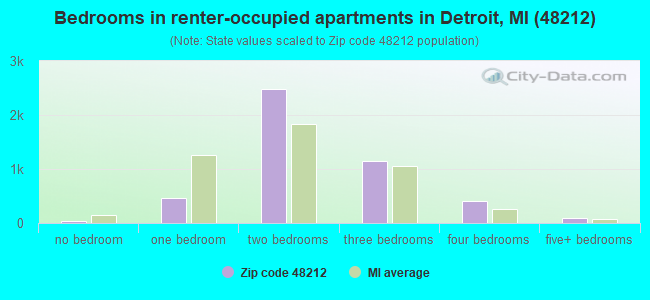
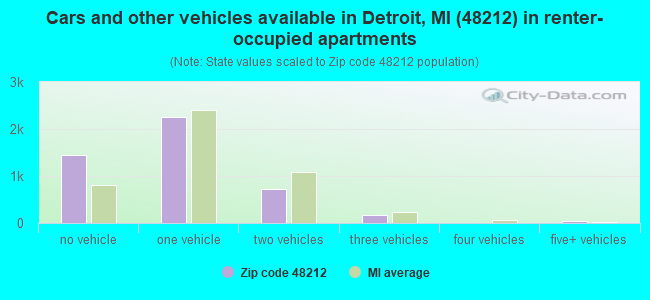
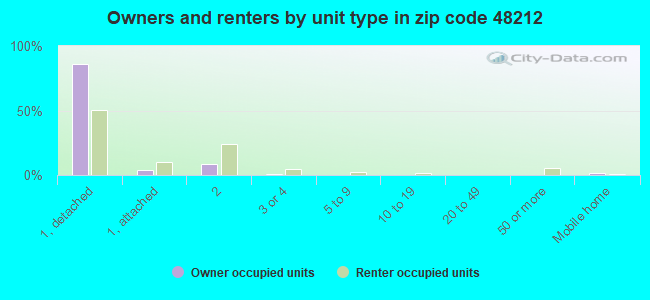
Houses and condos: 14,772 Renter-occupied apartments: 4,632
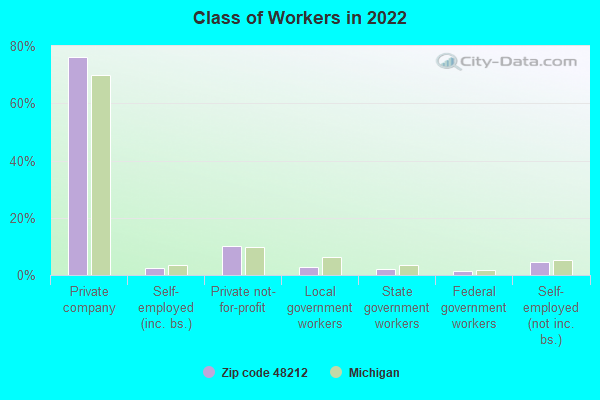
% of renters here:
39%
State:
27%
March 2022 cost of living index in zip code 48212: 94.6 (less than average, U.S. average is 100)
Land area: 5.3 sq. mi. Water area: 0.0 sq. mi.
Population density: 8,059 people per square mile
(high).
OSM Map
General Map
Google Map
MSN Map
OSM Map
General Map
Google Map
MSN Map
OSM Map
General Map
Google Map
MSN Map
OSM Map
General Map
Google Map
MSN Map
Please wait while loading the map...
Real estate property taxes paid for housing units in 2022:
This zip code:
1.5% ($1,451)
Michigan:
1.2% ($2,746)
Median real estate property taxes paid for housing units with mortgages in 2022: $1,556 (1.2%) Median real estate property taxes paid for housing units with no mortgage in 2022: $1,417 (1.7%)
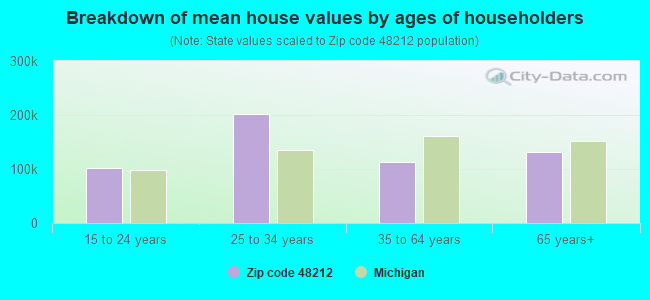
Estimated median house/condo value in 2022: $99,089
48212:
$99,089
Michigan:
$224,400
According to our research of Michigan and other state lists, there were 72 registered sex offenders living in 48212 zip code as of April 27, 2024. The ratio of all residents to sex offenders in zip code 48212 is 537 to 1. The ratio of registered sex offenders to all residents in this zip code is lower than the state average.
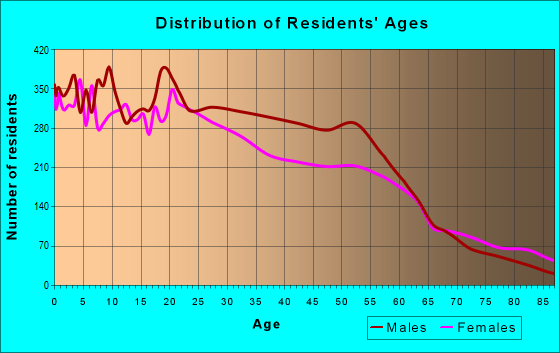
Median resident age:
This zip code:
30.4 years
Michigan median age:
40.3 years
Average household size:
This zip code:
3.5 people
Michigan:
2.4 people
Averages for the 2020 tax year for zip code 48212, filed in 2021:
Average Adjusted Gross Income (AGI) in 2020: $27,541 (Individual Income Tax Returns)
Here:
$27,541
State:
$68,945
Salary/wage: $24,005 (reported on 75.1% of returns)
Here:
$24,005
State:
$57,142
(% of AGI for various income ranges: 894.5% for AGIs below $25k, 2783.2% for AGIs $25k-50k, 6180.9% for AGIs $50k-75k, 10432.9% for AGIs $75k-100k, 15963.8% for AGIs $100k-200k)
Taxable interest for individuals: $393 (reported on 9.5% of returns)
This zip code:
$393
Michigan:
$1,630
(% of AGI for various income ranges: 2.0% for AGIs below $25k, 3.6% for AGIs $25k-50k, 18.0% for AGIs $50k-75k, 30.5% for AGIs $75k-100k, 56.2% for AGIs $100k-200k)
Ordinary dividends: $1,533 (reported on 2.9% of returns)
Here:
$1,533
State:
$6,972
(% of AGI for various income ranges: 2.0% for AGIs below $25k, 0.9% for AGIs $25k-50k, 25.6% for AGIs $50k-75k, 42.4% for AGIs $75k-100k, 148.5% for AGIs $100k-200k)
Net capital gain/loss in AGI: +$2,693 (reported on 5.2% of returns)
Here:
+$2,693
State:
+$20,064
(% of AGI for various income ranges: 0.8% for AGIs below $25k, 9.5% for AGIs $25k-50k, 52.8% for AGIs $50k-75k, 223.3% for AGIs $75k-100k, 576.9% for AGIs $100k-200k)
Profit/loss from business: +$5,013 (reported on 27.5% of returns)
Here:
+$5,013
State:
+$11,172
(% of AGI for various income ranges: 186.3% for AGIs below $25k, 172.3% for AGIs $25k-50k, 166.0% for AGIs $50k-75k, 351.9% for AGIs $75k-100k, 336.2% for AGIs $100k-200k)
Taxable individual retirement arrangement distribution: $8,560 (reported on 1.3% of returns)
48212:
$8,560
Michigan:
$19,803
(% of AGI for various income ranges: 5.8% for AGIs below $25k, 8.5% for AGIs $25k-50k, 62.2% for AGIs $50k-75k, 307.7% for AGIs $100k-200k)
Total itemized deductions: $20,958 (reported on 0.8% of returns)
Here:
$20,958
State:
$34,117
(% of AGI for various income ranges: 18.5% for AGIs $25k-50k, 97.8% for AGIs $50k-75k, 608.5% for AGIs $100k-200k)
Charity contributions: $10,111 (reported on 0.6% of returns)
Here:
$10,111
State:
$13,548
(% of AGI for various income ranges: 6.2% for AGIs $25k-50k, 41.8% for AGIs $50k-75k, 189.2% for AGIs $100k-200k)
Taxes paid: $5,317 (reported on 0.8% of returns)
48212:
$5,317
State:
$7,972
(% of AGI for various income ranges: 2.7% for AGIs $25k-50k, 26.5% for AGIs $50k-75k, 208.5% for AGIs $100k-200k)
Earned income credit: $3,079 (reported on 42.0% of returns)
Here:
$3,079
State:
$2,251
(% of AGI for various income ranges: 187.8% for AGIs below $25k, 202.5% for AGIs $25k-50k, 7.9% for AGIs $50k-75k)
Percentage of individuals using paid preparers for their 2020 taxes: 94.0%
Here:
94%
State:
93%
(% for various income ranges: 93.6% for AGIs below $25k, 95.1% for AGIs $25k-50k, 93.8% for AGIs $50k-75k, 93.9% for AGIs $75k-100k, 87.0% for AGIs $100k-200k, 100.0% for AGIs over 200k)
Averages for the 2012 tax year for zip code 48212, filed in 2013:
Average Adjusted Gross Income (AGI) in 2012: $20,490 (Individual Income Tax Returns)
Here:
$20,490
State:
$55,609
Salary/wage: $19,693 (reported on 76.0% of returns)
Here:
$19,693
State:
$46,782
(% of AGI for various income ranges: 65.2% for AGIs below $25k, 81.6% for AGIs $25k-50k, 81.3% for AGIs $50k-75k, 73.5% for AGIs $75k-100k, 64.5% for AGIs $100k-200k)
Taxable interest for individuals: $942 (reported on 12.1% of returns)
This zip code:
$942
Michigan:
$1,491
(% of AGI for various income ranges: 0.6% for AGIs below $25k, 0.4% for AGIs $25k-50k, 0.7% for AGIs $50k-75k, 0.4% for AGIs $75k-100k, 0.5% for AGIs $100k-200k)
Ordinary dividends: $1,742 (reported on 3.4% of returns)
Here:
$1,742
State:
$6,225
(% of AGI for various income ranges: 0.2% for AGIs below $25k, 0.3% for AGIs $25k-50k, 0.3% for AGIs $50k-75k, 0.3% for AGIs $75k-100k, 1.4% for AGIs $100k-200k)
Net capital gain/loss in AGI: +$538 (reported on 2.0% of returns)
Here:
+$538
State:
+$9,326
(% of AGI for various income ranges: 0.2% for AGIs $75k-100k, 0.3% for AGIs $100k-200k)
Profit/loss from business: +$8,821 (reported on 27.6% of returns)
Here:
+$8,821
State:
+$11,523
(% of AGI for various income ranges: 23.9% for AGIs below $25k, 3.9% for AGIs $25k-50k, 1.4% for AGIs $50k-75k, 2.0% for AGIs $75k-100k)
Taxable individual retirement arrangement distribution: $8,188 (reported on 2.5% of returns)
48212:
$8,188
Michigan:
$15,298
(% of AGI for various income ranges: 0.6% for AGIs below $25k, 0.7% for AGIs $25k-50k, 1.1% for AGIs $50k-75k, 7.1% for AGIs $75k-100k)
Total itemized deductions: $14,232 (26% of AGI, reported on 5.7% of returns)
Here:
$14,232
State:
$21,628
Here:
26.5% of AGI
State:
18.4% of AGI
(% of AGI for various income ranges: 1.7% for AGIs below $25k, 3.7% for AGIs $25k-50k, 7.4% for AGIs $50k-75k, 8.8% for AGIs $75k-100k, 9.6% for AGIs $100k-200k)
Charity contributions: $3,293 (reported on 4.3% of returns)
Here:
$3,293
State:
$4,225
(% of AGI for various income ranges: 0.2% for AGIs below $25k, 0.6% for AGIs $25k-50k, 1.4% for AGIs $50k-75k, 2.1% for AGIs $75k-100k, 2.0% for AGIs $100k-200k)
Taxes paid: $4,462 (reported on 5.6% of returns)
48212:
$4,462
State:
$8,327
(% of AGI for various income ranges: 0.3% for AGIs below $25k, 1.0% for AGIs $25k-50k, 2.6% for AGIs $50k-75k, 3.1% for AGIs $75k-100k, 4.5% for AGIs $100k-200k)
Earned income credit: $3,106 (reported on 53.2% of returns)
Here:
$3,106
State:
$2,306
(% of AGI for various income ranges: 16.5% for AGIs below $25k, 2.9% for AGIs $25k-50k)
Percentage of individuals using paid preparers for their 2012 taxes: 70.0%
Here:
70%
State:
57%
(% for various income ranges: 69.3% for AGIs below $25k, 72.8% for AGIs $25k-50k, 67.9% for AGIs $50k-75k, 70.6% for AGIs $75k-100k, 72.7% for AGIs $100k-200k)
Averages for the 2004 tax year for zip code 48212, filed in 2005:
Average Adjusted Gross Income (AGI) in 2004: $22,186 (Individual Income Tax Returns)
Here:
$22,186
State:
$48,204
Salary/wage: $21,595 (reported on 84.4% of returns)
Here:
$21,595
State:
$42,791
(% of AGI for various income ranges: 69.6% for AGIs below $10k, 77.5% for AGIs $10k-25k, 88.0% for AGIs $25k-50k, 86.2% for AGIs $50k-75k, 81.9% for AGIs $75k-100k, 68.9% for AGIs over 100k)
Taxable interest for individuals: $1,160 (reported on 23.1% of returns)
This zip code:
$1,160
Michigan:
$1,725
(% of AGI for various income ranges: 2.3% for AGIs below $10k, 1.1% for AGIs $10k-25k, 0.9% for AGIs $25k-50k, 1.5% for AGIs $50k-75k, 1.4% for AGIs $75k-100k, 1.5% for AGIs over 100k)
Taxable dividends: $1,643 (reported on 6.4% of returns)
Here:
$1,643
State:
$3,420
(% of AGI for various income ranges: 0.4% for AGIs below $10k, 0.3% for AGIs $10k-25k, 0.3% for AGIs $25k-50k, 0.4% for AGIs $50k-75k, 0.5% for AGIs $75k-100k, 3.4% for AGIs over 100k)
Net capital gain/loss: +$1,793 (reported on 3.3% of returns)
Here:
+$1,793
State:
+$8,532
(% of AGI for various income ranges: -0.1% for AGIs below $10k, 0.0% for AGIs $10k-25k, 0.2% for AGIs $25k-50k, 0.3% for AGIs $50k-75k, 0.5% for AGIs $75k-100k, 2.2% for AGIs over 100k)
Profit/loss from business: +$6,280 (reported on 14.7% of returns)
Here:
+$6,280
State:
+$9,547
(% of AGI for various income ranges: 19.7% for AGIs below $10k, 8.1% for AGIs $10k-25k, 1.2% for AGIs $25k-50k, 0.8% for AGIs $50k-75k, -0.3% for AGIs $75k-100k)
IRA payment deduction: $2,231 (reported on 1.0% of returns)
48212:
$2,231
Michigan:
$2,875
Total itemized deductions: $12,904 (30% of AGI, reported on 15.2% of returns)
Here:
$12,904
State:
$18,509
Here:
30.1% of AGI
State:
20.7% of AGI
(% of AGI for various income ranges: 4.4% for AGIs below $10k, 5.0% for AGIs $10k-25k, 10.6% for AGIs $25k-50k, 11.5% for AGIs $50k-75k, 11.1% for AGIs $75k-100k, 11.5% for AGIs over 100k)
Charity contributions deductions: $2,728 (6% of AGI, reported on 12.8% of returns)
Here:
$2,728
State:
$3,365
Here:
6.0% of AGI
State:
3.6% of AGI
(% of AGI for various income ranges: 0.2% for AGIs below $10k, 0.7% for AGIs $10k-25k, 1.8% for AGIs $25k-50k, 2.4% for AGIs $50k-75k, 2.3% for AGIs $75k-100k, 3.1% for AGIs over 100k)
Total tax: $2,401 (reported on 55.3% of returns)
48212:
$2,401
State:
$7,691
(% of AGI for various income ranges: 3.3% for AGIs below $10k, 3.1% for AGIs $10k-25k, 5.1% for AGIs $25k-50k, 9.2% for AGIs $50k-75k, 11.0% for AGIs $75k-100k, 15.1% for AGIs over 100k)
Earned income credit: $2,140 (reported on 40.4% of returns)
Here:
$2,140
State:
$1,737
Percentage of individuals using paid preparers for their 2004 taxes: 71.1%
Here:
71%
State:
60%
(% for various income ranges: 69.7% for AGIs below $10k, 74.1% for AGIs $10k-25k, 70.4% for AGIs $25k-50k, 62.7% for AGIs $50k-75k, 70.3% for AGIs $75k-100k, 72.2% for AGIs over 100k)
Likely homosexual households (counted as self-reported same-sex unmarried-partner households)
Lesbian couples: 0.0% of all households
Gay men: 0.1% of all households
Household received Food Stamps/SNAP in the past 12 months: 5,265 Household did not receive Food Stamps/SNAP in the past 12 months: 6,919
Women who had a birth in the past 12 months: 772 (675 now married, 109 unmarried) Women who did not have a birth in the past 12 months: 10,370 (4,408 now married, 5,954 unmarried)
Housing units in zip code 48212 with a mortgage: 1,799 (91 second mortgage, 59 both second mortgage and home equity loan) Houses without a mortgage: 70
Median monthly owner costs for units with a mortgage: $965 Median monthly owner costs for units without a mortgage: $485
Residents with income below the poverty level in 2022:
This zip code:
36.8%
Whole state:
13.4%
Residents with income below 50% of the poverty level in 2022:
This zip code:
20.0%
Whole state:
6.9%
Median number of rooms in houses and condos:
Here:
6.0
State:
6.5
Median number of rooms in apartments:
Here:
5.0
State:
4.3
Notable locations in this zip code not listed on our city pages
Notable locations in zip code 48212: Lasky Recreation Center (A), Mound Correctional Facility (B), Elisabeth Knapp Library (C), City of Detroit Fire Department Engine 47 Ladder 30 (D), Hamtramck Fire Department (E), Henry Ford Medical Center - Hamtramck (F). Display/hide their locations on the map
Churches in zip code 48212 include: Church of God of Baldwin (A), Cleansings Springs Missionary Baptist Church (B), Ukrainian Catholic Church of the Immaculate Conception (C), Joseph Campau Avenue Church of God in Christ (D), Zoar Evangelical Lutheran Church (E), Saint Peter Progressive Primitive Baptist Church (F), Greater Concord Missionary Baptist Church (G), Greater Missionary Baptist Church (H), Anderson Memorial Church of God and Christ (I). Display/hide their locations on the map
Parks in zip code 48212 include: Schuster Playground (1), Colonel John Francis Hamtramck Historical Marker (2), Commandant's Quarters Historical Marker (3), Dodge Brothers Historical Marker (4), Dodge Main Historical Marker (5), Saint Florian Church Historical Marker (6), Saint Florian Historic District Historical Marker (7), Saint Francis Hospital Historical Marker (8), Veterans Park (9). Display/hide their locations on the map
9,087 married couples with children.
1,710 single-parent households (335 men, 1,375 women).
37.3% of residents of 48212 zip code speak English at home.
0.2% of residents speak Spanish at home (58% very well, 20% well, 22% not well).
36.0% of residents speak other Indo-European language at home (25% very well, 34% well, 28% not well, 13% not at all).
0.6% of residents speak Asian or Pacific Island language at home (56% very well, 10% well, 16% not well, 19% not at all).
30.5% of residents speak other language at home (28% very well, 41% well, 23% not well, 9% not at all).
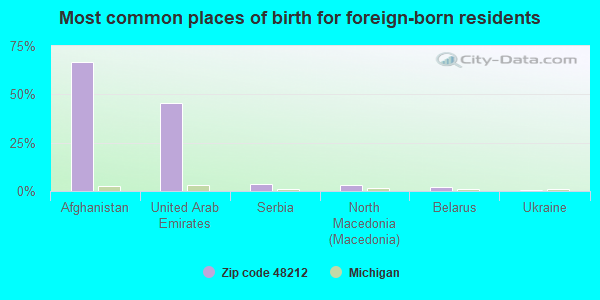
Foreign born population: 17,231 (40.0%) (53.0% of them are naturalized citizens)
This zip code:
40.0%
Whole state:
6.9%
67%Afghanistan
45%United Arab Emirates
4%Serbia
3%North Macedonia (Macedonia)
2%Belarus
0%Ukraine
0%Albania
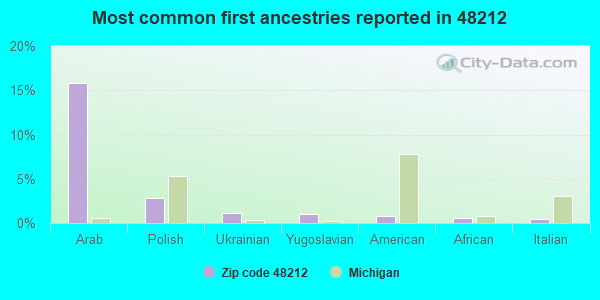
16%Arab
3%Polish
1%Ukrainian
1%Yugoslavian
1%American
1%African
0%Italian
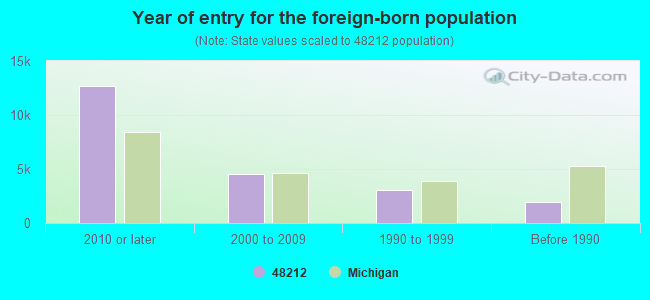
Year of entry for the foreign-born population
12,6732010 or later
4,5702000 to 2009
3,0201990 to 1999
1,928Before 1990
Major facilities with environmental interests located in this zip code:
AABCO WASTE OIL INC (17400 ST LOUIS RD in DETROIT, MI)
AIR MINOR (AIRS/AFS) COMPLIANCE ACTIVITY (Tracking inspections of insecticide, fungicide, and rodenticide, and toxic substances) (Resource Conservation and Recovery Act (tracking hazardous waste)) TRI REPORTER (Tracking of toxic chemicals releasing facilities) Business SIC classification: PAINTS, VARNISHES, LACQUERS, ENAMELS, AND ALLIED PRODUCTS Organizations: INMONT CORPORATION (CONTACT/OPERATOR)
Alternative names: BASF CORP-INMONT DIV., BASF COATINGS & INKS, INMONT CORP
GENERAL DIE CASTING CO (13700 MT ELLIOTT in DETROIT, MI)
SUPERFUND (Superfund database) (Integrated Compliance Information System) - ICIS-05-1992-0257, FORMAL ENFORCEMENT ACTION (Resource Conservation and Recovery Act (tracking hazardous waste)) Business NAICS classification: ALUMINUM FOUNDRIES (EXCEPT DIE-CASTING). Alternative names: GENERAL DYE CASTING
FITZGERALD FINISHING COMPANY (17450 FILER AVE. in DETROIT, MI)
AIR SYNTHETIC MINOR (AIRS/AFS) CRITERIA AND HAZARDOUS AIR POLLUTANT INVENTORY (Inventory of air pollution sources) HAZARDOUS WASTE BIENNIAL REPORTER (Resource Conservation and Recovery Act (tracking hazardous waste)) Large Quantity Generators, more that 1000 kg of hazardous waste/month (Resource Conservation and Recovery Act (tracking hazardous waste)) TRI REPORTER (Tracking of toxic chemicals releasing facilities) Business SIC classification: COATING, ENGRAVING, AND ALLIED SERVICES Business NAICS classification: METAL COATING, ENGRAVING (EXCEPT JEWELRY AND SILVERWARE), AND ALLIED SERVICES TO MANUFACTURERS. Organizations: GITRE JAMES R (CONTACT/OPERATOR)
, FITZGERALD FINISHING LLC (CONTACT/OPERATOR)
AMERICAN AXLE & MANUFACTURING INCORPORATED (1840 HOLBROOK AVE. in DETROIT, MI)
AIR MINOR (AIRS/AFS) CRITERIA AND HAZARDOUS AIR POLLUTANT INVENTORY (Inventory of air pollution sources) HAZARDOUS WASTE BIENNIAL REPORTER (Resource Conservation and Recovery Act (tracking hazardous waste)) Small Quantity Generators, between 100 kg and 1000 kg of hazardous waste/month (Resource Conservation and Recovery Act (tracking hazardous waste)) - notification TSD (Resource Conservation and Recovery Act (tracking hazardous waste)) TRI REPORTER (Tracking of toxic chemicals releasing facilities) Business SIC classification: IRON AND STEEL FORGINGS; MOTOR VEHICLES AND PASSENGER CAR BODIES; MOTOR VEHICLE PARTS AND ACCESSORIES Business NAICS classification: IRON AND STEEL FORGING. Organizations: AMERICAN AXLE & MANUFACTURING, INC. (CONTACT/OPERATOR)
Alternative names: AMERICAN AXLE & MFG.- GEAR
AMERICAN AXLE & MFG INC (8435 ST AUBIN AVE in DETROIT, MI)
AIR MINOR (AIRS/AFS) HAZARDOUS WASTE BIENNIAL REPORTER (Resource Conservation and Recovery Act (tracking hazardous waste)) Small Quantity Generators, between 100 kg and 1000 kg of hazardous waste/month (Resource Conservation and Recovery Act (tracking hazardous waste)) - notification TSD (Resource Conservation and Recovery Act (tracking hazardous waste)) Business SIC classification: IRON AND STEEL FORGINGS Business NAICS classification: IRON AND STEEL FORGING.; MACHINE TOOL (METAL FORMING TYPES) MANUFACTURING. Organizations: GMC CHEVROLET DETROIT FORGE (CONTACT/OPERATOR)
, AMERICAN AXLE & MANUFACTURING (CONTACT/OWNER)
, AMERICAN AXLE & MFG, DETROIT FORGE PLNT (CONTACT/OWNER)
Alternative names: AMERICAN AXLE DETROIT FORGE
AMERICAN STEEL CORPORATION (7170 EAST MCNICHOLS ROAD in DETROIT, MI)
AIR MINOR (AIRS/AFS) COMPLIANCE ACTIVITY (Tracking inspections of insecticide, fungicide, and rodenticide, and toxic substances) HAZARDOUS WASTE BIENNIAL REPORTER (Resource Conservation and Recovery Act (tracking hazardous waste)) (Resource Conservation and Recovery Act (tracking hazardous waste)) TRI REPORTER (Tracking of toxic chemicals releasing facilities) Business SIC classification: COLD-ROLLED STEEL SHEET, STRIP, AND BARS
DICKINSON WEST ELEMENTARY SCHOOL (2650 CANIFF STREET in HAMTRAMCK, MI)
(National Center for Education Statistics) - STATE ID-00916 Organizations: HAMTRAMCK PUBLIC SCHOOLS (SCHOOL DISTRICT)
EARLY CHILDHOOD ELEMENTARY SCHOOL (11680 MCDOUGALL in HAMTRAMCK, MI)
(National Center for Education Statistics) - STATE ID-08897 Organizations: HAMTRAMCK PUBLIC SCHOOLS (SCHOOL DISTRICT)
DICKINSON EAST ELEMENTARY SCHOOL (3385 NORWALK STREET in HAMTRAMCK, MI)
(National Center for Education Statistics) - STATE ID-07474 Organizations: HAMTRAMCK PUBLIC SCHOOLS (SCHOOL DISTRICT)
A AND R PACKING LLC (2211 ANDRUS STREET in HAMTRAMCK, MI)
(Integrated Compliance Information System) - ICIS-05-1997-0229, FORMAL ENFORCEMENT ACTION Business SIC classification: MEATS AND MEAT PRODUCTS
ABSO CLEAN CHEMICAL CO INC (17325 LAMONT AVE in DETROIT, MI)
COMPLIANCE ACTIVITY (Tracking inspections of insecticide, fungicide, and rodenticide, and toxic substances) (Resource Conservation and Recovery Act (tracking hazardous waste)) Alternative names: ABSO-CLEAN CO
CHARLES TERRACE (5512 BUFFALO COURT in DETROIT, MI)
HAZARDOUS WASTE BIENNIAL REPORTER (Resource Conservation and Recovery Act (tracking hazardous waste)) (Resource Conservation and Recovery Act (tracking hazardous waste)) Organizations: CITY OF DETROIT HOUSING DEPT (CONTACT/OWNER)
Housing units lacking complete plumbing facilities: 12.2% Housing units lacking complete kitchen facilities: 12.7%
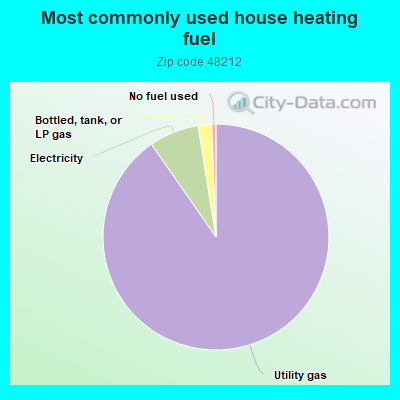
89.7%Utility gas
7.1%Electricity
1.9%Bottled, tank, or LP gas
0.6%No fuel used
Population in 1990: 42,830. Population change in the 1990s: +3,306 (+7.7%).
Place of birth for U.S.-born residents:
This state: 18,649
Northeast: 644
Midwest: 711
South: 1,257
West: 434
59% of the 48212 zip code residents lived in the same house 5 years ago. Out of people who lived in different houses, 67% lived in this county. Out of people who lived in different counties, 50% lived in Michigan.
93% of the 48212 zip code residents lived in the same house 1 year ago. Out of people who lived in different houses, 65% moved from this county. Out of people who lived in different houses, 16% moved from different county within same state. Out of people who lived in different houses, 11% moved from different state. Out of people who lived in different houses, 9% moved from abroad.
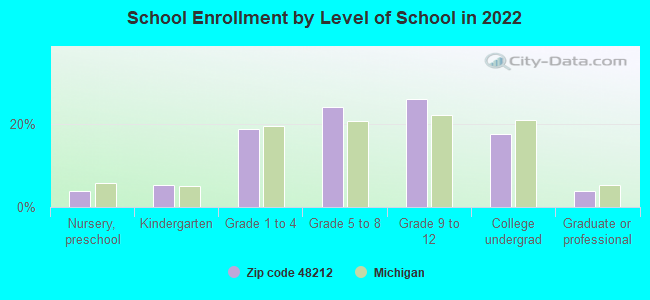
Private vs. public school enrollment:
Students in private schools in grades 1 to 8 (elementary and middle school): 445
Here:
9.3%
Michigan:
12.4%
Students in private schools in grades 9 to 12 (high school): 177
Here:
6.1%
Michigan:
9.8%
Students in private undergraduate colleges: 137
Here:
6.9%
Michigan:
14.9%
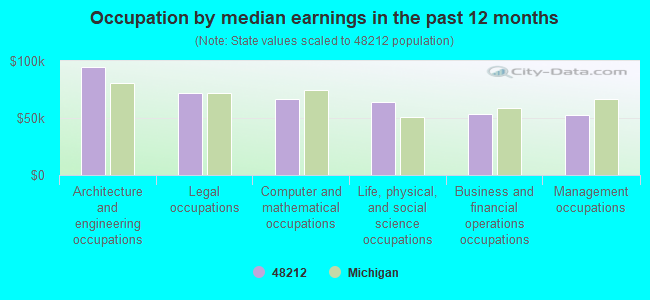
Occupation by median earnings in the past 12 months ($)
94,828Architecture and engineering occupations
72,230Legal occupations
66,531Computer and mathematical occupations
64,002Life, physical, and social science occupations
53,233Business and financial operations occupations
53,040Management occupations
Companies with federal contracts located in this zip code (DETROIT, MI):
KOWALSKI COMPANIES INC (2270 HOLBROOK AVE; small business) : $95,364 in 6 contractsfrom 2004 to 2006
Contracts for Food Items For Resale, Non-Food Items For Resale by Defense Commissary Agency Signed by year:2000: $0; 2001: $0; 2002: $0; 2003: $0; 2004: $20,368; 2005: $53,645; 2006: $21,351.
Biggest contracts:
$26,334 with Defense Commissary Agency for Food Items For Resale. Signed on 2005-04-01. Completion date: 2005-08-31.
$21,351 with Defense Commissary Agency for Non-Food Items For Resale. Signed on 2006-01-01. Completion date: 2006-03-31.
$20,368 with Defense Commissary Agency for Food Items For Resale. Signed on 2004-10-01. Completion date: 2005-02-28.
$14,250 with Defense Commissary Agency for Non-Food Items For Resale. Signed on 2005-10-01. Completion date: 2005-12-31.
CADILLAC ENAMELING TECHNOLOGIE (17425 SHERWOOD; small business)
$33,674 with Army for Miscellaneous Items. Signed on 2001-07-19. Completion date: 2001-08-17.
METROL COMPANY (7145 E DAVISON ST; small business)
$3,185 with Army for Combination and Miscellaneous Instruments. Signed on 2003-01-27. Completion date: 2003-02-18.
PROGRESSIVE MANUFACTURING (6000 CANIFF ST; small business)
$705 with Army for Miscellaneous Power Transmission Equipment. Signed on 2003-03-10. Completion date: 2003-03-14.
Top industries in this zip code by the number of employees in 2005:
Other Services (except Public Administration): Religious Organizations (20-49 employees: 3 establishments, 10-19 employees: 4 establishments, 5-9 employees: 5 establishments, 1-4 employees: 5 establishments)
Wholesale Trade: Metal Service Centers and Other Metal Merchant Wholesalers (50-99: 1, 20-49: 2, 10-19: 2, 5-9: 2, 1-4: 1)
Other Services (except Public Administration): Commercial and Industrial Machinery and Equipment (except Automotive and Electronic) Repair and Maintenance (100-249: 1, 1-4: 1)
Administrative and Support and Waste Management and Remediation Services: Solid Waste Collection (100-249: 1)
People in group quarters in 2010:
2,063 people in state prisons
152 people in nursing facilities/skilled-nursing facilities
27 people in other noninstitutional facilities
16 people in group homes intended for adults
10 people in residential treatment centers for adults
People in group quarters in 2000:
2,166 people in state prisons
224 people in nursing homes
11 people in religious group quarters
5 people in homes for the mentally ill
2 people in homes for the mentally retarded
Fatal accident statistics in 2014:
Fatal accident count: 2
Vehicles involved in fatal accidents: 3
Fatal accidents caused by drunken drivers: 1
Fatalities: 2
Persons involved in fatal accidents: 2
Pedestrians involved in fatal accidents: 2
Fatal accident statistics in 2013:
Fatal accident count: 2
Vehicles involved in fatal accidents: 2
Fatal accidents caused by drunken drivers: 1
Fatalities: 2
Persons involved in fatal accidents: 2
Pedestrians involved in fatal accidents: 0
Home Mortgage Disclosure Act Aggregated Statistics For Year 2009 (Based on 12 full and 16 partial tracts)
A) FHA, FSA/RHS & VA Home Purchase Loans
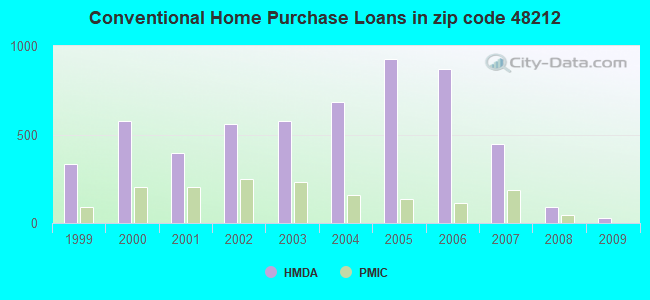
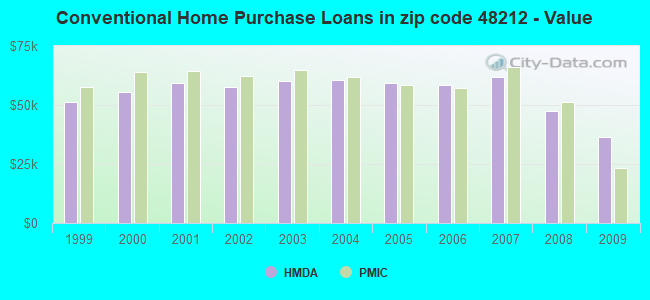
B) Conventional Home Purchase Loans
C) Refinancings
D) Home Improvement Loans
E) Loans on Dwellings For 5+ Families
F) Non-occupant Loans on < 5 Family Dwellings (A B C & D)
Number
Average Value
Number
Average Value
Number
Average Value
Number
Average Value
Number
Average Value
Number
Average Value
LOANS ORIGINATED
35
$62,743
26
$36,597
67
$48,621
34
$11,104
0
$0
7
$33,140
APPLICATIONS APPROVED, NOT ACCEPTED
9
$37,374
2
$117,790
24
$41,427
4
$9,665
0
$0
3
$44,867
APPLICATIONS DENIED
41
$45,204
28
$58,360
143
$52,678
102
$14,553
0
$0
35
$42,441
APPLICATIONS WITHDRAWN
10
$67,257
11
$49,604
40
$58,236
9
$43,591
0
$0
4
$42,640
FILES CLOSED FOR INCOMPLETENESS
1
$45,000
7
$36,163
17
$54,798
3
$33,100
2
$399,280
4
$41,160
Aggregated Statistics For Year 2008 (Based on 12 full and 16 partial tracts)
A) FHA, FSA/RHS & VA Home Purchase Loans
B) Conventional Home Purchase Loans
C) Refinancings
D) Home Improvement Loans
E) Loans on Dwellings For 5+ Families
F) Non-occupant Loans on < 5 Family Dwellings (A B C & D)
G) Loans On Manufactured Home Dwelling (A B C & D)
Number
Average Value
Number
Average Value
Number
Average Value
Number
Average Value
Number
Average Value
Number
Average Value
Number
Average Value
LOANS ORIGINATED
67
$58,584
92
$47,548
171
$51,591
67
$27,310
1
$109,000
54
$48,184
0
$0
APPLICATIONS APPROVED, NOT ACCEPTED
3
$73,967
27
$56,648
46
$64,987
31
$21,924
0
$0
19
$68,554
0
$0
APPLICATIONS DENIED
32
$71,705
113
$59,282
413
$65,578
215
$27,228
0
$0
112
$56,044
5
$30,174
APPLICATIONS WITHDRAWN
12
$63,971
32
$56,002
95
$74,487
12
$48,719
0
$0
16
$71,512
0
$0
FILES CLOSED FOR INCOMPLETENESS
2
$13,000
13
$56,388
34
$63,786
3
$17,650
0
$0
7
$82,114
0
$0
Aggregated Statistics For Year 2007 (Based on 12 full and 16 partial tracts)
A) FHA, FSA/RHS & VA Home Purchase Loans
B) Conventional Home Purchase Loans
C) Refinancings
D) Home Improvement Loans
E) Loans on Dwellings For 5+ Families
F) Non-occupant Loans on < 5 Family Dwellings (A B C & D)
G) Loans On Manufactured Home Dwelling (A B C & D)
Number
Average Value
Number
Average Value
Number
Average Value
Number
Average Value
Number
Average Value
Number
Average Value
Number
Average Value
LOANS ORIGINATED
25
$73,251
449
$61,965
487
$60,155
129
$28,516
1
$35,000
242
$60,737
0
$0
APPLICATIONS APPROVED, NOT ACCEPTED
0
$0
168
$61,010
193
$61,517
24
$33,632
0
$0
87
$61,921
0
$0
APPLICATIONS DENIED
15
$78,741
624
$68,608
943
$66,745
274
$27,773
2
$65,855
427
$65,010
5
$56,142
APPLICATIONS WITHDRAWN
9
$72,996
116
$67,039
252
$68,985
18
$48,344
0
$0
99
$58,337
0
$0
FILES CLOSED FOR INCOMPLETENESS
2
$64,715
73
$68,072
117
$73,147
3
$37,727
0
$0
36
$68,400
0
$0
Aggregated Statistics For Year 2006 (Based on 12 full and 16 partial tracts)
A) FHA, FSA/RHS & VA Home Purchase Loans
B) Conventional Home Purchase Loans
C) Refinancings
D) Home Improvement Loans
E) Loans on Dwellings For 5+ Families
F) Non-occupant Loans on < 5 Family Dwellings (A B C & D)
G) Loans On Manufactured Home Dwelling (A B C & D)
Number
Average Value
Number
Average Value
Number
Average Value
Number
Average Value
Number
Average Value
Number
Average Value
Number
Average Value
LOANS ORIGINATED
49
$72,058
868
$58,557
703
$59,747
140
$28,580
46
$37,695
458
$59,850
0
$0
APPLICATIONS APPROVED, NOT ACCEPTED
4
$55,528
366
$67,629
411
$69,101
36
$46,901
0
$0
198
$66,139
1
$36,000
APPLICATIONS DENIED
15
$43,207
1,033
$65,503
1,199
$68,294
364
$35,351
0
$0
621
$62,557
13
$41,114
APPLICATIONS WITHDRAWN
18
$72,033
267
$64,928
500
$73,558
22
$51,139
4
$352,172
168
$60,241
0
$0
FILES CLOSED FOR INCOMPLETENESS
4
$41,325
52
$63,247
155
$77,998
7
$53,763
0
$0
32
$70,766
2
$117,790
Aggregated Statistics For Year 2005 (Based on 12 full and 16 partial tracts)
A) FHA, FSA/RHS & VA Home Purchase Loans
B) Conventional Home Purchase Loans
C) Refinancings
D) Home Improvement Loans
E) Loans on Dwellings For 5+ Families
F) Non-occupant Loans on < 5 Family Dwellings (A B C & D)
G) Loans On Manufactured Home Dwelling (A B C & D)
Number
Average Value
Number
Average Value
Number
Average Value
Number
Average Value
Number
Average Value
Number
Average Value
Number
Average Value
LOANS ORIGINATED
28
$76,051
924
$59,358
992
$62,227
127
$32,085
0
$0
606
$59,222
2
$4,595
APPLICATIONS APPROVED, NOT ACCEPTED
7
$87,434
314
$59,370
423
$66,125
32
$40,143
0
$0
191
$60,365
2
$66,275
APPLICATIONS DENIED
11
$74,643
841
$63,060
1,348
$71,588
277
$35,062
1
$98,000
513
$61,010
10
$67,940
APPLICATIONS WITHDRAWN
6
$75,670
310
$78,631
676
$82,319
86
$104,604
0
$0
188
$72,857
0
$0
FILES CLOSED FOR INCOMPLETENESS
2
$122,500
71
$58,626
217
$76,477
8
$59,005
0
$0
42
$74,995
0
$0
Aggregated Statistics For Year 2004 (Based on 12 full and 16 partial tracts)
A) FHA, FSA/RHS & VA Home Purchase Loans
B) Conventional Home Purchase Loans
C) Refinancings
D) Home Improvement Loans
F) Non-occupant Loans on < 5 Family Dwellings (A B C & D)
G) Loans On Manufactured Home Dwelling (A B C & D)
Number
Average Value
Number
Average Value
Number
Average Value
Number
Average Value
Number
Average Value
Number
Average Value
LOANS ORIGINATED
50
$76,182
684
$60,506
1,306
$62,371
148
$26,408
471
$57,761
2
$79,720
APPLICATIONS APPROVED, NOT ACCEPTED
9
$60,014
251
$66,589
537
$65,146
37
$35,423
202
$62,153
5
$67,582
APPLICATIONS DENIED
28
$74,257
494
$63,170
1,351
$67,265
280
$24,171
366
$59,401
8
$47,656
APPLICATIONS WITHDRAWN
9
$82,424
155
$63,877
619
$70,023
46
$41,505
109
$62,551
0
$0
FILES CLOSED FOR INCOMPLETENESS
2
$39,705
33
$56,400
140
$71,764
9
$42,168
34
$56,426
0
$0
Aggregated Statistics For Year 2003 (Based on 12 full and 16 partial tracts)
A) FHA, FSA/RHS & VA Home Purchase Loans
B) Conventional Home Purchase Loans
C) Refinancings
D) Home Improvement Loans
F) Non-occupant Loans on < 5 Family Dwellings (A B C & D)
Number
Average Value
Number
Average Value
Number
Average Value
Number
Average Value
Number
Average Value
LOANS ORIGINATED
95
$71,877
577
$60,186
1,632
$61,857
191
$16,905
401
$55,609
APPLICATIONS APPROVED, NOT ACCEPTED
6
$86,933
170
$59,271
457
$64,440
47
$16,563
131
$56,951
APPLICATIONS DENIED
26
$62,871
280
$61,028
1,192
$62,991
311
$14,221
310
$48,879
APPLICATIONS WITHDRAWN
6
$86,068
134
$66,077
528
$69,970
19
$24,593
95
$55,066
FILES CLOSED FOR INCOMPLETENESS
2
$65,880
42
$64,215
103
$67,562
4
$16,605
16
$55,808
Aggregated Statistics For Year 2002 (Based on 12 full and 16 partial tracts)
A) FHA, FSA/RHS & VA Home Purchase Loans
B) Conventional Home Purchase Loans
C) Refinancings
D) Home Improvement Loans
F) Non-occupant Loans on < 5 Family Dwellings (A B C & D)
Number
Average Value
Number
Average Value
Number
Average Value
Number
Average Value
Number
Average Value
LOANS ORIGINATED
184
$71,287
557
$57,463
1,232
$58,438
224
$16,466
329
$52,055
APPLICATIONS APPROVED, NOT ACCEPTED
11
$58,627
76
$56,863
363
$58,607
62
$17,699
69
$49,251
APPLICATIONS DENIED
33
$65,866
225
$59,118
1,158
$59,097
309
$12,494
185
$48,111
APPLICATIONS WITHDRAWN
18
$66,367
86
$63,130
592
$61,312
23
$25,838
67
$57,459
FILES CLOSED FOR INCOMPLETENESS
7
$70,331
27
$63,842
126
$66,377
5
$42,836
15
$46,951
Aggregated Statistics For Year 2001 (Based on 12 full and 16 partial tracts)
A) FHA, FSA/RHS & VA Home Purchase Loans
B) Conventional Home Purchase Loans
C) Refinancings
D) Home Improvement Loans
E) Loans on Dwellings For 5+ Families
F) Non-occupant Loans on < 5 Family Dwellings (A B C & D)
Number
Average Value
Number
Average Value
Number
Average Value
Number
Average Value
Number
Average Value
Number
Average Value
LOANS ORIGINATED
265
$69,158
395
$59,159
1,328
$55,553
198
$14,304
2
$367,915
243
$49,841
APPLICATIONS APPROVED, NOT ACCEPTED
15
$61,417
77
$55,846
379
$54,446
95
$16,420
0
$0
72
$47,304
APPLICATIONS DENIED
35
$67,748
209
$55,292
1,162
$52,376
469
$13,641
0
$0
163
$46,077
APPLICATIONS WITHDRAWN
26
$62,203
86
$58,820
605
$54,796
43
$36,987
4
$48,338
51
$52,903
FILES CLOSED FOR INCOMPLETENESS
2
$72,695
25
$55,802
153
$61,059
12
$21,428
0
$0
18
$45,129
Aggregated Statistics For Year 2000 (Based on 12 full and 16 partial tracts)
A) FHA, FSA/RHS & VA Home Purchase Loans
B) Conventional Home Purchase Loans
C) Refinancings
D) Home Improvement Loans
E) Loans on Dwellings For 5+ Families
F) Non-occupant Loans on < 5 Family Dwellings (A B C & D)
Number
Average Value
Number
Average Value
Number
Average Value
Number
Average Value
Number
Average Value
Number
Average Value
LOANS ORIGINATED
230
$68,384
575
$55,568
774
$45,931
270
$12,003
2
$67,450
220
$39,817
APPLICATIONS APPROVED, NOT ACCEPTED
13
$56,605
87
$59,488
292
$45,722
118
$17,397
0
$0
56
$46,531
APPLICATIONS DENIED
36
$68,207
276
$52,261
838
$46,134
517
$14,641
0
$0
152
$41,217
APPLICATIONS WITHDRAWN
17
$79,871
106
$54,583
461
$44,131
38
$29,052
2
$30,865
53
$35,383
FILES CLOSED FOR INCOMPLETENESS
3
$47,207
21
$44,734
103
$46,347
5
$20,314
0
$0
10
$39,163
Aggregated Statistics For Year 1999 (Based on 9 full and 8 partial tracts)
A) FHA, FSA/RHS & VA Home Purchase Loans
B) Conventional Home Purchase Loans
C) Refinancings
D) Home Improvement Loans
E) Loans on Dwellings For 5+ Families
F) Non-occupant Loans on < 5 Family Dwellings (A B C & D)
2002 - 2018 National Fire Incident Reporting System (NFIRS) incidents
Based on the data from the years 2002 - 2018 the average number of fires per year is 197. The highest number of fires - 457 took place in 2018, and the least - 47 in 2008. The data has an increasing trend.
When looking into fire subcategories, the most reports belonged to: Structure Fires (61.6%), and Outside Fires (20.1%).
Fire incident types reported to NFIRS in Zip Code 48212


 Nearest zip codes: 48234, 48211, 48202, 48203, 48091, 48206.


 Based on the data from the years 2002 - 2018 the average number of fires per year is 197. The highest number of fires - 457 took place in 2018, and the least - 47 in 2008. The data has an increasing trend.
 When looking into fire subcategories, the most reports belonged to: Structure Fires (61.6%), and Outside Fires (20.1%).