Estimated zip code population in 2022: 20,535 Zip code population in 2010: 28,409 Zip code population in 2000: 45,260
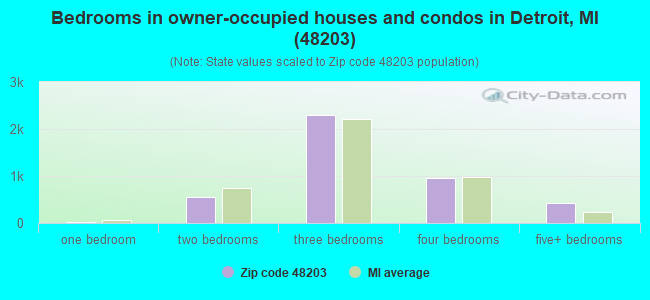
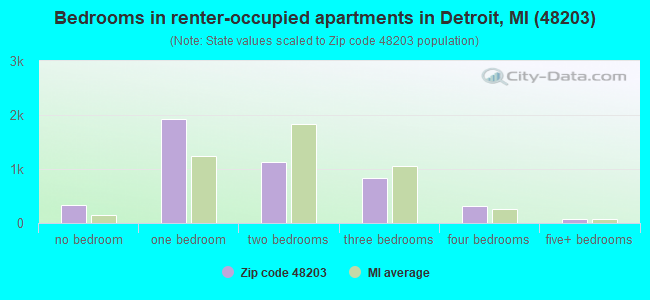
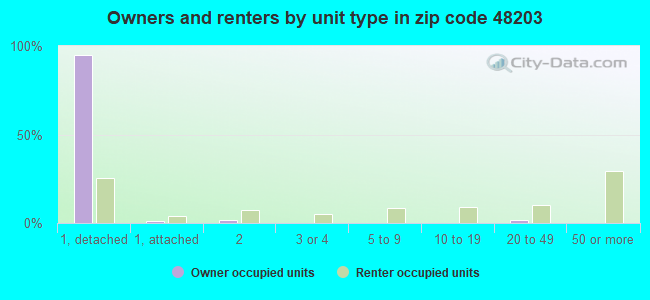
Houses and condos: 14,110 Renter-occupied apartments: 4,621
% of renters here:
52%
State:
27%
March 2022 cost of living index in zip code 48203: 93.2 (less than average, U.S. average is 100)
Land area: 8.0 sq. mi. Water area: 0.0 sq. mi.
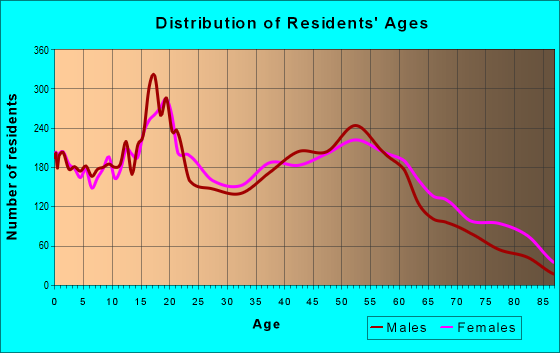
Population density: 2,562 people per square mile
(average).
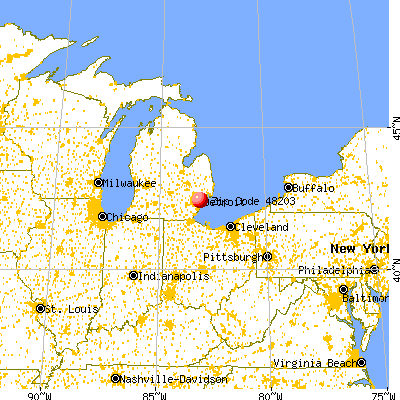
OSM Map
General Map
Google Map
MSN Map
OSM Map
General Map
Google Map
MSN Map
OSM Map
General Map
Google Map
MSN Map
OSM Map
General Map
Google Map
MSN Map
Please wait while loading the map...
Real estate property taxes paid for housing units in 2022:
This zip code:
1.9% ($1,318)
Michigan:
1.2% ($2,746)
Median real estate property taxes paid for housing units with mortgages in 2022: $1,479 (1.3%) Median real estate property taxes paid for housing units with no mortgage in 2022: $1,267 (2.1%)
Averages for the 2020 tax year for zip code 48203, filed in 2021:
Average Adjusted Gross Income (AGI) in 2020: $36,571 (Individual Income Tax Returns)
Here:
$36,571
State:
$68,945
Salary/wage: $31,196 (reported on 73.8% of returns)
Here:
$31,196
State:
$57,142
(% of AGI for various income ranges: 932.6% for AGIs below $25k, 3075.5% for AGIs $25k-50k, 7180.8% for AGIs $50k-75k, 10885.7% for AGIs $75k-100k, 19913.3% for AGIs $100k-200k, 99550.0% for AGIs over 200k)
Taxable interest for individuals: $603 (reported on 10.6% of returns)
This zip code:
$603
Michigan:
$1,630
(% of AGI for various income ranges: 1.8% for AGIs below $25k, 7.9% for AGIs $25k-50k, 9.7% for AGIs $50k-75k, 27.9% for AGIs $75k-100k, 56.7% for AGIs $100k-200k, 550.0% for AGIs over 200k)
Ordinary dividends: $5,862 (reported on 4.8% of returns)
Here:
$5,862
State:
$6,972
(% of AGI for various income ranges: 3.1% for AGIs below $25k, 10.3% for AGIs $25k-50k, 29.7% for AGIs $50k-75k, 18.6% for AGIs $75k-100k, 160.0% for AGIs $100k-200k, 5513.3% for AGIs over 200k)
Net capital gain/loss in AGI: +$11,416 (reported on 4.0% of returns)
Here:
+$11,416
State:
+$20,064
(% of AGI for various income ranges: 2.2% for AGIs below $25k, 2.6% for AGIs $25k-50k, 21.3% for AGIs $50k-75k, 59.3% for AGIs $75k-100k, 466.7% for AGIs $100k-200k, 9350.0% for AGIs over 200k)
Profit/loss from business: +$2,186 (reported on 23.3% of returns)
Here:
+$2,186
State:
+$11,172
(% of AGI for various income ranges: 35.0% for AGIs below $25k, 51.8% for AGIs $50k-75k, 69.3% for AGIs $75k-100k, 985.8% for AGIs $100k-200k, 6383.3% for AGIs over 200k)
Taxable individual retirement arrangement distribution: $19,748 (reported on 3.1% of returns)
48203:
$19,748
Michigan:
$19,803
(% of AGI for various income ranges: 9.0% for AGIs below $25k, 36.1% for AGIs $25k-50k, 255.0% for AGIs $50k-75k, 1053.3% for AGIs $100k-200k, 5696.7% for AGIs over 200k)
Total itemized deductions: $30,555 (reported on 4.9% of returns)
Here:
$30,555
State:
$34,117
(% of AGI for various income ranges: 12.7% for AGIs below $25k, 69.2% for AGIs $25k-50k, 420.0% for AGIs $50k-75k, 1029.3% for AGIs $75k-100k, 2352.5% for AGIs $100k-200k, 15366.7% for AGIs over 200k)
Charity contributions: $12,682 (reported on 4.1% of returns)
Here:
$12,682
State:
$13,548
(% of AGI for various income ranges: 24.7% for AGIs $25k-50k, 138.4% for AGIs $50k-75k, 304.3% for AGIs $75k-100k, 885.0% for AGIs $100k-200k, 5663.3% for AGIs over 200k)
Taxes paid: $7,159 (reported on 4.8% of returns)
48203:
$7,159
State:
$7,972
(% of AGI for various income ranges: 2.5% for AGIs below $25k, 14.6% for AGIs $25k-50k, 103.4% for AGIs $50k-75k, 294.3% for AGIs $75k-100k, 721.7% for AGIs $100k-200k, 2526.7% for AGIs over 200k)
Earned income credit: $2,642 (reported on 38.1% of returns)
Here:
$2,642
State:
$2,251
(% of AGI for various income ranges: 170.0% for AGIs below $25k, 126.6% for AGIs $25k-50k)
Percentage of individuals using paid preparers for their 2020 taxes: 90.4%
Here:
90%
State:
93%
(% for various income ranges: 90.9% for AGIs below $25k, 91.7% for AGIs $25k-50k, 85.5% for AGIs $50k-75k, 88.5% for AGIs $75k-100k, 85.2% for AGIs $100k-200k, 84.6% for AGIs over 200k)
Averages for the 2012 tax year for zip code 48203, filed in 2013:
Average Adjusted Gross Income (AGI) in 2012: $27,554 (Individual Income Tax Returns)
Here:
$27,554
State:
$55,609
Salary/wage: $24,029 (reported on 77.2% of returns)
Here:
$24,029
State:
$46,782
(% of AGI for various income ranges: 66.3% for AGIs below $25k, 75.4% for AGIs $25k-50k, 69.6% for AGIs $50k-75k, 71.9% for AGIs $75k-100k, 61.8% for AGIs $100k-200k, 55.6% for AGIs over 200k)
Taxable interest for individuals: $829 (reported on 11.5% of returns)
This zip code:
$829
Michigan:
$1,491
(% of AGI for various income ranges: 0.4% for AGIs below $25k, 0.3% for AGIs $25k-50k, 0.2% for AGIs $50k-75k, 0.3% for AGIs $100k-200k, 0.4% for AGIs over 200k)
Ordinary dividends: $3,079 (reported on 4.2% of returns)
Here:
$3,079
State:
$6,225
(% of AGI for various income ranges: 0.1% for AGIs below $25k, 0.2% for AGIs $25k-50k, 0.3% for AGIs $50k-75k, 0.2% for AGIs $75k-100k, 1.4% for AGIs $100k-200k, 1.1% for AGIs over 200k)
Net capital gain/loss in AGI: +$1,250 (reported on 2.6% of returns)
Here:
+$1,250
State:
+$9,326
(% of AGI for various income ranges: 0.1% for AGIs $100k-200k, 0.8% for AGIs over 200k)
Profit/loss from business: +$8,761 (reported on 24.1% of returns)
Here:
+$8,761
State:
+$11,523
(% of AGI for various income ranges: 17.9% for AGIs below $25k, 0.1% for AGIs $25k-50k, 0.5% for AGIs $50k-75k, 0.6% for AGIs $75k-100k, 2.5% for AGIs $100k-200k, 12.7% for AGIs over 200k)
Taxable individual retirement arrangement distribution: $12,666 (reported on 3.9% of returns)
48203:
$12,666
Michigan:
$15,298
(% of AGI for various income ranges: 0.5% for AGIs below $25k, 1.1% for AGIs $25k-50k, 2.3% for AGIs $50k-75k, 2.9% for AGIs $75k-100k, 7.3% for AGIs $100k-200k)
Total itemized deductions: $21,123 (24% of AGI, reported on 12.6% of returns)
Here:
$21,123
State:
$21,628
Here:
23.7% of AGI
State:
18.4% of AGI
(% of AGI for various income ranges: 2.5% for AGIs below $25k, 8.0% for AGIs $25k-50k, 12.8% for AGIs $50k-75k, 13.6% for AGIs $75k-100k, 18.0% for AGIs $100k-200k, 16.1% for AGIs over 200k)
Charity contributions: $5,748 (reported on 11.3% of returns)
Here:
$5,748
State:
$4,225
(% of AGI for various income ranges: 0.5% for AGIs below $25k, 2.0% for AGIs $25k-50k, 3.5% for AGIs $50k-75k, 3.0% for AGIs $75k-100k, 4.3% for AGIs $100k-200k, 4.0% for AGIs over 200k)
Taxes paid: $8,137 (reported on 12.5% of returns)
48203:
$8,137
State:
$8,327
(% of AGI for various income ranges: 0.5% for AGIs below $25k, 2.4% for AGIs $25k-50k, 4.3% for AGIs $50k-75k, 5.5% for AGIs $75k-100k, 7.4% for AGIs $100k-200k, 8.0% for AGIs over 200k)
Earned income credit: $2,874 (reported on 46.1% of returns)
Here:
$2,874
State:
$2,306
(% of AGI for various income ranges: 14.8% for AGIs below $25k, 1.5% for AGIs $25k-50k)
Percentage of individuals using paid preparers for their 2012 taxes: 55.8%
Here:
56%
State:
57%
(% for various income ranges: 55.6% for AGIs below $25k, 51.4% for AGIs $25k-50k, 61.1% for AGIs $50k-75k, 61.9% for AGIs $75k-100k, 66.7% for AGIs $100k-200k, 87.5% for AGIs over 200k)
Averages for the 2004 tax year for zip code 48203, filed in 2005:
Average Adjusted Gross Income (AGI) in 2004: $26,357 (Individual Income Tax Returns)
Here:
$26,357
State:
$48,204
Salary/wage: $24,011 (reported on 86.9% of returns)
Here:
$24,011
State:
$42,791
(% of AGI for various income ranges: 81.5% for AGIs below $10k, 79.3% for AGIs $10k-25k, 86.1% for AGIs $25k-50k, 82.5% for AGIs $50k-75k, 78.3% for AGIs $75k-100k, 65.1% for AGIs over 100k)
Taxable interest for individuals: $913 (reported on 16.9% of returns)
This zip code:
$913
Michigan:
$1,725
(% of AGI for various income ranges: 0.7% for AGIs below $10k, 0.4% for AGIs $10k-25k, 0.3% for AGIs $25k-50k, 0.7% for AGIs $50k-75k, 0.6% for AGIs $75k-100k, 1.1% for AGIs over 100k)
Taxable dividends: $1,458 (reported on 6.4% of returns)
Here:
$1,458
State:
$3,420
(% of AGI for various income ranges: 0.3% for AGIs below $10k, 0.2% for AGIs $10k-25k, 0.2% for AGIs $25k-50k, 0.3% for AGIs $50k-75k, 0.5% for AGIs $75k-100k, 0.8% for AGIs over 100k)
Net capital gain/loss: +$3,540 (reported on 3.5% of returns)
Here:
+$3,540
State:
+$8,532
(% of AGI for various income ranges: -0.2% for AGIs below $10k, 0.1% for AGIs $10k-25k, -0.0% for AGIs $25k-50k, 0.8% for AGIs $50k-75k, 0.2% for AGIs $75k-100k, 1.7% for AGIs over 100k)
Profit/loss from business: +$5,990 (reported on 12.5% of returns)
Here:
+$5,990
State:
+$9,547
(% of AGI for various income ranges: 12.2% for AGIs below $10k, 5.2% for AGIs $10k-25k, -0.6% for AGIs $25k-50k, -0.1% for AGIs $50k-75k, -0.2% for AGIs $75k-100k, 6.4% for AGIs over 100k)
IRA payment deduction: $1,885 (reported on 0.8% of returns)
48203:
$1,885
Michigan:
$2,875
Self-employed pension: $24,529 (reported on 0.1% of returns)
Here:
$24,529
Michigan:
$13,826
Total itemized deductions: $17,077 (27% of AGI, reported on 18.7% of returns)
Here:
$17,077
State:
$18,509
Here:
26.7% of AGI
State:
20.7% of AGI
(% of AGI for various income ranges: 4.4% for AGIs below $10k, 4.8% for AGIs $10k-25k, 11.5% for AGIs $25k-50k, 15.4% for AGIs $50k-75k, 18.9% for AGIs $75k-100k, 18.7% for AGIs over 100k)
Charity contributions deductions: $4,840 (7% of AGI, reported on 17.0% of returns)
Here:
$4,840
State:
$3,365
Here:
7.3% of AGI
State:
3.6% of AGI
(% of AGI for various income ranges: 0.4% for AGIs below $10k, 1.0% for AGIs $10k-25k, 3.2% for AGIs $25k-50k, 4.4% for AGIs $50k-75k, 4.8% for AGIs $75k-100k, 4.7% for AGIs over 100k)
Total tax: $4,135 (reported on 53.9% of returns)
48203:
$4,135
State:
$7,691
(% of AGI for various income ranges: 2.5% for AGIs below $10k, 2.7% for AGIs $10k-25k, 5.5% for AGIs $25k-50k, 10.0% for AGIs $50k-75k, 11.4% for AGIs $75k-100k, 19.4% for AGIs over 100k)
Earned income credit: $2,172 (reported on 45.8% of returns)
Here:
$2,172
State:
$1,737
Percentage of individuals using paid preparers for their 2004 taxes: 67.7%
Here:
68%
State:
60%
(% for various income ranges: 68.3% for AGIs below $10k, 71.7% for AGIs $10k-25k, 62.0% for AGIs $25k-50k, 63.2% for AGIs $50k-75k, 60.0% for AGIs $75k-100k, 73.4% for AGIs over 100k)
Household received Food Stamps/SNAP in the past 12 months: 3,835 Household did not receive Food Stamps/SNAP in the past 12 months: 5,315
Women who had a birth in the past 12 months: 166 (26 now married, 133 unmarried) Women who did not have a birth in the past 12 months: 4,109 (883 now married, 3,242 unmarried)
Housing units in zip code 48203 with a mortgage: 1,362 (120 second mortgage, 74 both second mortgage and home equity loan) Houses without a mortgage: 60
Median monthly owner costs for units with a mortgage: $1,241 Median monthly owner costs for units without a mortgage: $515
Residents with income below the poverty level in 2022:
This zip code:
35.7%
Whole state:
13.4%
Residents with income below 50% of the poverty level in 2022:
This zip code:
18.9%
Whole state:
6.9%
Median number of rooms in houses and condos:
Here:
6.6
State:
6.5
Median number of rooms in apartments:
Here:
4.1
State:
4.3
Notable locations in this zip code not listed on our city pages
Notable locations in zip code 48203: Detroit Golf Club (A), Michigan State Fairground (B), City of Detroit Fire Department Emergency Medical Services Medic 18 (C), Hart Emergency Medical Services (D), City of Detroit Fire Department Engine 44 Ladder 18 (E), Highland Park Civic Center (F), Abraham Lincoln Library (G), Precinct 12 Police Station (H), Highland Park Fire Department (I). Display/hide their locations on the map
Churches in zip code 48203 include: Christian Unity Missionary Baptist Church (A), Davison Missionary Baptist Church (B), Mountain View Missionary Baptist Church (C), New Creation Church of God in Christ (D), New Grace Missionary Baptist Church (E), New Truth Missionary Baptist Church (F), Old Solid Rock Missionary Baptist Church (G), Original New Grace Baptist Church (H), Park United Presbyterian Church (I). Display/hide their locations on the map
Parks in zip code 48203 include: Coventry Park (1), Ford Park (2), Birthplace of Model T Historical Marker (3), Bishop's Residence Historical Marker (4), Dakota Inn Rathskeller Historical Marker (5), First Mile of Concrete Highway Historical Marker (6), Highland Park Plant Historical Marker (7), The Michigan Stove Historical Marker (8), Seabiscuit Historical Marker (9). Display/hide their locations on the map
787 married couples with children.
2,223 single-parent households (170 men, 2,053 women).
94.2% of residents of 48203 zip code speak English at home.
2.8% of residents speak Spanish at home (83% very well, 6% well, 5% not well, 6% not at all).
1.3% of residents speak other Indo-European language at home (83% very well, 16% well).
0.7% of residents speak Asian or Pacific Island language at home (65% very well, 14% well, 20% not well).
1.0% of residents speak other language at home (66% very well, 1% well, 13% not well, 21% not at all).
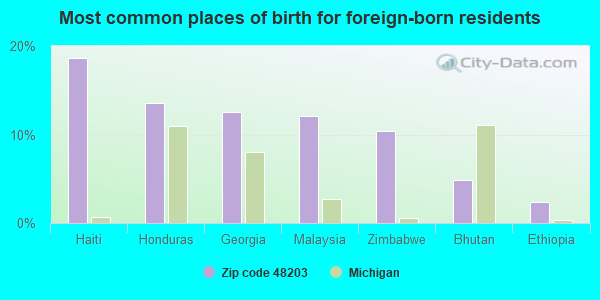
Foreign born population: 472 (2.3%) (60.1% of them are naturalized citizens)
This zip code:
2.3%
Whole state:
6.9%
19%Haiti
14%Honduras
12%Georgia
12%Malaysia
10%Zimbabwe
5%Bhutan
2%Ethiopia
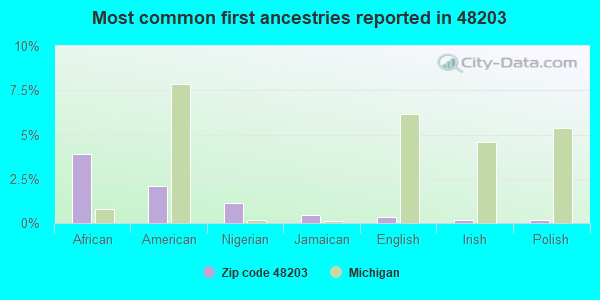
4%African
2%American
1%Nigerian
0%Jamaican
0%English
0%Irish
0%Polish
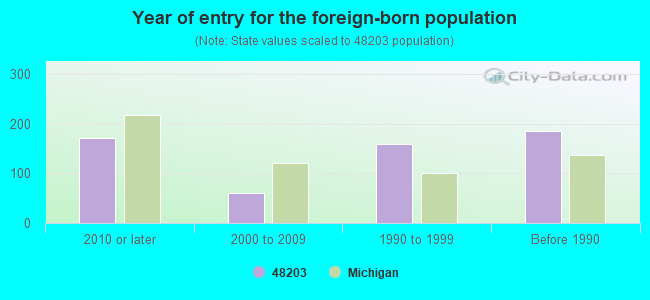
Year of entry for the foreign-born population
1722010 or later
612000 to 2009
1601990 to 1999
185Before 1990
Major facilities with environmental interests located in this zip code:
CHROME CRAFT CORPORATION (318 MIDLAND in HIGHLAND PARK, MI)
AIR MINOR (AIRS/AFS) (Integrated Compliance Information System) - ICIS-05-1996-0015, FORMAL ENFORCEMENT ACTION CRITERIA AND HAZARDOUS AIR POLLUTANT INVENTORY (Inventory of air pollution sources) HAZARDOUS WASTE BIENNIAL REPORTER (Resource Conservation and Recovery Act (tracking hazardous waste)) - ICIS-, ENFORCEMENT/COMPLIANCE ACTIVITY Large Quantity Generators, more that 1000 kg of hazardous waste/month (Resource Conservation and Recovery Act (tracking hazardous waste)) - ICIS-, ENFORCEMENT/COMPLIANCE ACTIVITY TRI REPORTER (Tracking of toxic chemicals releasing facilities) Business SIC and NAICS classification: ELECTROPLATING, PLATING, POLISHING, ANODIZING, AND COLORING Organizations: FLEX-N-GATE (CONTACT/OWNER)
Alternative names: CHROME CRAFT CORP.
ABC DRUM & BARREL - LANTZ STREET (102 WEST LANTZ STREET in DETROIT, MI)
SUPERFUND (Superfund database) (Integrated Compliance Information System) - ICIS-05-1992-0262, FORMAL ENFORCEMENT ACTION (Resource Conservation and Recovery Act (tracking hazardous waste)) TARGETED BROWNFIELDS ASSESSMENT (TBA) Organizations: ABC BARREL & DRUM CO INC (CONTACT/OPERATOR)
Alternative names: ABC BARREL & DRUM CO INC, ABC DRUM & BARREL - LANTZ STREET (B), ABC DRUM #2
ALL CHEMICAL CORPORATION (15120 3RD STREET in HIGHLAND PARK, MI)
AIR MINOR (AIRS/AFS) (Integrated Compliance Information System) - ICIS-05-2001-0010, FORMAL ENFORCEMENT ACTION COMPLIANCE ACTIVITY (Tracking inspections of insecticide, fungicide, and rodenticide, and toxic substances) Business SIC classification: SPECIALTY CLEANING, POLISHING, AND SANITATION PREPARATIONS; NONCLASSIFIABLE ESTABLISHMENTS
GREENFIELD PARK ELEMENTARY SCHOOL (17501 BRUSH STREET in DETROIT, MI)
(National Center for Education Statistics) - STATE ID-01495 (Resource Conservation and Recovery Act (tracking hazardous waste)) Organizations: DETROIT PUBLIC SCHOOLS (CONTACT/OWNER)
, DETROIT CITY SCHOOL DISTRICT (SCHOOL DISTRICT)
Alternative names: GREENFIELD PARK ELEM SCHOOL
GRAYLING ELEMENTARY SCHOOL (744 W. ADELINE STREET in DETROIT, MI)
(National Center for Education Statistics) - STATE ID-01480 Conditionally Exempt Small Quantity Generators, less than 100 kg/month of hazardous waste (Resource Conservation and Recovery Act (tracking hazardous waste)) Organizations: DETROIT PUBLIC SCHOOLS (CONTACT/OPERATOR)
, DETROIT CITY SCHOOL DISTRICT (SCHOOL DISTRICT)
Alternative names: GRAYLING ELEM SCHOOL
MI DEPT/TRANSPORTATION BRIDGE (I-75 TO HAMILTON FROM DAVISON in HIGHLAND PARK, MI)
(Resource Conservation and Recovery Act (tracking hazardous waste)) Organizations: MICH DEPT OF TRANSPORTATION (CONTACT/OPERATOR)
Alternative names: MIDOT BRIDGE I-75 TO HAMILTON
BARBER FOCUS SCH OF MATH, SCI, TEC (45 E. BUENA VISTA STREET in HIGHLAND PARK, MI)
(National Center for Education Statistics) - STATE ID-03228 Organizations: HIGHLAND PARK CITY SCHOOLS (SCHOOL DISTRICT)
BLANCHE KELSO BRUCE ACADEMY-CALUMET (330 GLENDALE in HIGHLAND PARK, MI)
(National Center for Education Statistics) - STATE ID-08940
GREENFIELD UNION ELEMENTARY SCHOOL (420 W. 7 MILE ROAD in DETROIT, MI)
(National Center for Education Statistics) - STATE ID-01493 Organizations: DETROIT CITY SCHOOL DISTRICT (SCHOOL DISTRICT)
Housing units lacking complete plumbing facilities: 10.8% Housing units lacking complete kitchen facilities: 12.1%
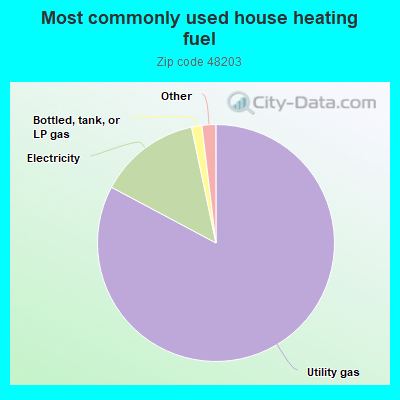
82.8%Utility gas
13.9%Electricity
1.4%Bottled, tank, or LP gas
0.9%Other fuel
0.6%No fuel used
Population in 1990: 53,352.
Place of birth for U.S.-born residents:
This state: 15,426
Northeast: 617
Midwest: 823
South: 2,788
West: 259
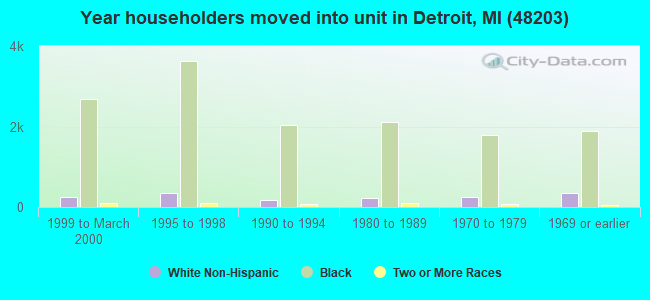
61% of the 48203 zip code residents lived in the same house 5 years ago. Out of people who lived in different houses, 90% lived in this county. Out of people who lived in different counties, 50% lived in Michigan.
92% of the 48203 zip code residents lived in the same house 1 year ago. Out of people who lived in different houses, 82% moved from this county. Out of people who lived in different houses, 12% moved from different county within same state. Out of people who lived in different houses, 3% moved from different state. Out of people who lived in different houses, 2% moved from abroad.
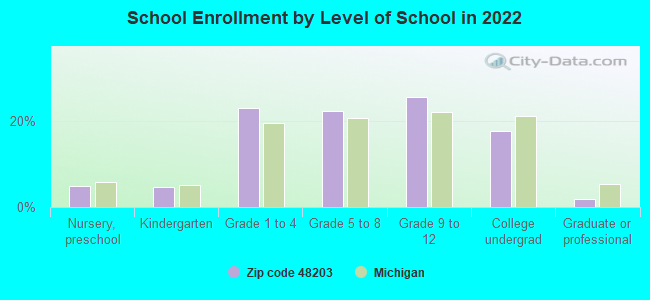
Private vs. public school enrollment:
Students in private schools in grades 1 to 8 (elementary and middle school): 197
Here:
10.8%
Michigan:
12.4%
Students in private schools in grades 9 to 12 (high school): 76
Here:
7.4%
Michigan:
9.8%
Students in private undergraduate colleges: 114
Here:
15.9%
Michigan:
14.9%
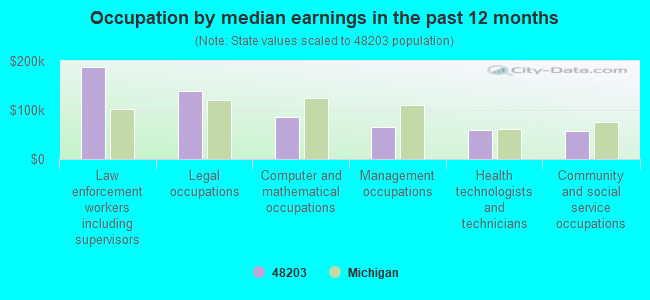
Occupation by median earnings in the past 12 months ($)
186,832Law enforcement workers including supervisors
138,926Legal occupations
84,947Computer and mathematical occupations
65,429Management occupations
58,456Health technologists and technicians
56,586Community and social service occupations
Companies with federal contracts located in this zip code (DETROIT, MI):
JOHN E GREEN CO (220 VICTOR AVE) : $122,792 in 9 contractsfrom 2000 to 2006
Contracts for Maintenance, Repair or Alteration of Real Property -- Miscellaneous Buildings, Construction of Structures and Facilities -- Office Buildings, Maintenance, Repair and Rebuilding of Equipment -- Refrigeration, Air Conditioning, and Air Circulating Equipment by Air Force, Army, Public Buildings Service Signed by year:2000: $35,962; 2001: $0; 2002: $0; 2003: $10,000; 2004: $20,000; 2005: $0; 2006: $56,830.
Biggest contracts:
$56,830 with Air Force for Maintenance, Repair or Alteration of Real Property -- Miscellaneous Buildings. Taking place in TN. Signed on 2006-05-23. Completion date: 2006-10-22.
$17,981 with Army for Construction of Structures and Facilities -- Office Buildings. Taking place in TN. Signed on 2000-10-08. Completion date: 2001-09-22.
$17,981, same as above.Signed on 2000-09-28. Completion date: 2000-09-22.
$12,000 with Public Buildings Service for Maintenance, Repair and Rebuilding of Equipment -- Refrigeration, Air Conditioning, and Air Circulating Equipment. Signed on 2004-07-16. Completion date: 2004-09-30.
INTRASTATE DISTRIBUTORS, INC (20021 EXETER AVENUE; small business) : $36,214 in 6 contractsfrom 2004 to 2006
Contracts for Food Items For Resale, Non-Food Items For Resale by Defense Commissary Agency Signed by year:2000: $0; 2001: $0; 2002: $0; 2003: $0; 2004: $6,089; 2005: $23,360; 2006: $6,765.
Biggest contracts:
$12,782 with Defense Commissary Agency for Food Items For Resale. Signed on 2005-04-01. Completion date: 2005-08-31.
$6,765 with Defense Commissary Agency for Non-Food Items For Resale. Signed on 2006-01-01. Completion date: 2006-03-31.
$6,089 with Defense Commissary Agency for Food Items For Resale. Signed on 2004-10-01. Completion date: 2005-02-28.
$5,308 with Defense Commissary Agency for Non-Food Items For Resale. Signed on 2005-10-01. Completion date: 2005-12-31.
ALEX SALTSMAN & JACK J CARMEN (14020 OAKLAND ST; small business)
$8,301 with Navy for Bars and Rods. Signed on 2005-10-17. Completion date: 2005-11-05.
HELM INCORPORATED (14310 HAMILTON AVE; small business) : $3,700 in 2 contractsin 2005
$4,900 with Navy for Educational Services. Signed on 2005-07-06. Completion date: 2006-07-06.
-$1,200, same as above.Signed on 2005-07-06. Completion date: 2006-07-06.
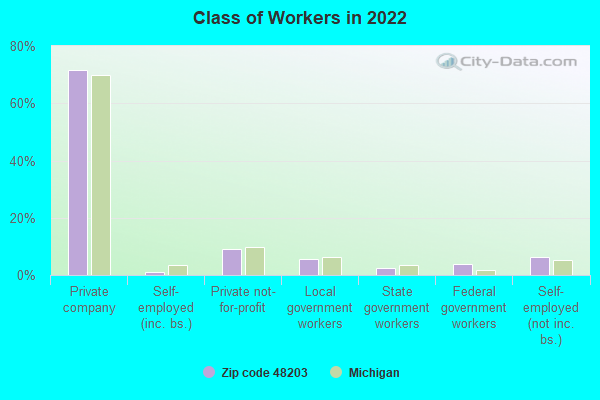
Top industries in this zip code by the number of employees in 2005:
Professional, Scientific, and Technical Services: Direct Mail Advertising (500-999 employees: 1 establishment, 20-49 employees: 2 establishments, 10-19 employees: 1 establishment)
2002 - 2018 National Fire Incident Reporting System (NFIRS) incidents
Based on the data from the years 2002 - 2018 the average number of fire incidents per year is 355. The highest number of fires - 664 took place in 2015, and the least - 8 in 2003. The data has a growing trend.
When looking into fire subcategories, the most incidents belonged to: Structure Fires (72.6%), and Outside Fires (12.9%).
Fire incident types reported to NFIRS in Zip Code 48203


 Nearest zip codes: 48030, 48238, 48221, 48206, 48220, 48212.
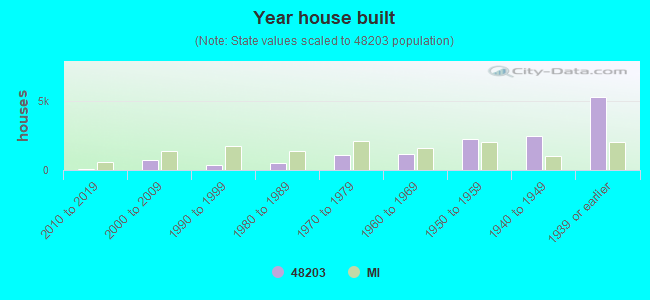


 Based on the data from the years 2002 - 2018 the average number of fire incidents per year is 355. The highest number of fires - 664 took place in 2015, and the least - 8 in 2003. The data has a growing trend.
 When looking into fire subcategories, the most incidents belonged to: Structure Fires (72.6%), and Outside Fires (12.9%).