Estimated zip code population in 2022: 44,489 Zip code population in 2010: 46,931 Zip code population in 2000: 59,447
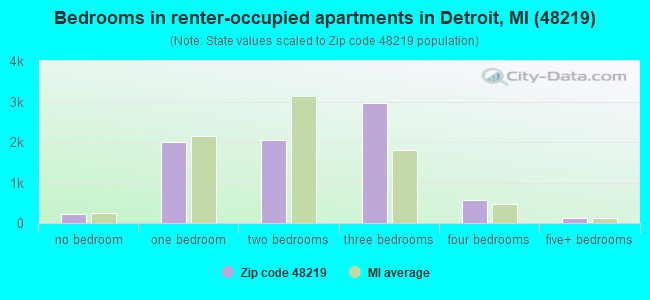
Houses and condos: 20,738 Renter-occupied apartments: 7,976
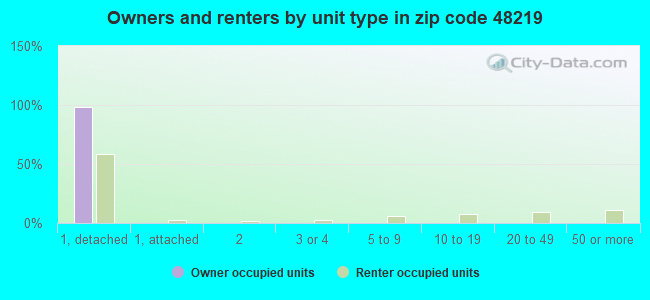
% of renters here:
44%
State:
27%
March 2022 cost of living index in zip code 48219: 94.3 (less than average, U.S. average is 100)
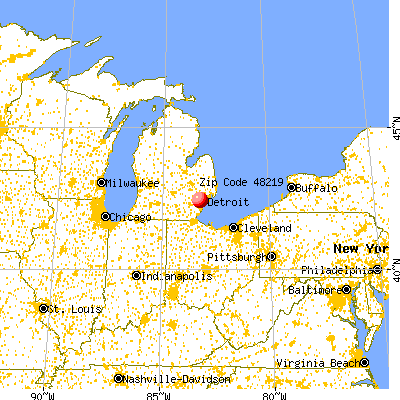
Land area: 8.4 sq. mi. Water area: 0.0 sq. mi.
Population density: 5,292 people per square mile
(average).
OSM Map
General Map
Google Map
MSN Map
OSM Map
General Map
Google Map
MSN Map
OSM Map
General Map
Google Map
MSN Map
OSM Map
General Map
Google Map
MSN Map
Please wait while loading the map...
Real estate property taxes paid for housing units in 2022:
This zip code:
1.8% ($1,482)
Michigan:
1.2% ($2,746)
Median real estate property taxes paid for housing units with mortgages in 2022: $1,537 (1.5%) Median real estate property taxes paid for housing units with no mortgage in 2022: $1,446 (2.0%)
Averages for the 2020 tax year for zip code 48219, filed in 2021:
Average Adjusted Gross Income (AGI) in 2020: $33,037 (Individual Income Tax Returns)
Here:
$33,037
State:
$68,945
Salary/wage: $29,650 (reported on 74.7% of returns)
Here:
$29,650
State:
$57,142
(% of AGI for various income ranges: 948.9% for AGIs below $25k, 3132.3% for AGIs $25k-50k, 6944.9% for AGIs $50k-75k, 10423.6% for AGIs $75k-100k, 17402.2% for AGIs $100k-200k)
Taxable interest for individuals: $391 (reported on 10.0% of returns)
This zip code:
$391
Michigan:
$1,630
(% of AGI for various income ranges: 1.5% for AGIs below $25k, 3.7% for AGIs $25k-50k, 12.1% for AGIs $50k-75k, 35.8% for AGIs $75k-100k, 41.9% for AGIs $100k-200k)
Ordinary dividends: $1,270 (reported on 4.2% of returns)
Here:
$1,270
State:
$6,972
(% of AGI for various income ranges: 1.6% for AGIs below $25k, 2.8% for AGIs $25k-50k, 17.4% for AGIs $50k-75k, 36.9% for AGIs $75k-100k, 116.6% for AGIs $100k-200k)
Net capital gain/loss in AGI: +$3,473 (reported on 3.2% of returns)
Here:
+$3,473
State:
+$20,064
(% of AGI for various income ranges: 1.8% for AGIs below $25k, 6.0% for AGIs $25k-50k, 33.3% for AGIs $50k-75k, 62.2% for AGIs $75k-100k, 318.8% for AGIs $100k-200k)
Taxable individual retirement arrangement distribution: $12,904 (reported on 4.2% of returns)
48219:
$12,904
Michigan:
$19,803
(% of AGI for various income ranges: 15.1% for AGIs below $25k, 41.3% for AGIs $25k-50k, 144.6% for AGIs $50k-75k, 386.0% for AGIs $75k-100k, 1164.4% for AGIs $100k-200k)
Total itemized deductions: $24,702 (reported on 4.5% of returns)
Here:
$24,702
State:
$34,117
(% of AGI for various income ranges: 22.8% for AGIs below $25k, 105.3% for AGIs $25k-50k, 352.5% for AGIs $50k-75k, 904.2% for AGIs $75k-100k, 1415.3% for AGIs $100k-200k)
Charity contributions: $11,023 (reported on 3.9% of returns)
Here:
$11,023
State:
$13,548
(% of AGI for various income ranges: 4.4% for AGIs below $25k, 34.2% for AGIs $25k-50k, 146.7% for AGIs $50k-75k, 371.3% for AGIs $75k-100k, 646.2% for AGIs $100k-200k)
Taxes paid: $6,258 (reported on 4.4% of returns)
48219:
$6,258
State:
$7,972
(% of AGI for various income ranges: 3.9% for AGIs below $25k, 24.8% for AGIs $25k-50k, 89.2% for AGIs $50k-75k, 241.8% for AGIs $75k-100k, 432.2% for AGIs $100k-200k)
Earned income credit: $2,716 (reported on 34.8% of returns)
Here:
$2,716
State:
$2,251
(% of AGI for various income ranges: 158.5% for AGIs below $25k, 130.2% for AGIs $25k-50k, 0.8% for AGIs $50k-75k)
Percentage of individuals using paid preparers for their 2020 taxes: 89.6%
Here:
90%
State:
93%
(% for various income ranges: 90.4% for AGIs below $25k, 91.0% for AGIs $25k-50k, 85.4% for AGIs $50k-75k, 81.5% for AGIs $75k-100k, 88.2% for AGIs $100k-200k, 80.0% for AGIs over 200k)
Averages for the 2012 tax year for zip code 48219, filed in 2013:
Average Adjusted Gross Income (AGI) in 2012: $29,175 (Individual Income Tax Returns)
Here:
$29,175
State:
$55,609
Salary/wage: $25,562 (reported on 79.8% of returns)
Here:
$25,562
State:
$46,782
(% of AGI for various income ranges: 68.0% for AGIs below $25k, 74.1% for AGIs $25k-50k, 70.5% for AGIs $50k-75k, 69.6% for AGIs $75k-100k, 66.7% for AGIs $100k-200k, 53.3% for AGIs over 200k)
Taxable interest for individuals: $648 (reported on 13.5% of returns)
This zip code:
$648
Michigan:
$1,491
(% of AGI for various income ranges: 0.4% for AGIs below $25k, 0.3% for AGIs $25k-50k, 0.2% for AGIs $50k-75k, 0.2% for AGIs $75k-100k, 0.4% for AGIs $100k-200k)
Ordinary dividends: $1,699 (reported on 5.1% of returns)
Here:
$1,699
State:
$6,225
(% of AGI for various income ranges: 0.2% for AGIs below $25k, 0.2% for AGIs $25k-50k, 0.5% for AGIs $50k-75k, 0.2% for AGIs $75k-100k, 0.5% for AGIs $100k-200k)
Net capital gain/loss in AGI: +$546 (reported on 2.6% of returns)
Here:
+$546
State:
+$9,326
(% of AGI for various income ranges: 0.3% for AGIs $100k-200k)
Profit/loss from business: +$5,274 (reported on 20.6% of returns)
Here:
+$5,274
State:
+$11,523
(% of AGI for various income ranges: 14.2% for AGIs below $25k, 0.2% for AGIs $75k-100k, 0.6% for AGIs $100k-200k)
Taxable individual retirement arrangement distribution: $13,541 (reported on 5.1% of returns)
48219:
$13,541
Michigan:
$15,298
(% of AGI for various income ranges: 0.9% for AGIs below $25k, 1.4% for AGIs $25k-50k, 2.5% for AGIs $50k-75k, 3.3% for AGIs $75k-100k, 6.5% for AGIs $100k-200k)
Total itemized deductions: $15,956 (26% of AGI, reported on 21.3% of returns)
Here:
$15,956
State:
$21,628
Here:
26.4% of AGI
State:
18.4% of AGI
(% of AGI for various income ranges: 5.0% for AGIs below $25k, 11.0% for AGIs $25k-50k, 16.2% for AGIs $50k-75k, 15.7% for AGIs $75k-100k, 15.0% for AGIs $100k-200k, 16.5% for AGIs over 200k)
Charity contributions: $4,607 (reported on 18.3% of returns)
Here:
$4,607
State:
$4,225
(% of AGI for various income ranges: 0.8% for AGIs below $25k, 2.7% for AGIs $25k-50k, 4.0% for AGIs $50k-75k, 4.1% for AGIs $75k-100k, 4.2% for AGIs $100k-200k, 5.7% for AGIs over 200k)
Taxes paid: $5,783 (reported on 21.1% of returns)
48219:
$5,783
State:
$8,327
(% of AGI for various income ranges: 1.4% for AGIs below $25k, 3.5% for AGIs $25k-50k, 5.7% for AGIs $50k-75k, 6.2% for AGIs $75k-100k, 6.6% for AGIs $100k-200k, 6.9% for AGIs over 200k)
Earned income credit: $2,837 (reported on 40.1% of returns)
Here:
$2,837
State:
$2,306
(% of AGI for various income ranges: 13.4% for AGIs below $25k, 1.4% for AGIs $25k-50k)
Percentage of individuals using paid preparers for their 2012 taxes: 55.4%
Here:
55%
State:
57%
(% for various income ranges: 54.5% for AGIs below $25k, 55.5% for AGIs $25k-50k, 56.8% for AGIs $50k-75k, 59.3% for AGIs $75k-100k, 61.3% for AGIs $100k-200k, 75.0% for AGIs over 200k)
Averages for the 2004 tax year for zip code 48219, filed in 2005:
Average Adjusted Gross Income (AGI) in 2004: $33,498 (Individual Income Tax Returns)
Here:
$33,498
State:
$48,204
Salary/wage: $31,676 (reported on 88.5% of returns)
Here:
$31,676
State:
$42,791
(% of AGI for various income ranges: 79.7% for AGIs below $10k, 78.9% for AGIs $10k-25k, 84.9% for AGIs $25k-50k, 87.2% for AGIs $50k-75k, 85.5% for AGIs $75k-100k, 79.6% for AGIs over 100k)
Taxable interest for individuals: $594 (reported on 23.9% of returns)
This zip code:
$594
Michigan:
$1,725
(% of AGI for various income ranges: 1.2% for AGIs below $10k, 0.5% for AGIs $10k-25k, 0.4% for AGIs $25k-50k, 0.3% for AGIs $50k-75k, 0.4% for AGIs $75k-100k, 0.5% for AGIs over 100k)
Taxable dividends: $901 (reported on 9.4% of returns)
Here:
$901
State:
$3,420
(% of AGI for various income ranges: 0.6% for AGIs below $10k, 0.2% for AGIs $10k-25k, 0.2% for AGIs $25k-50k, 0.2% for AGIs $50k-75k, 0.2% for AGIs $75k-100k, 0.5% for AGIs over 100k)
Net capital gain/loss: +$3,746 (reported on 4.8% of returns)
Here:
+$3,746
State:
+$8,532
(% of AGI for various income ranges: -0.2% for AGIs below $10k, 0.1% for AGIs $10k-25k, 0.1% for AGIs $25k-50k, 0.2% for AGIs $50k-75k, 0.5% for AGIs $75k-100k, 2.6% for AGIs over 100k)
Profit/loss from business: +$2,640 (reported on 11.0% of returns)
Here:
+$2,640
State:
+$9,547
(% of AGI for various income ranges: 8.9% for AGIs below $10k, 3.2% for AGIs $10k-25k, 0.5% for AGIs $25k-50k, -0.3% for AGIs $50k-75k, -0.2% for AGIs $75k-100k, 0.5% for AGIs over 100k)
IRA payment deduction: $1,952 (reported on 0.9% of returns)
48219:
$1,952
Michigan:
$2,875
(% of AGI for various income ranges: 0.1% for AGIs below $10k, 0.1% for AGIs $10k-25k, 0.1% for AGIs $25k-50k, 0.0% for AGIs $50k-75k, 0.0% for AGIs $75k-100k, 0.0% for AGIs over 100k)
Self-employed pension: $11,000 (reported on 0.0% of returns)
Here:
$11,000
Michigan:
$13,826
Total itemized deductions: $15,700 (28% of AGI, reported on 38.6% of returns)
Here:
$15,700
State:
$18,509
Here:
28.2% of AGI
State:
20.7% of AGI
(% of AGI for various income ranges: 10.3% for AGIs below $10k, 11.3% for AGIs $10k-25k, 18.7% for AGIs $25k-50k, 21.1% for AGIs $50k-75k, 20.5% for AGIs $75k-100k, 18.1% for AGIs over 100k)
Charity contributions deductions: $3,880 (7% of AGI, reported on 35.3% of returns)
Here:
$3,880
State:
$3,365
Here:
6.8% of AGI
State:
3.6% of AGI
(% of AGI for various income ranges: 1.1% for AGIs below $10k, 1.9% for AGIs $10k-25k, 3.9% for AGIs $25k-50k, 4.9% for AGIs $50k-75k, 5.0% for AGIs $75k-100k, 5.0% for AGIs over 100k)
Total tax: $4,109 (reported on 64.7% of returns)
48219:
$4,109
State:
$7,691
(% of AGI for various income ranges: 2.4% for AGIs below $10k, 2.8% for AGIs $10k-25k, 5.6% for AGIs $25k-50k, 8.9% for AGIs $50k-75k, 10.6% for AGIs $75k-100k, 14.4% for AGIs over 100k)
Earned income credit: $1,972 (reported on 29.9% of returns)
Here:
$1,972
State:
$1,737
Percentage of individuals using paid preparers for their 2004 taxes: 63.3%
Here:
63%
State:
60%
(% for various income ranges: 60.2% for AGIs below $10k, 67.6% for AGIs $10k-25k, 61.8% for AGIs $25k-50k, 61.7% for AGIs $50k-75k, 62.2% for AGIs $75k-100k, 67.0% for AGIs over 100k)
Likely homosexual households (counted as self-reported same-sex unmarried-partner households)
Lesbian couples: 0.3% of all households
Gay men: 0.1% of all households
Household received Food Stamps/SNAP in the past 12 months: 8,014 Household did not receive Food Stamps/SNAP in the past 12 months: 10,648
Women who had a birth in the past 12 months: 717 (148 now married, 544 unmarried) Women who did not have a birth in the past 12 months: 9,708 (1,866 now married, 7,887 unmarried)
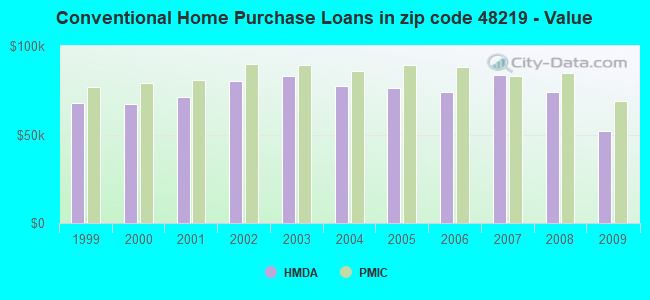
Housing units in zip code 48219 with a mortgage: 3,845 (261 second mortgage, 235 both second mortgage and home equity loan) Houses without a mortgage: 453
Median monthly owner costs for units with a mortgage: $1,130 Median monthly owner costs for units without a mortgage: $510
Residents with income below the poverty level in 2022:
This zip code:
27.2%
Whole state:
13.4%
Residents with income below 50% of the poverty level in 2022:
This zip code:
13.7%
Whole state:
6.9%
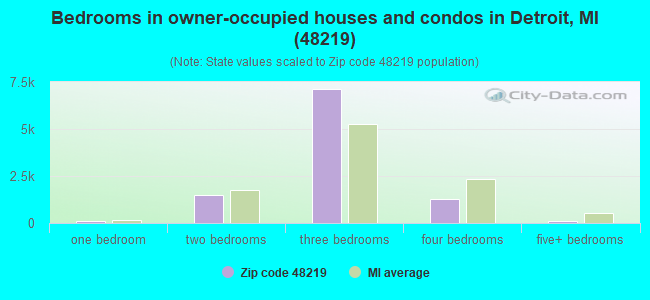
Median number of rooms in houses and condos:
Here:
6.1
State:
6.5
Median number of rooms in apartments:
Here:
5.0
State:
4.3
Notable locations in this zip code not listed on our city pages
Notable locations in zip code 48219: Bonnie Brook Golf Course (A), New Rogell Golf Course (B), Seven Evergreen Shopping Plaza (C), Denby Memorial Childrens Home (D), City of Detroit Fire Department Emergency Medical Services Medic 4 (E), City of Detroit Fire Department Engine 54 Ladder 26 (F), Christ the King Parish Center (G), DMC Health Care Center - Detroit (H), Precinct 8 Police Station (I), Redford Library (J). Display/hide their locations on the map
Churches in zip code 48219 include: Detroit Free Methodist Church (A), New for Saint Marks Missionary Baptist Church (B), Redford Lutheran Church (C), Redford Presbyterian Church (D), Redford United Methodist Church (E), Saint Christopher's and Saint Paul's Church (F), Jones Memorial Church of God and Christ (G), School of Preparation (H), Trinity-Faith United Methodist Church (I). Display/hide their locations on the map
Parks in zip code 48219 include: Tuttle Playground (1), Votrobeck Playground (2), Redford Theatre Historical Marker (3), Hackett Playground (4), Davison Patton Playground (5), Hope Playground (6), Marx Playground (7), Milan Playground (8), O'Hair Park (9). Display/hide their locations on the map
Tourist attractions (not listed on the city page) : Gospel Music Hall of Fame & Museum (Cultural Attractions- Events- & Facilities; 18301 West McNichols Road), Caribbean Cultural and Carnival (Cultural Attractions- Events- & Facilities; 18423 West McNichols Road), D B & Bp Charter & Tours (Tours & Charters; 20536 Marian Pl).
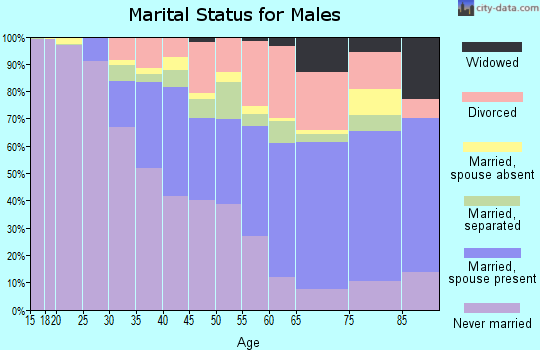
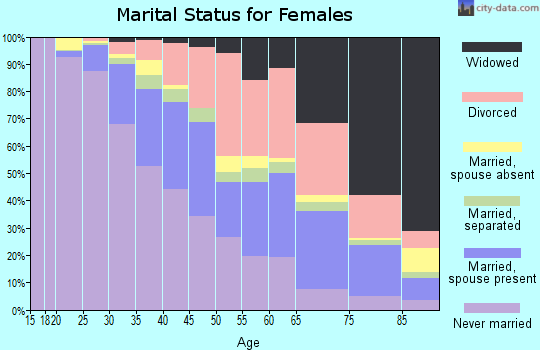
2,561 married couples with children.
5,173 single-parent households (813 men, 4,360 women).
95.2% of residents of 48219 zip code speak English at home.
1.1% of residents speak Spanish at home (83% very well, 11% well, 5% not well, 1% not at all).
1.3% of residents speak other Indo-European language at home (70% very well, 23% well, 6% not well).
0.3% of residents speak Asian or Pacific Island language at home (89% very well, 11% well).
1.6% of residents speak other language at home (92% very well, 6% well, 1% not well).
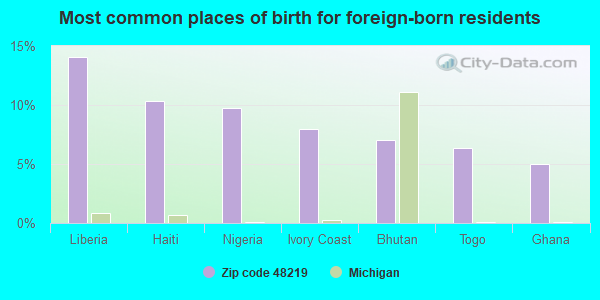
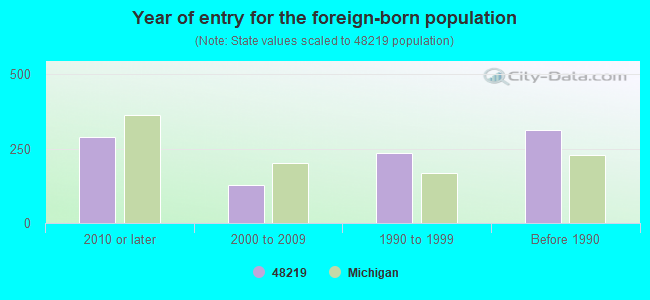
Foreign born population: 890 (2.0%) (44.3% of them are naturalized citizens)
Major facilities with environmental interests located in this zip code:
DOW ELEMENTARY SCHOOL (19900 MCINTYRE STREET in DETROIT, MI)
(National Center for Education Statistics) - STATE ID-00948 Conditionally Exempt Small Quantity Generators, less than 100 kg/month of hazardous waste (Resource Conservation and Recovery Act (tracking hazardous waste)) Organizations: DETROIT PUBLIC SCHOOLS (CONTACT/OWNER)
, DETROIT CITY SCHOOL DISTRICT (SCHOOL DISTRICT)
Alternative names: DOW ELEM SCHOOL
DETROIT PUBLIC SCHOOLS (19501 BERG RD in DETROIT, MI)
(National Center for Education Statistics) - STATE ID-04129 Conditionally Exempt Small Quantity Generators, less than 100 kg/month of hazardous waste (Resource Conservation and Recovery Act (tracking hazardous waste)) Organizations: DETROIT CITY SCHOOL DISTRICT (SCHOOL DISTRICT)
Alternative names: TAFT MIDDLE SCHOOL
EMERSON ELEMENTARY SCHOOL (18240 HUNTINGTON ROAD in DETROIT, MI)
(National Center for Education Statistics) - STATE ID-01134 Organizations: DETROIT CITY SCHOOL DISTRICT (SCHOOL DISTRICT)
AFRICAN HERITAGE CENTER (21511 W. MCNICHOLS in DETROIT, MI)
(National Center for Education Statistics) - STATE ID-08534 Organizations: DETROIT CITY SCHOOL DISTRICT (SCHOOL DISTRICT)
DETROIT OPEN SCHOOL (24601 FRISBEE STREET in DETROIT, MI)
(National Center for Education Statistics) - STATE ID-03720 Organizations: DETROIT CITY SCHOOL DISTRICT (SCHOOL DISTRICT)
CHARLES WRIGHT SCHOOL (19299 BERG ROAD in DETROIT, MI)
(National Center for Education Statistics) - STATE ID-09125 Organizations: DETROIT CITY SCHOOL DISTRICT (SCHOOL DISTRICT)
DETROIT UNIV OF MERCY OUTER DR (8200 W OUTER DR in DETROIT, MI)
(Resource Conservation and Recovery Act (tracking hazardous waste)) Small Quantity Generators, between 100 kg and 1000 kg of hazardous waste/month (Resource Conservation and Recovery Act (tracking hazardous waste)) Organizations: SR MAUREEN FAY PRES (CONTACT/OPERATOR)
AMOCO OIL CO 5834 (19100 TELEGRAPH in DETROIT, MI)
(Resource Conservation and Recovery Act (tracking hazardous waste)) Organizations: AMOCO OIL COMPANY (CONTACT/OWNER)
EQUITY FUNDING INC (24251 W. MCNICHOLS in DETROIT, MI)
(Resource Conservation and Recovery Act (tracking hazardous waste)) Organizations: JOHN CINI (CONTACT/OWNER)
AMOCO OIL CO 3858 (20121 W MCNICHOLS in DETROIT, MI)
(Resource Conservation and Recovery Act (tracking hazardous waste)) Organizations: AMOCO OIL COMPANY (CONTACT/OWNER)
MI DEPT/TRANSPORTATION BRIDGE P03-82193 (M-39 UNDER VASSAR AVE SKYWALK in DETROIT, MI)
(Resource Conservation and Recovery Act (tracking hazardous waste)) Organizations: MICH DEPT OF TRANSPORTATION (CONTACT/OPERATOR)
Alternative names: MIDOT BRIDGE M-39 UNDER VASSAR SKYWALK
AMOCO OIL CO 9659 AT SIXTH AND TELEGRAPH (17101 TELEGRAPH RD in DETROIT, MI)
(Resource Conservation and Recovery Act (tracking hazardous waste)) Organizations: AMOCO OIL COMPANY (CONTACT/OWNER)
Housing units lacking complete plumbing facilities: 6.7% Housing units lacking complete kitchen facilities: 8.9%
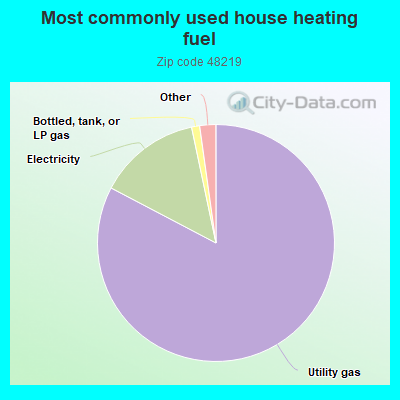
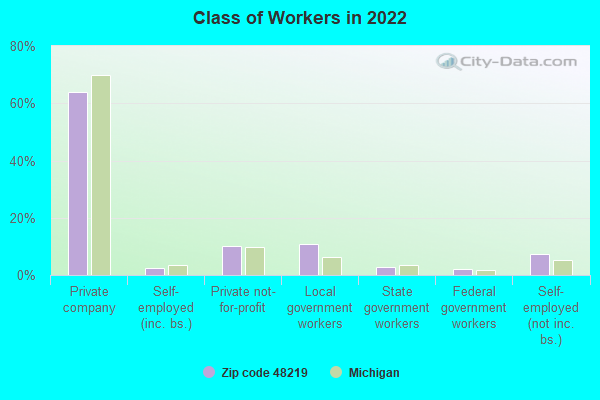
82.7%Utility gas
14.0%Electricity
1.1%Bottled, tank, or LP gas
1.0%Wood
0.9%No fuel used
Population in 1990: 63,058.
Place of birth for U.S.-born residents:
This state: 35,872
Northeast: 778
Midwest: 1,610
South: 4,644
West: 510
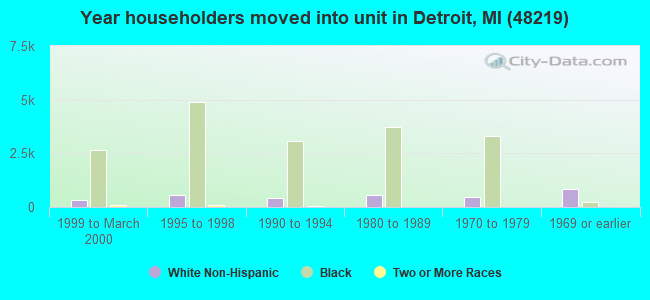
65% of the 48219 zip code residents lived in the same house 5 years ago. Out of people who lived in different houses, 85% lived in this county. Out of people who lived in different counties, 50% lived in Michigan.
91% of the 48219 zip code residents lived in the same house 1 year ago. Out of people who lived in different houses, 65% moved from this county. Out of people who lived in different houses, 22% moved from different county within same state. Out of people who lived in different houses, 10% moved from different state. Out of people who lived in different houses, 1% moved from abroad.
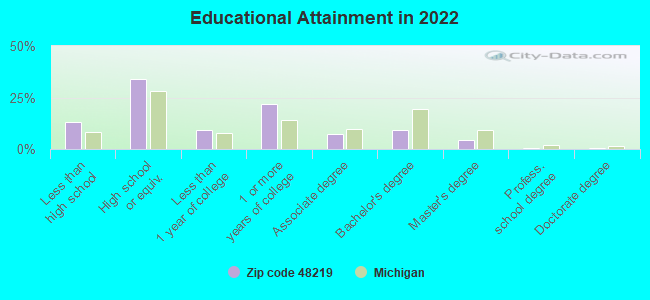
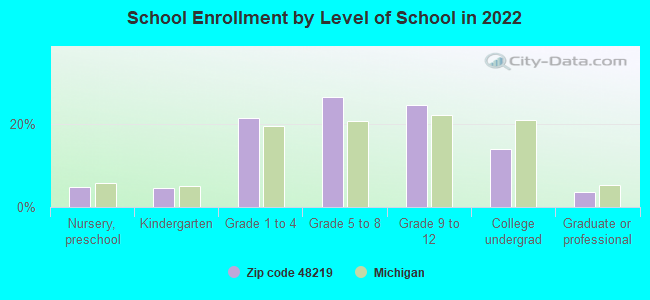
Private vs. public school enrollment:
Students in private schools in grades 1 to 8 (elementary and middle school): 377
Here:
8.0%
Michigan:
12.4%
Students in private schools in grades 9 to 12 (high school): 210
Here:
8.6%
Michigan:
9.8%
Students in private undergraduate colleges: 242
Here:
17.5%
Michigan:
14.9%
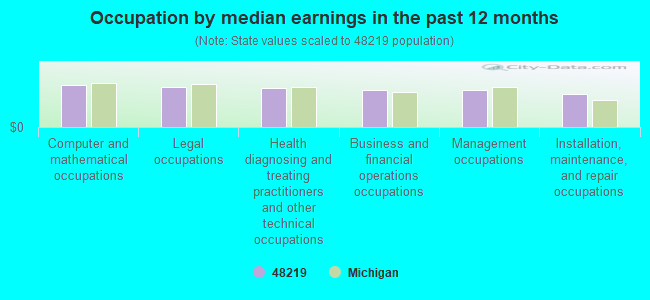
Occupation by median earnings in the past 12 months ($)
55,963Computer and mathematical occupations
52,743Legal occupations
51,699Health diagnosing and treating practitioners and other technical occupations
48,729Business and financial operations occupations
48,406Management occupations
44,053Installation, maintenance, and repair occupations
Companies with federal contracts located in this zip code (DETROIT, MI):
LAKESHORE ENGINEERING SERVICES (19215 W 8 MILE RD; small business) : $12,437,949 in 19 contractsfrom 2004 to 2006
Contracts for Construction of Structures and Facilities -- Restoration of real property, Facilities Operations Support Services, Maintenance, Repair or Alteration of Real Property -- Miscellaneous Buildings, Maintenance, Repair or Alteration of Real Property -- Hospitals and Infirmaries, and moreby U.S. Army Corps of Engineers - civil program financing only, Army, Department of Veterans Affairs, U.S. Coast Guard, and others Signed by year:2000: $0; 2001: $0; 2002: $0; 2003: $0; 2004: $156,576; 2005: $12,222,260; 2006: $59,113.
Biggest contracts:
$5,974,721 with U.S. Army Corps of Engineers - civil program financing only for Construction of Structures and Facilities -- Restoration of real property. Taking place in TN. Signed on 2005-06-17. Completion date: 2006-12-31.
$5,974,721 with Army for Construction of Structures and Facilities -- Restoration of real property. Taking place in TN. Signed on 2005-06-17. Completion date: 2006-12-31.
$113,668 with Department of Veterans Affairs for Facilities Operations Support Services. Signed on 2005-02-01. Completion date: 2005-09-30.
$107,561 with U.S. Coast Guard for Maintenance, Repair or Alteration of Real Property -- Miscellaneous Buildings. Taking place in NY. Signed on 2004-11-01. Completion date: 2005-05-20.
UNIVERSITY OF DETROIT MERCY (4001 W MCNICHOLS ROAD) : $1,874,135 in 36 contractsfrom 1999 to 2006
Contracts for Tuition, Registration, and Membership Fees, Educational Services, Veterinary/Animal Care Services, Construction of Structures and Facilities -- Schools, and moreby Navy, Army, NASA Signed by year:2000: $94,305; 2001: $74,338; 2002: $192,744; 2003: $168,374; 2004: $56,742; 2005: $792,022; 2006: $364,128.
Biggest contracts:
$262,647 with Navy for Tuition, Registration, and Membership Fees. Signed on 2005-10-31. Completion date: 2006-08-31.
$232,000, same as above.Signed on 2006-04-26. Completion date: 2006-12-31.
$198,000, same as above.Signed on 2005-05-20. Completion date: 2005-12-31.
$130,839 with Army for Tuition, Registration, and Membership Fees. Signed on 2002-05-23. Completion date: 2002-09-30.
JONART INDUSTRIES, INC (17321 TELEGRAPH ROAD, SUIT; small business)
$39,842 with U.S. Army Corps of Engineers - civil program financing only for ADP Input/Output and Storage Devices. Signed on 2001-06-11. Completion date: 2001-06-29.
KATHLEEN W NEWELL (P O BOX; small business)
$5,300 with Office of the Assistant Secretary for Administration and Management for . Signed on 2004-11-08. Effective on 2004-10-01. Completion date: 2005-09-30.
CAMTRONICS COMMUNICATION COMPA (18655 WEST 8 MILE ROAD; small business) : $2,664 in 2 contractsin 2002
$2,664 with Army for Miscellaneous Communication Equipment. Signed on 2002-03-22. Completion date: 2000-10-31.
$0, same as above.Signed on 2002-03-22. Completion date: 2000-10-31.
Top industries in this zip code by the number of employees in 2005:
2002 - 2018 National Fire Incident Reporting System (NFIRS) incidents
Based on the data from the years 2002 - 2018 the average number of fires per year is 294. The highest number of fires - 612 took place in 2013, and the least - 0 in 2007. The data has an increasing trend.
When looking into fire subcategories, the most reports belonged to: Structure Fires (66.8%), and Mobile Property/Vehicle Fires (16.6%).
Fire incident types reported to NFIRS in Zip Code 48219


 Nearest zip codes: 48223, 48075, 48240, 48033, 48235, 48239.


 Based on the data from the years 2002 - 2018 the average number of fires per year is 294. The highest number of fires - 612 took place in 2013, and the least - 0 in 2007. The data has an increasing trend.
 When looking into fire subcategories, the most reports belonged to: Structure Fires (66.8%), and Mobile Property/Vehicle Fires (16.6%).