Estimated zip code population in 2022: 25,686
Zip code population in 2010: 25,336
Zip code population in 2000: 36,073
Houses and condos: 11,437
Renter-occupied apartments: 4,279
% of renters here:
44%State:
27%
March 2022 cost of living index in zip code 48223: 94.4
(less than average, U.S. average is 100)
Land area: 6.1
sq. mi.
Water area: 0.0
sq. mi.
Population density: 4,243 people per square mile (average).
OSM Map
General Map
Google Map
MSN Map
OSM Map
General Map
Google Map
MSN Map
OSM Map
General Map
Google Map
MSN Map
OSM Map
General Map
Google Map
MSN Map
Please wait while loading the map...
Real estate property taxes paid for housing units in 2022:
This zip code:
2.0% ($1,852)Michigan:
1.2% ($2,746)
Median real estate property taxes paid for housing units with mortgages in 2022: $2,339 (1.7%)
Median real estate property taxes paid for housing units with no mortgage in 2022: $1,596 (2.0%)
Profiles of local businesses
Business Search - 14 Million verified businesses
Males: 12,251 Females: 13,435
For population 25 years and over in 48223:
High school or higher: 90.2%Bachelor's degree or higher: 20.4%Graduate or professional degree: 9.8%Unemployed: 10.3%Mean travel time to work (commute): 25.8 minutes
For population 15 years and over in 48223:
Never married: 55.1%Now married: 27.7%Separated: 1.9%Widowed: 5.4%Divorced: 9.9%
Zip code 48223 compared to state average:
Median household income below state average. Median house value significantly below state average. Unemployed percentage above state average. Black race population percentage significantly above state average. Hispanic race population percentage significantly below state average. Median age below state average. Foreign-born population percentage significantly below state average. Renting percentage above state average. Length of stay since moving in significantly above state average. House age above state average. Percentage of population with a bachelor's degree or higher below state average. 22,581 87.9% Black 1,643 6.4% White 965 3.8% Two or more races 248 1.0% Hispanic or Latino 122 0.5% American Indian 104 0.4% Some other race 19 0.07% Asian
Data:
Median household income ($)
Median household income (% change since 2000)
Household income diversity
Ratio of average income to average house value (%)
Ratio of average income to average rent
Median household income ($) - White
Median household income ($) - Black or African American
Median household income ($) - Asian
Median household income ($) - Hispanic or Latino
Median household income ($) - American Indian and Alaska Native
Median household income ($) - Multirace
Median household income ($) - Other Race
Median household income for houses/condos with a mortgage ($)
Median household income for apartments without a mortgage ($)
Races - White alone (%)
Races - White alone (% change since 2000)
Races - Black alone (%)
Races - Black alone (% change since 2000)
Races - American Indian alone (%)
Races - American Indian alone (% change since 2000)
Races - Asian alone (%)
Races - Asian alone (% change since 2000)
Races - Hispanic (%)
Races - Hispanic (% change since 2000)
Races - Native Hawaiian and Other Pacific Islander alone (%)
Races - Native Hawaiian and Other Pacific Islander alone (% change since 2000)
Races - Two or more races (%)
Races - Two or more races (% change since 2000)
Races - Other race alone (%)
Races - Other race alone (% change since 2000)
Racial diversity
Unemployment (%)
Unemployment (% change since 2000)
Unemployment (%) - White
Unemployment (%) - Black or African American
Unemployment (%) - Asian
Unemployment (%) - Hispanic or Latino
Unemployment (%) - American Indian and Alaska Native
Unemployment (%) - Multirace
Unemployment (%) - Other Race
Population density (people per square mile)
Population - Males (%)
Population - Females (%)
Population - Males (%) - White
Population - Males (%) - Black or African American
Population - Males (%) - Asian
Population - Males (%) - Hispanic or Latino
Population - Males (%) - American Indian and Alaska Native
Population - Males (%) - Multirace
Population - Males (%) - Other Race
Population - Females (%) - White
Population - Females (%) - Black or African American
Population - Females (%) - Asian
Population - Females (%) - Hispanic or Latino
Population - Females (%) - American Indian and Alaska Native
Population - Females (%) - Multirace
Population - Females (%) - Other Race
Coronavirus confirmed cases (Apr 27, 2024)
Deaths caused by coronavirus (Apr 27, 2024)
Coronavirus confirmed cases (per 100k population) (Apr 27, 2024)
Deaths caused by coronavirus (per 100k population) (Apr 27, 2024)
Daily increase in number of cases (Apr 27, 2024)
Weekly increase in number of cases (Apr 27, 2024)
Cases doubled (in days) (Apr 27, 2024)
Hospitalized patients (Apr 18, 2022)
Negative test results (Apr 18, 2022)
Total test results (Apr 18, 2022)
COVID Vaccine doses distributed (per 100k population) (Sep 19, 2023)
COVID Vaccine doses administered (per 100k population) (Sep 19, 2023)
COVID Vaccine doses distributed (Sep 19, 2023)
COVID Vaccine doses administered (Sep 19, 2023)
Likely homosexual households (%)
Likely homosexual households (% change since 2000)
Likely homosexual households - Lesbian couples (%)
Likely homosexual households - Lesbian couples (% change since 2000)
Likely homosexual households - Gay men (%)
Likely homosexual households - Gay men (% change since 2000)
Cost of living index
Median gross rent ($)
Median contract rent ($)
Median monthly housing costs ($)
Median house or condo value ($)
Median house or condo value ($ change since 2000)
Mean house or condo value by units in structure - 1, detached ($)
Mean house or condo value by units in structure - 1, attached ($)
Mean house or condo value by units in structure - 2 ($)
Mean house or condo value by units in structure by units in structure - 3 or 4 ($)
Mean house or condo value by units in structure - 5 or more ($)
Mean house or condo value by units in structure - Boat, RV, van, etc. ($)
Mean house or condo value by units in structure - Mobile home ($)
Median house or condo value ($) - White
Median house or condo value ($) - Black or African American
Median house or condo value ($) - Asian
Median house or condo value ($) - Hispanic or Latino
Median house or condo value ($) - American Indian and Alaska Native
Median house or condo value ($) - Multirace
Median house or condo value ($) - Other Race
Median resident age
Resident age diversity
Median resident age - Males
Median resident age - Females
Median resident age - White
Median resident age - Black or African American
Median resident age - Asian
Median resident age - Hispanic or Latino
Median resident age - American Indian and Alaska Native
Median resident age - Multirace
Median resident age - Other Race
Median resident age - Males - White
Median resident age - Males - Black or African American
Median resident age - Males - Asian
Median resident age - Males - Hispanic or Latino
Median resident age - Males - American Indian and Alaska Native
Median resident age - Males - Multirace
Median resident age - Males - Other Race
Median resident age - Females - White
Median resident age - Females - Black or African American
Median resident age - Females - Asian
Median resident age - Females - Hispanic or Latino
Median resident age - Females - American Indian and Alaska Native
Median resident age - Females - Multirace
Median resident age - Females - Other Race
Commute - mean travel time to work (minutes)
Travel time to work - Less than 5 minutes (%)
Travel time to work - Less than 5 minutes (% change since 2000)
Travel time to work - 5 to 9 minutes (%)
Travel time to work - 5 to 9 minutes (% change since 2000)
Travel time to work - 10 to 19 minutes (%)
Travel time to work - 10 to 19 minutes (% change since 2000)
Travel time to work - 20 to 29 minutes (%)
Travel time to work - 20 to 29 minutes (% change since 2000)
Travel time to work - 30 to 39 minutes (%)
Travel time to work - 30 to 39 minutes (% change since 2000)
Travel time to work - 40 to 59 minutes (%)
Travel time to work - 40 to 59 minutes (% change since 2000)
Travel time to work - 60 to 89 minutes (%)
Travel time to work - 60 to 89 minutes (% change since 2000)
Travel time to work - 90 or more minutes (%)
Travel time to work - 90 or more minutes (% change since 2000)
Marital status - Never married (%)
Marital status - Now married (%)
Marital status - Separated (%)
Marital status - Widowed (%)
Marital status - Divorced (%)
Median family income ($)
Median family income (% change since 2000)
Median non-family income ($)
Median non-family income (% change since 2000)
Median per capita income ($)
Median per capita income (% change since 2000)
Median family income ($) - White
Median family income ($) - Black or African American
Median family income ($) - Asian
Median family income ($) - Hispanic or Latino
Median family income ($) - American Indian and Alaska Native
Median family income ($) - Multirace
Median family income ($) - Other Race
Median year house/condo built
Median year apartment built
Year house built - Built 2005 or later (%)
Year house built - Built 2000 to 2004 (%)
Year house built - Built 1990 to 1999 (%)
Year house built - Built 1980 to 1989 (%)
Year house built - Built 1970 to 1979 (%)
Year house built - Built 1960 to 1969 (%)
Year house built - Built 1950 to 1959 (%)
Year house built - Built 1940 to 1949 (%)
Year house built - Built 1939 or earlier (%)
Average household size
Household density (households per square mile)
Average household size - White
Average household size - Black or African American
Average household size - Asian
Average household size - Hispanic or Latino
Average household size - American Indian and Alaska Native
Average household size - Multirace
Average household size - Other Race
Occupied housing units (%)
Vacant housing units (%)
Owner occupied housing units (%)
Renter occupied housing units (%)
Vacancy status - For rent (%)
Vacancy status - For sale only (%)
Vacancy status - Rented or sold, not occupied (%)
Vacancy status - For seasonal, recreational, or occasional use (%)
Vacancy status - For migrant workers (%)
Vacancy status - Other vacant (%)
Residents with income below the poverty level (%)
Residents with income below 50% of the poverty level (%)
Children below poverty level (%)
Poor families by family type - Married-couple family (%)
Poor families by family type - Male, no wife present (%)
Poor families by family type - Female, no husband present (%)
Poverty status for native-born residents (%)
Poverty status for foreign-born residents (%)
Poverty among high school graduates not in families (%)
Poverty among people who did not graduate high school not in families (%)
Residents with income below the poverty level (%) - White
Residents with income below the poverty level (%) - Black or African American
Residents with income below the poverty level (%) - Asian
Residents with income below the poverty level (%) - Hispanic or Latino
Residents with income below the poverty level (%) - American Indian and Alaska Native
Residents with income below the poverty level (%) - Multirace
Residents with income below the poverty level (%) - Other Race
Air pollution - Air Quality Index (AQI)
Air pollution - CO
Air pollution - NO2
Air pollution - SO2
Air pollution - Ozone
Air pollution - PM10
Air pollution - PM25
Air pollution - Pb
Crime - Murders per 100,000 population
Crime - Rapes per 100,000 population
Crime - Robberies per 100,000 population
Crime - Assaults per 100,000 population
Crime - Burglaries per 100,000 population
Crime - Thefts per 100,000 population
Crime - Auto thefts per 100,000 population
Crime - Arson per 100,000 population
Crime - City-data.com crime index
Crime - Violent crime index
Crime - Property crime index
Crime - Murders per 100,000 population (5 year average)
Crime - Rapes per 100,000 population (5 year average)
Crime - Robberies per 100,000 population (5 year average)
Crime - Assaults per 100,000 population (5 year average)
Crime - Burglaries per 100,000 population (5 year average)
Crime - Thefts per 100,000 population (5 year average)
Crime - Auto thefts per 100,000 population (5 year average)
Crime - Arson per 100,000 population (5 year average)
Crime - City-data.com crime index (5 year average)
Crime - Violent crime index (5 year average)
Crime - Property crime index (5 year average)
1996 Presidential Elections Results (%) - Democratic Party (Clinton)
1996 Presidential Elections Results (%) - Republican Party (Dole)
1996 Presidential Elections Results (%) - Other
2000 Presidential Elections Results (%) - Democratic Party (Gore)
2000 Presidential Elections Results (%) - Republican Party (Bush)
2000 Presidential Elections Results (%) - Other
2004 Presidential Elections Results (%) - Democratic Party (Kerry)
2004 Presidential Elections Results (%) - Republican Party (Bush)
2004 Presidential Elections Results (%) - Other
2008 Presidential Elections Results (%) - Democratic Party (Obama)
2008 Presidential Elections Results (%) - Republican Party (McCain)
2008 Presidential Elections Results (%) - Other
2012 Presidential Elections Results (%) - Democratic Party (Obama)
2012 Presidential Elections Results (%) - Republican Party (Romney)
2012 Presidential Elections Results (%) - Other
2016 Presidential Elections Results (%) - Democratic Party (Clinton)
2016 Presidential Elections Results (%) - Republican Party (Trump)
2016 Presidential Elections Results (%) - Other
2020 Presidential Elections Results (%) - Democratic Party (Biden)
2020 Presidential Elections Results (%) - Republican Party (Trump)
2020 Presidential Elections Results (%) - Other
Ancestries Reported - Arab (%)
Ancestries Reported - Czech (%)
Ancestries Reported - Danish (%)
Ancestries Reported - Dutch (%)
Ancestries Reported - English (%)
Ancestries Reported - French (%)
Ancestries Reported - French Canadian (%)
Ancestries Reported - German (%)
Ancestries Reported - Greek (%)
Ancestries Reported - Hungarian (%)
Ancestries Reported - Irish (%)
Ancestries Reported - Italian (%)
Ancestries Reported - Lithuanian (%)
Ancestries Reported - Norwegian (%)
Ancestries Reported - Polish (%)
Ancestries Reported - Portuguese (%)
Ancestries Reported - Russian (%)
Ancestries Reported - Scotch-Irish (%)
Ancestries Reported - Scottish (%)
Ancestries Reported - Slovak (%)
Ancestries Reported - Subsaharan African (%)
Ancestries Reported - Swedish (%)
Ancestries Reported - Swiss (%)
Ancestries Reported - Ukrainian (%)
Ancestries Reported - United States (%)
Ancestries Reported - Welsh (%)
Ancestries Reported - West Indian (%)
Ancestries Reported - Other (%)
Educational Attainment - No schooling completed (%)
Educational Attainment - Less than high school (%)
Educational Attainment - High school or equivalent (%)
Educational Attainment - Less than 1 year of college (%)
Educational Attainment - 1 or more years of college (%)
Educational Attainment - Associate degree (%)
Educational Attainment - Bachelor's degree (%)
Educational Attainment - Master's degree (%)
Educational Attainment - Professional school degree (%)
Educational Attainment - Doctorate degree (%)
School Enrollment - Nursery, preschool (%)
School Enrollment - Kindergarten (%)
School Enrollment - Grade 1 to 4 (%)
School Enrollment - Grade 5 to 8 (%)
School Enrollment - Grade 9 to 12 (%)
School Enrollment - College undergrad (%)
School Enrollment - Graduate or professional (%)
School Enrollment - Not enrolled in school (%)
School enrollment - Public schools (%)
School enrollment - Private schools (%)
School enrollment - Not enrolled (%)
Median number of rooms in houses and condos
Median number of rooms in apartments
Housing units lacking complete plumbing facilities (%)
Housing units lacking complete kitchen facilities (%)
Density of houses
Urban houses (%)
Rural houses (%)
Households with people 60 years and over (%)
Households with people 65 years and over (%)
Households with people 75 years and over (%)
Households with one or more nonrelatives (%)
Households with no nonrelatives (%)
Population in households (%)
Family households (%)
Nonfamily households (%)
Population in families (%)
Family households with own children (%)
Median number of bedrooms in owner occupied houses
Mean number of bedrooms in owner occupied houses
Median number of bedrooms in renter occupied houses
Mean number of bedrooms in renter occupied houses
Median number of vehichles in owner occupied houses
Mean number of vehichles in owner occupied houses
Median number of vehichles in renter occupied houses
Mean number of vehichles in renter occupied houses
Mortgage status - with mortgage (%)
Mortgage status - with second mortgage (%)
Mortgage status - with home equity loan (%)
Mortgage status - with both second mortgage and home equity loan (%)
Mortgage status - without a mortgage (%)
Average family size
Average family size - White
Average family size - Black or African American
Average family size - Asian
Average family size - Hispanic or Latino
Average family size - American Indian and Alaska Native
Average family size - Multirace
Average family size - Other Race
Geographical mobility - Same house 1 year ago (%)
Geographical mobility - Moved within same county (%)
Geographical mobility - Moved from different county within same state (%)
Geographical mobility - Moved from different state (%)
Geographical mobility - Moved from abroad (%)
Place of birth - Born in state of residence (%)
Place of birth - Born in other state (%)
Place of birth - Native, outside of US (%)
Place of birth - Foreign born (%)
Housing units in structures - 1, detached (%)
Housing units in structures - 1, attached (%)
Housing units in structures - 2 (%)
Housing units in structures - 3 or 4 (%)
Housing units in structures - 5 to 9 (%)
Housing units in structures - 10 to 19 (%)
Housing units in structures - 20 to 49 (%)
Housing units in structures - 50 or more (%)
Housing units in structures - Mobile home (%)
Housing units in structures - Boat, RV, van, etc. (%)
House/condo owner moved in on average (years ago)
Renter moved in on average (years ago)
Year householder moved into unit - Moved in 1999 to March 2000 (%)
Year householder moved into unit - Moved in 1995 to 1998 (%)
Year householder moved into unit - Moved in 1990 to 1994 (%)
Year householder moved into unit - Moved in 1980 to 1989 (%)
Year householder moved into unit - Moved in 1970 to 1979 (%)
Year householder moved into unit - Moved in 1969 or earlier (%)
Means of transportation to work - Drove car alone (%)
Means of transportation to work - Carpooled (%)
Means of transportation to work - Public transportation (%)
Means of transportation to work - Bus or trolley bus (%)
Means of transportation to work - Streetcar or trolley car (%)
Means of transportation to work - Subway or elevated (%)
Means of transportation to work - Railroad (%)
Means of transportation to work - Ferryboat (%)
Means of transportation to work - Taxicab (%)
Means of transportation to work - Motorcycle (%)
Means of transportation to work - Bicycle (%)
Means of transportation to work - Walked (%)
Means of transportation to work - Other means (%)
Working at home (%)
Industry diversity
Most Common Industries - Agriculture, forestry, fishing and hunting, and mining (%)
Most Common Industries - Agriculture, forestry, fishing and hunting (%)
Most Common Industries - Mining, quarrying, and oil and gas extraction (%)
Most Common Industries - Construction (%)
Most Common Industries - Manufacturing (%)
Most Common Industries - Wholesale trade (%)
Most Common Industries - Retail trade (%)
Most Common Industries - Transportation and warehousing, and utilities (%)
Most Common Industries - Transportation and warehousing (%)
Most Common Industries - Utilities (%)
Most Common Industries - Information (%)
Most Common Industries - Finance and insurance, and real estate and rental and leasing (%)
Most Common Industries - Finance and insurance (%)
Most Common Industries - Real estate and rental and leasing (%)
Most Common Industries - Professional, scientific, and management, and administrative and waste management services (%)
Most Common Industries - Professional, scientific, and technical services (%)
Most Common Industries - Management of companies and enterprises (%)
Most Common Industries - Administrative and support and waste management services (%)
Most Common Industries - Educational services, and health care and social assistance (%)
Most Common Industries - Educational services (%)
Most Common Industries - Health care and social assistance (%)
Most Common Industries - Arts, entertainment, and recreation, and accommodation and food services (%)
Most Common Industries - Arts, entertainment, and recreation (%)
Most Common Industries - Accommodation and food services (%)
Most Common Industries - Other services, except public administration (%)
Most Common Industries - Public administration (%)
Occupation diversity
Most Common Occupations - Management, business, science, and arts occupations (%)
Most Common Occupations - Management, business, and financial occupations (%)
Most Common Occupations - Management occupations (%)
Most Common Occupations - Business and financial operations occupations (%)
Most Common Occupations - Computer, engineering, and science occupations (%)
Most Common Occupations - Computer and mathematical occupations (%)
Most Common Occupations - Architecture and engineering occupations (%)
Most Common Occupations - Life, physical, and social science occupations (%)
Most Common Occupations - Education, legal, community service, arts, and media occupations (%)
Most Common Occupations - Community and social service occupations (%)
Most Common Occupations - Legal occupations (%)
Most Common Occupations - Education, training, and library occupations (%)
Most Common Occupations - Arts, design, entertainment, sports, and media occupations (%)
Most Common Occupations - Healthcare practitioners and technical occupations (%)
Most Common Occupations - Health diagnosing and treating practitioners and other technical occupations (%)
Most Common Occupations - Health technologists and technicians (%)
Most Common Occupations - Service occupations (%)
Most Common Occupations - Healthcare support occupations (%)
Most Common Occupations - Protective service occupations (%)
Most Common Occupations - Fire fighting and prevention, and other protective service workers including supervisors (%)
Most Common Occupations - Law enforcement workers including supervisors (%)
Most Common Occupations - Food preparation and serving related occupations (%)
Most Common Occupations - Building and grounds cleaning and maintenance occupations (%)
Most Common Occupations - Personal care and service occupations (%)
Most Common Occupations - Sales and office occupations (%)
Most Common Occupations - Sales and related occupations (%)
Most Common Occupations - Office and administrative support occupations (%)
Most Common Occupations - Natural resources, construction, and maintenance occupations (%)
Most Common Occupations - Farming, fishing, and forestry occupations (%)
Most Common Occupations - Construction and extraction occupations (%)
Most Common Occupations - Installation, maintenance, and repair occupations (%)
Most Common Occupations - Production, transportation, and material moving occupations (%)
Most Common Occupations - Production occupations (%)
Most Common Occupations - Transportation occupations (%)
Most Common Occupations - Material moving occupations (%)
People in Group quarters - Institutionalized population (%)
People in Group quarters - Correctional institutions (%)
People in Group quarters - Federal prisons and detention centers (%)
People in Group quarters - Halfway houses (%)
People in Group quarters - Local jails and other confinement facilities (including police lockups) (%)
People in Group quarters - Military disciplinary barracks (%)
People in Group quarters - State prisons (%)
People in Group quarters - Other types of correctional institutions (%)
People in Group quarters - Nursing homes (%)
People in Group quarters - Hospitals/wards, hospices, and schools for the handicapped (%)
People in Group quarters - Hospitals/wards and hospices for chronically ill (%)
People in Group quarters - Hospices or homes for chronically ill (%)
People in Group quarters - Military hospitals or wards for chronically ill (%)
People in Group quarters - Other hospitals or wards for chronically ill (%)
People in Group quarters - Hospitals or wards for drug/alcohol abuse (%)
People in Group quarters - Mental (Psychiatric) hospitals or wards (%)
People in Group quarters - Schools, hospitals, or wards for the mentally retarded (%)
People in Group quarters - Schools, hospitals, or wards for the physically handicapped (%)
People in Group quarters - Institutions for the deaf (%)
People in Group quarters - Institutions for the blind (%)
People in Group quarters - Orthopedic wards and institutions for the physically handicapped (%)
People in Group quarters - Wards in general hospitals for patients who have no usual home elsewhere (%)
People in Group quarters - Wards in military hospitals for patients who have no usual home elsewhere (%)
People in Group quarters - Juvenile institutions (%)
People in Group quarters - Long-term care (%)
People in Group quarters - Homes for abused, dependent, and neglected children (%)
People in Group quarters - Residential treatment centers for emotionally disturbed children (%)
People in Group quarters - Training schools for juvenile delinquents (%)
People in Group quarters - Short-term care, detention or diagnostic centers for delinquent children (%)
People in Group quarters - Type of juvenile institution unknown (%)
People in Group quarters - Noninstitutionalized population (%)
People in Group quarters - College dormitories (includes college quarters off campus) (%)
People in Group quarters - Military quarters (%)
People in Group quarters - On base (%)
People in Group quarters - Barracks, unaccompanied personnel housing (UPH), (Enlisted/Officer), ;and similar group living quarters for military personnel (%)
People in Group quarters - Transient quarters for temporary residents (%)
People in Group quarters - Military ships (%)
People in Group quarters - Group homes (%)
People in Group quarters - Homes or halfway houses for drug/alcohol abuse (%)
People in Group quarters - Homes for the mentally ill (%)
People in Group quarters - Homes for the mentally retarded (%)
People in Group quarters - Homes for the physically handicapped (%)
People in Group quarters - Other group homes (%)
People in Group quarters - Religious group quarters (%)
People in Group quarters - Dormitories (%)
People in Group quarters - Agriculture workers' dormitories on farms (%)
People in Group quarters - Job Corps and vocational training facilities (%)
People in Group quarters - Other workers' dormitories (%)
People in Group quarters - Crews of maritime vessels (%)
People in Group quarters - Other nonhousehold living situations (%)
People in Group quarters - Other noninstitutional group quarters (%)
Residents speaking English at home (%)
Residents speaking English at home - Born in the United States (%)
Residents speaking English at home - Native, born elsewhere (%)
Residents speaking English at home - Foreign born (%)
Residents speaking Spanish at home (%)
Residents speaking Spanish at home - Born in the United States (%)
Residents speaking Spanish at home - Native, born elsewhere (%)
Residents speaking Spanish at home - Foreign born (%)
Residents speaking other language at home (%)
Residents speaking other language at home - Born in the United States (%)
Residents speaking other language at home - Native, born elsewhere (%)
Residents speaking other language at home - Foreign born (%)
Class of Workers - Employee of private company (%)
Class of Workers - Self-employed in own incorporated business (%)
Class of Workers - Private not-for-profit wage and salary workers (%)
Class of Workers - Local government workers (%)
Class of Workers - State government workers (%)
Class of Workers - Federal government workers (%)
Class of Workers - Self-employed workers in own not incorporated business and Unpaid family workers (%)
House heating fuel used in houses and condos - Utility gas (%)
House heating fuel used in houses and condos - Bottled, tank, or LP gas (%)
House heating fuel used in houses and condos - Electricity (%)
House heating fuel used in houses and condos - Fuel oil, kerosene, etc. (%)
House heating fuel used in houses and condos - Coal or coke (%)
House heating fuel used in houses and condos - Wood (%)
House heating fuel used in houses and condos - Solar energy (%)
House heating fuel used in houses and condos - Other fuel (%)
House heating fuel used in houses and condos - No fuel used (%)
House heating fuel used in apartments - Utility gas (%)
House heating fuel used in apartments - Bottled, tank, or LP gas (%)
House heating fuel used in apartments - Electricity (%)
House heating fuel used in apartments - Fuel oil, kerosene, etc. (%)
House heating fuel used in apartments - Coal or coke (%)
House heating fuel used in apartments - Wood (%)
House heating fuel used in apartments - Solar energy (%)
House heating fuel used in apartments - Other fuel (%)
House heating fuel used in apartments - No fuel used (%)
Armed forces status - In Armed Forces (%)
Armed forces status - Civilian (%)
Armed forces status - Civilian - Veteran (%)
Armed forces status - Civilian - Nonveteran (%)
Fatal accidents locations in years 2005-2021
Fatal accidents locations in 2005
Fatal accidents locations in 2006
Fatal accidents locations in 2007
Fatal accidents locations in 2008
Fatal accidents locations in 2009
Fatal accidents locations in 2010
Fatal accidents locations in 2011
Fatal accidents locations in 2012
Fatal accidents locations in 2013
Fatal accidents locations in 2014
Fatal accidents locations in 2015
Fatal accidents locations in 2016
Fatal accidents locations in 2017
Fatal accidents locations in 2018
Fatal accidents locations in 2019
Fatal accidents locations in 2020
Fatal accidents locations in 2021
Alcohol use - People drinking some alcohol every month (%)
Alcohol use - People not drinking at all (%)
Alcohol use - Average days/month drinking alcohol
Alcohol use - Average drinks/week
Alcohol use - Average days/year people drink much
Audiometry - Average condition of hearing (%)
Audiometry - People that can hear a whisper from across a quiet room (%)
Audiometry - People that can hear normal voice from across a quiet room (%)
Audiometry - Ears ringing, roaring, buzzing (%)
Audiometry - Had a job exposure to loud noise (%)
Audiometry - Had off-work exposure to loud noise (%)
Blood Pressure & Cholesterol - Has high blood pressure (%)
Blood Pressure & Cholesterol - Checking blood pressure at home (%)
Blood Pressure & Cholesterol - Frequently checking blood cholesterol (%)
Blood Pressure & Cholesterol - Has high cholesterol level (%)
Consumer Behavior - Money monthly spent on food at supermarket/grocery store
Consumer Behavior - Money monthly spent on food at other stores
Consumer Behavior - Money monthly spent on eating out
Consumer Behavior - Money monthly spent on carryout/delivered foods
Consumer Behavior - Income spent on food at supermarket/grocery store (%)
Consumer Behavior - Income spent on food at other stores (%)
Consumer Behavior - Income spent on eating out (%)
Consumer Behavior - Income spent on carryout/delivered foods (%)
Current Health Status - General health condition (%)
Current Health Status - Blood donors (%)
Current Health Status - Has blood ever tested for HIV virus (%)
Current Health Status - Left-handed people (%)
Dermatology - People using sunscreen (%)
Diabetes - Diabetics (%)
Diabetes - Had a blood test for high blood sugar (%)
Diabetes - People taking insulin (%)
Diet Behavior & Nutrition - Diet health (%)
Diet Behavior & Nutrition - Milk product consumption (# of products/month)
Diet Behavior & Nutrition - Meals not home prepared (#/week)
Diet Behavior & Nutrition - Meals from fast food or pizza place (#/week)
Diet Behavior & Nutrition - Ready-to-eat foods (#/month)
Diet Behavior & Nutrition - Frozen meals/pizza (#/month)
Drug Use - People that ever used marijuana or hashish (%)
Drug Use - Ever used hard drugs (%)
Drug Use - Ever used any form of cocaine (%)
Drug Use - Ever used heroin (%)
Drug Use - Ever used methamphetamine (%)
Health Insurance - People covered by health insurance (%)
Kidney Conditions-Urology - Avg. # of times urinating at night
Medical Conditions - People with asthma (%)
Medical Conditions - People with anemia (%)
Medical Conditions - People with psoriasis (%)
Medical Conditions - People with overweight (%)
Medical Conditions - Elderly people having difficulties in thinking or remembering (%)
Medical Conditions - People who ever received blood transfusion (%)
Medical Conditions - People having trouble seeing even with glass/contacts (%)
Medical Conditions - People with arthritis (%)
Medical Conditions - People with gout (%)
Medical Conditions - People with congestive heart failure (%)
Medical Conditions - People with coronary heart disease (%)
Medical Conditions - People with angina pectoris (%)
Medical Conditions - People who ever had heart attack (%)
Medical Conditions - People who ever had stroke (%)
Medical Conditions - People with emphysema (%)
Medical Conditions - People with thyroid problem (%)
Medical Conditions - People with chronic bronchitis (%)
Medical Conditions - People with any liver condition (%)
Medical Conditions - People who ever had cancer or malignancy (%)
Mental Health - People who have little interest in doing things (%)
Mental Health - People feeling down, depressed, or hopeless (%)
Mental Health - People who have trouble sleeping or sleeping too much (%)
Mental Health - People feeling tired or having little energy (%)
Mental Health - People with poor appetite or overeating (%)
Mental Health - People feeling bad about themself (%)
Mental Health - People who have trouble concentrating on things (%)
Mental Health - People moving or speaking slowly or too fast (%)
Mental Health - People having thoughts they would be better off dead (%)
Oral Health - Average years since last visit a dentist
Oral Health - People embarrassed because of mouth (%)
Oral Health - People with gum disease (%)
Oral Health - General health of teeth and gums (%)
Oral Health - Average days a week using dental floss/device
Oral Health - Average days a week using mouthwash for dental problem
Oral Health - Average number of teeth
Pesticide Use - Households using pesticides to control insects (%)
Pesticide Use - Households using pesticides to kill weeds (%)
Physical Activity - People doing vigorous-intensity work activities (%)
Physical Activity - People doing moderate-intensity work activities (%)
Physical Activity - People walking or bicycling (%)
Physical Activity - People doing vigorous-intensity recreational activities (%)
Physical Activity - People doing moderate-intensity recreational activities (%)
Physical Activity - Average hours a day doing sedentary activities
Physical Activity - Average hours a day watching TV or videos
Physical Activity - Average hours a day using computer
Physical Functioning - People having limitations keeping them from working (%)
Physical Functioning - People limited in amount of work they can do (%)
Physical Functioning - People that need special equipment to walk (%)
Physical Functioning - People experiencing confusion/memory problems (%)
Physical Functioning - People requiring special healthcare equipment (%)
Prescription Medications - Average number of prescription medicines taking
Preventive Aspirin Use - Adults 40+ taking low-dose aspirin (%)
Reproductive Health - Vaginal deliveries (%)
Reproductive Health - Cesarean deliveries (%)
Reproductive Health - Deliveries resulted in a live birth (%)
Reproductive Health - Pregnancies resulted in a delivery (%)
Reproductive Health - Women breastfeeding newborns (%)
Reproductive Health - Women that had a hysterectomy (%)
Reproductive Health - Women that had both ovaries removed (%)
Reproductive Health - Women that have ever taken birth control pills (%)
Reproductive Health - Women taking birth control pills (%)
Reproductive Health - Women that have ever used Depo-Provera or injectables (%)
Reproductive Health - Women that have ever used female hormones (%)
Sexual Behavior - People 18+ that ever had sex (vaginal, anal, or oral) (%)
Sexual Behavior - Males 18+ that ever had vaginal sex with a woman (%)
Sexual Behavior - Males 18+ that ever performed oral sex on a woman (%)
Sexual Behavior - Males 18+ that ever had anal sex with a woman (%)
Sexual Behavior - Males 18+ that ever had any sex with a man (%)
Sexual Behavior - Females 18+ that ever had vaginal sex with a man (%)
Sexual Behavior - Females 18+ that ever performed oral sex on a man (%)
Sexual Behavior - Females 18+ that ever had anal sex with a man (%)
Sexual Behavior - Females 18+ that ever had any kind of sex with a woman (%)
Sexual Behavior - Average age people first had sex
Sexual Behavior - Average number of female sex partners in lifetime (males 18+)
Sexual Behavior - Average number of female vaginal sex partners in lifetime (males 18+)
Sexual Behavior - Average age people first performed oral sex on a woman (18+)
Sexual Behavior - Average number of woman performed oral sex on in lifetime (18+)
Sexual Behavior - Average number of male sex partners in lifetime (males 18+)
Sexual Behavior - Average number of male anal sex partners in lifetime (males 18+)
Sexual Behavior - Average age people first performed oral sex on a man (18+)
Sexual Behavior - Average number of male oral sex partners in lifetime (18+)
Sexual Behavior - People using protection when performing oral sex (%)
Sexual Behavior - Average number of times people have vaginal or anal sex a year
Sexual Behavior - People having sex without condom (%)
Sexual Behavior - Average number of male sex partners in lifetime (females 18+)
Sexual Behavior - Average number of male vaginal sex partners in lifetime (females 18+)
Sexual Behavior - Average number of female sex partners in lifetime (females 18+)
Sexual Behavior - Circumcised males 18+ (%)
Sleep Disorders - Average hours sleeping at night
Sleep Disorders - People that has trouble sleeping (%)
Smoking-Cigarette Use - People smoking cigarettes (%)
Taste & Smell - People 40+ having problems with smell (%)
Taste & Smell - People 40+ having problems with taste (%)
Taste & Smell - People 40+ that ever had wisdom teeth removed (%)
Taste & Smell - People 40+ that ever had tonsils teeth removed (%)
Taste & Smell - People 40+ that ever had a loss of consciousness because of a head injury (%)
Taste & Smell - People 40+ that ever had a broken nose or other serious injury to face or skull (%)
Taste & Smell - People 40+ that ever had two or more sinus infections (%)
Weight - Average height (inches)
Weight - Average weight (pounds)
Weight - Average BMI
Weight - People that are obese (%)
Weight - People that ever were obese (%)
Weight - People trying to lose weight (%)
100%
urban population.
Estimated median house/condo value in 2022: $94,514
48223:
$94,514Michigan:
$224,400
Median resident age: This zip code:
33.8 yearsMichigan median age:
40.3 years
Average household size: This zip code:
2.6 peopleMichigan:
2.4 people
Averages for the 2020 tax year for zip code 48223, filed in 2021:
Average Adjusted Gross Income (AGI) in 2020: $36,627 (Individual Income Tax Returns) Here:
$36,627State:
$68,945
Salary/wage: $33,051 (reported on 76.7% of returns )Here:
$33,051State:
$57,142
(% of AGI for various income ranges: 986.5% for AGIs below $25k , 3162.7% for AGIs $25k-50k , 7078.9% for AGIs $50k-75k , 10214.0% for AGIs $75k-100k , 16964.4% for AGIs $100k-200k ) Taxable interest for individuals: $370 (reported on 11.3% of returns )This zip code:
$370Michigan:
$1,630
(% of AGI for various income ranges: 4.4% for AGIs below $25k , 3.0% for AGIs $25k-50k , 5.2% for AGIs $50k-75k , 11.3% for AGIs $75k-100k , 36.3% for AGIs $100k-200k ) Ordinary dividends: $1,967 (reported on 4.6% of returns )(% of AGI for various income ranges: 2.4% for AGIs below $25k , 3.6% for AGIs $25k-50k , 21.5% for AGIs $50k-75k , 22.7% for AGIs $75k-100k , 180.7% for AGIs $100k-200k ) Net capital gain/loss in AGI: +$5,371 (reported on 3.9% of returns )Here:
+$5,371State:
+$20,064
(% of AGI for various income ranges: 1.5% for AGIs below $25k , 3.0% for AGIs $25k-50k , 20.0% for AGIs $50k-75k , 34.3% for AGIs $75k-100k , 618.1% for AGIs $100k-200k ) Taxable individual retirement arrangement distribution: $13,625 (reported on 4.1% of returns )48223:
$13,625Michigan:
$19,803
(% of AGI for various income ranges: 15.4% for AGIs below $25k , 38.2% for AGIs $25k-50k , 113.8% for AGIs $50k-75k , 346.7% for AGIs $75k-100k , 781.1% for AGIs $100k-200k ) Total itemized deductions: $24,894 (reported on 5.1% of returns )Here:
$24,894State:
$34,117
(% of AGI for various income ranges: 15.9% for AGIs below $25k , 97.6% for AGIs $25k-50k , 418.7% for AGIs $50k-75k , 871.0% for AGIs $75k-100k , 1130.0% for AGIs $100k-200k ) Charity contributions: $11,246 (reported on 4.7% of returns )Here:
$11,246State:
$13,548
(% of AGI for various income ranges: 5.1% for AGIs below $25k , 38.3% for AGIs $25k-50k , 156.8% for AGIs $50k-75k , 346.0% for AGIs $75k-100k , 551.9% for AGIs $100k-200k ) Taxes paid: $6,592 (reported on 5.1% of returns )(% of AGI for various income ranges: 3.3% for AGIs below $25k , 20.2% for AGIs $25k-50k , 111.1% for AGIs $50k-75k , 263.0% for AGIs $75k-100k , 320.4% for AGIs $100k-200k ) Earned income credit: $2,723 (reported on 33.5% of returns )(% of AGI for various income ranges: 164.7% for AGIs below $25k , 123.9% for AGIs $25k-50k ) Percentage of individuals using paid preparers for their 2020 taxes: 90.1%(% for various income ranges: 92.1% for AGIs below $25k , 91.8% for AGIs $25k-50k , 84.5% for AGIs $50k-75k , 82.7% for AGIs $75k-100k , 83.3% for AGIs $100k-200k , 80.0% for AGIs over 200k )
Averages for the 2012 tax year for zip code 48223, filed in 2013:
Average Adjusted Gross Income (AGI) in 2012: $30,848 (Individual Income Tax Returns) Here:
$30,848State:
$55,609
Salary/wage: $27,022 (reported on 81.1% of returns )Here:
$27,022State:
$46,782
(% of AGI for various income ranges: 69.5% for AGIs below $25k , 76.8% for AGIs $25k-50k , 71.6% for AGIs $50k-75k , 66.1% for AGIs $75k-100k , 69.7% for AGIs $100k-200k , 63.9% for AGIs over 200k ) Taxable interest for individuals: $486 (reported on 13.5% of returns )This zip code:
$486Michigan:
$1,491
(% of AGI for various income ranges: 0.4% for AGIs below $25k , 0.1% for AGIs $25k-50k , 0.2% for AGIs $50k-75k , 0.1% for AGIs $75k-100k , 0.1% for AGIs $100k-200k ) Ordinary dividends: $1,440 (reported on 5.5% of returns )(% of AGI for various income ranges: 0.3% for AGIs below $25k , 0.1% for AGIs $25k-50k , 0.2% for AGIs $50k-75k , 0.2% for AGIs $75k-100k , 0.5% for AGIs $100k-200k ) Profit/loss from business: +$5,239 (reported on 22.5% of returns )Here:
+$5,239State:
+$11,523
(% of AGI for various income ranges: 14.9% for AGIs below $25k , 0.3% for AGIs $50k-75k , 0.2% for AGIs $75k-100k , 1.1% for AGIs $100k-200k ) Taxable individual retirement arrangement distribution: $14,081 (reported on 5.2% of returns )48223:
$14,081Michigan:
$15,298
(% of AGI for various income ranges: 0.8% for AGIs below $25k , 1.2% for AGIs $25k-50k , 2.8% for AGIs $50k-75k , 3.5% for AGIs $75k-100k , 5.2% for AGIs $100k-200k ) Total itemized deductions: $16,821 (25% of AGI, reported on 21.6% of returns )Here:
$16,821State:
$21,628
Here:
24.9% of AGIState:
18.4% of AGI
(% of AGI for various income ranges: 4.8% for AGIs below $25k , 10.9% for AGIs $25k-50k , 15.2% for AGIs $50k-75k , 16.0% for AGIs $75k-100k , 16.0% for AGIs $100k-200k , 12.0% for AGIs over 200k ) Charity contributions: $4,651 (reported on 18.6% of returns )(% of AGI for various income ranges: 0.7% for AGIs below $25k , 2.5% for AGIs $25k-50k , 3.9% for AGIs $50k-75k , 4.0% for AGIs $75k-100k , 4.2% for AGIs $100k-200k , 1.9% for AGIs over 200k ) Taxes paid: $6,499 (reported on 21.6% of returns )(% of AGI for various income ranges: 1.3% for AGIs below $25k , 3.6% for AGIs $25k-50k , 5.9% for AGIs $50k-75k , 6.4% for AGIs $75k-100k , 7.3% for AGIs $100k-200k , 6.4% for AGIs over 200k ) Earned income credit: $2,933 (reported on 40.3% of returns )(% of AGI for various income ranges: 14.2% for AGIs below $25k , 1.4% for AGIs $25k-50k ) Percentage of individuals using paid preparers for their 2012 taxes: 55.9%(% for various income ranges: 55.4% for AGIs below $25k , 53.9% for AGIs $25k-50k , 57.1% for AGIs $50k-75k , 58.1% for AGIs $75k-100k , 65.9% for AGIs $100k-200k , 66.7% for AGIs over 200k )
Averages for the 2004 tax year for zip code 48223, filed in 2005:
Average Adjusted Gross Income (AGI) in 2004: $35,053 (Individual Income Tax Returns) Here:
$35,053State:
$48,204
Salary/wage: $33,447 (reported on 90.1% of returns )Here:
$33,447State:
$42,791
(% of AGI for various income ranges: 83.1% for AGIs below $10k , 81.8% for AGIs $10k-25k , 87.8% for AGIs $25k-50k , 88.3% for AGIs $50k-75k , 87.5% for AGIs $75k-100k , 83.1% for AGIs over 100k ) Taxable interest for individuals: $549 (reported on 23.0% of returns )This zip code:
$549Michigan:
$1,725
(% of AGI for various income ranges: 1.0% for AGIs below $10k , 0.5% for AGIs $10k-25k , 0.3% for AGIs $25k-50k , 0.3% for AGIs $50k-75k , 0.3% for AGIs $75k-100k , 0.3% for AGIs over 100k ) Taxable dividends: $1,125 (reported on 8.9% of returns )(% of AGI for various income ranges: 0.6% for AGIs below $10k , 0.2% for AGIs $10k-25k , 0.2% for AGIs $25k-50k , 0.3% for AGIs $50k-75k , 0.3% for AGIs $75k-100k , 0.4% for AGIs over 100k ) Net capital gain/loss: +$2,152 (reported on 5.1% of returns )Here:
+$2,152State:
+$8,532
(% of AGI for various income ranges: -0.5% for AGIs below $10k , 0.1% for AGIs $10k-25k , 0.1% for AGIs $25k-50k , 0.2% for AGIs $50k-75k , 0.2% for AGIs $75k-100k , 1.0% for AGIs over 100k ) Profit/loss from business: +$3,093 (reported on 12.3% of returns )Here:
+$3,093State:
+$9,547
(% of AGI for various income ranges: 13.3% for AGIs below $10k , 4.3% for AGIs $10k-25k , -0.0% for AGIs $25k-50k , 0.1% for AGIs $50k-75k , 0.1% for AGIs $75k-100k , 0.3% for AGIs over 100k ) IRA payment deduction: $1,667 (reported on 1.0% of returns )48223:
$1,667Michigan:
$2,875
(% of AGI for various income ranges: 0.1% for AGIs $10k-25k , 0.1% for AGIs $25k-50k , 0.1% for AGIs $50k-75k , 0.0% for AGIs over 100k ) Total itemized deductions: $17,080 (27% of AGI, reported on 36.8% of returns )Here:
$17,080State:
$18,509
Here:
27.3% of AGIState:
20.7% of AGI
(% of AGI for various income ranges: 8.2% for AGIs below $10k , 7.3% for AGIs $10k-25k , 17.0% for AGIs $25k-50k , 22.4% for AGIs $50k-75k , 21.9% for AGIs $75k-100k , 19.8% for AGIs over 100k ) Charity contributions deductions: $4,143 (6% of AGI, reported on 33.7% of returns )Here:
6.4% of AGIState:
3.6% of AGI
(% of AGI for various income ranges: 0.7% for AGIs below $10k , 1.2% for AGIs $10k-25k , 3.7% for AGIs $25k-50k , 5.0% for AGIs $50k-75k , 4.8% for AGIs $75k-100k , 4.9% for AGIs over 100k ) Total tax: $4,616 (reported on 63.0% of returns )(% of AGI for various income ranges: 2.9% for AGIs below $10k , 2.7% for AGIs $10k-25k , 5.5% for AGIs $25k-50k , 9.0% for AGIs $50k-75k , 10.4% for AGIs $75k-100k , 14.0% for AGIs over 100k ) Earned income credit: $2,144 (reported on 33.7% of returns )Percentage of individuals using paid preparers for their 2004 taxes: 66.0%(% for various income ranges: 64.0% for AGIs below $10k , 71.2% for AGIs $10k-25k , 64.3% for AGIs $25k-50k , 63.4% for AGIs $50k-75k , 63.6% for AGIs $75k-100k , 62.4% for AGIs over 100k )
Estimated median household income in 2022: This zip code:
$40,665Michigan:
$66,986
Nearest zip codes: 48219 ,
48239 ,
48228 ,
48227 ,
48235 ,
48240 .
Detroit Zip Code Map
Percentage of family households: This zip code:
42.7%Michigan:
43.3%
Percentage of households with unmarried partners: This zip code:
6.9%Michigan:
45.7%
No gay or lesbian households reported
Household received Food Stamps/SNAP in the past 12 months: 3,574Household did not receive Food Stamps/SNAP in the past 12 months: 6,384
Women who had a birth in the past 12 months: 476 (114 now married , 347 unmarried) Women who did not have a birth in the past 12 months: 6,440 (1,213 now married , 5,257 unmarried)
Housing units in zip code 48223 with a mortgage: 2,200 (142
second mortgage , 117
both second mortgage and home equity loan )
Houses without a mortgage: 60
Median monthly owner costs for units with a mortgage: $1,305
Median monthly owner costs for units without a mortgage: $529
Residents with income below the poverty level in 2022:
This zip code:
23.1%Whole state:
13.4%
Residents with income below 50% of the poverty level in 2022:
This zip code:
12.0%Whole state:
6.9%
Median number of rooms in houses and condos: Median number of rooms in apartments: Notable locations in this zip code not listed on our city pages
Click to draw/clear zip code borders Notable locations in zip code 48223: (A) , Detroit Far Northwest City Hall (B) . Display/hide their locations on the map
Shopping Center: (1) . Display/hide its location on the map
Churches in zip code 48223 include: (A) , Rosedale Park Baptist Church (B) , Joy Temple Church of God in Christ (C) , Leland Missionary Baptist Church (D) , More Excellent Way Cathedral Church of God (E) , Saint Paul Monastery (F) , Tabernacle of Faith Missionary Baptist Church (G) , EBER Memorial Baptist Church (H) , Greater Outreach Church of God in Christ (I) . Display/hide their locations on the map
Cemetery: (1) . Display/hide its location on the map
River: (A) . Display/hide its location on the map
Parks in zip code 48223 include: (1) , Eliza Howell Park (2) , Outer Drive Fullerton Park (3) , Riordan Playground (4) . Display/hide their locations on the map
Tourist attraction (not listed on the city page) :
Year house built (houses)
0 2020 or later74 2010 to 2019340 2000 to 2009264 1990 to 1999249 1980 to 1989392 1970 to 1979996 1960 to 19693,246 1950 to 19592,882 1940 to 19492,769 1939 or earlier
Zip code 48223 household income distribution in 2022 1,062 Less than $10,000676 $10,000 to $14,999545 $15,000 to $19,999577 $20,000 to $24,999468 $25,000 to $29,999776 $30,000 to $34,999709 $35,000 to $39,999429 $40,000 to $44,999434 $45,000 to $49,999860 $50,000 to $59,999647 $60,000 to $74,9991,136 $75,000 to $99,999731 $100,000 to $124,999431 $125,000 to $149,999269 $150,000 to $199,99993 $200,000 or moreEstimate of home value of owner-occupied houses/condos in 2022 in zip code 48223 142 Less than $10,000123 $10,000 to $14,999211 $15,000 to $19,999145 $20,000 to $24,99968 $25,000 to $29,999248 $30,000 to $34,99963 $35,000 to $39,999260 $40,000 to $49,999216 $50,000 to $59,999363 $60,000 to $69,999463 $70,000 to $79,999359 $80,000 to $89,999164 $90,000 to $99,999440 $100,000 to $124,999302 $125,000 to $149,999460 $150,000 to $174,999271 $175,000 to $199,999345 $200,000 to $249,999191 $250,000 to $299,99961 $300,000 to $399,99930 $400,000 to $499,99910 $1,500,000 to $1,999,999Rent paid by renters in 2022 in zip code 48223 39 Less than $10025 $100 to $14961 $150 to $19921 $200 to $24957 $250 to $29952 $300 to $34917 $350 to $39939 $400 to $44997 $450 to $499215 $500 to $549344 $550 to $599434 $600 to $649148 $650 to $699363 $700 to $749340 $750 to $799429 $800 to $899428 $900 to $999358 $1,000 to $1,249191 $1,250 to $1,499116 $1,500 to $1,999365 No cash rent
Median gross rent in 2022: $986.
Estimated median house (or condo) value in 2022 for: White Non-Hispanic householders: $54,285Black or African American householders: $101,827American Indian or Alaska Native householders: $157,141Asian householders: $95,542Some other race householders: $98,742Two or more races householders: $60,228Hispanic or Latino householders: $31,999Estimated median house or condo value in 2022: $94,514
48223:
$94,514Michigan:
$224,400
Lower value quartile - upper value quartile: $52,742 - $168,827
Mean price in 2022: Detached houses: $113,289Here:
$113,289State:
$280,038
Townhouses or other attached units: $167,441Here:
$167,441State:
$239,520
In 2-unit structures: $91,488Here:
$91,488State:
$219,481
In 3-to-4-unit structures: $135,167Here:
$135,167State:
$207,067
In 5-or-more-unit structures: $233,646Here:
$233,646State:
$192,733
Mobile homes: $46,622Here:
$46,622State:
$72,868
Housing units in structures:
One, detached: 8,944One, attached: 541Two: 3053 or 4: 2515 to 9: 30310 to 19: 22320 to 49: 33950 or more: 468Mobile homes: 55Unemployment : 10.3%
Means of transportation to work in zip code 48223 64.5% 6,264 Drove a car alone13.0% 1,260 Carpooled2.6% 257 Bus or trolley bus1.0% 93 Taxi1.2% 117 Walked4.6% 443 Other means13.5% 1,314 Worked at homeTravel time to work (commute) in zip code 48223 28 Less than 5 minutes434 5 to 9 minutes858 10 to 14 minutes1,336 15 to 19 minutes2,188 20 to 24 minutes567 25 to 29 minutes1,669 30 to 34 minutes128 35 to 39 minutes173 40 to 44 minutes411 45 to 59 minutes352 60 to 89 minutes250 90 or more minutes
Neighborhoods in zip code 48223: Percentage of zip code residents living and working in this county: 74.0%
Household type by relationship:
Households: 25,686
Male householders: 4,017 (1,724 living alone ), Female householders: 5,796 (1,694 living alone )2,460 spouses (2,399 opposite-sex spouses ), 786 unmarried partners , (773 opposite-sex unmarried partners ), 9,406 children (8,835 natural , 153 adopted , 421 stepchildren ), 1,282 grandchildren , 495 brothers or sisters , 230 parents , 28 foster children , 492 other relatives , 612 non-relatives In group quarters: 35 (-1 institutionalized population )
Size of family households: 2,406 2-persons , 1,431 3-persons , 949 4-persons , 506 5-persons , 383 6-persons , 163 7-or-more-persons
Size of nonfamily households: 3,416 1-person , 459 2-persons , 59 3-persons
1,805 married couples with children. single-parent households (547 men , 3,194 women ).
96.5% of residents of 48223 zip code speak English at home. of residents speak Spanish at home (69% very well, 13% well, 19% not well ).of residents speak other Indo-European language at home (86% very well, 14% well ).of residents speak Asian or Pacific Island language at home (14% well, 86% not well ).of residents speak other language at home (100% very well ).
Foreign born population: 256 (1.0%)
(60.2%
of them are naturalized citizens )
This zip code:
1.0%Whole state:
6.9%
32% Haiti 12% Grenada 9% Chile 8% Australia 7% Ethiopia 4% France 4% El Salvador 4% American 2% African 1% Italian 1% Irish 0% Jamaican 0% Moroccan 0% German
Year of entry for the foreign-born population
107 2010 or later 47 2000 to 2009 47 1990 to 1999 114 Before 1990
There are
49 Medical Specialists in Zip Code 48223 .
Major facilities with environmental interests located in this zip code:
GOMPERS ELEMENTARY SCHOOL (20601 W. DAVISON STREET in DETROIT, MI)
(National Center for Education Statistics) - STATE ID-01438 Conditionally Exempt Small Quantity Generators, less than 100 kg/month of hazardous waste (Resource Conservation and Recovery Act (tracking hazardous waste)) Organizations: DETROIT PUBLIC SCHOOLS (CONTACT/OPERATOR)
, DETROIT CITY SCHOOL DISTRICT (SCHOOL DISTRICT)
Alternative names: GOMPERS ELEM SCHOOL
FARWEST EARLY CHILDHOOD CENTER (13550 VIRGIL in DETROIT, MI)
(National Center for Education Statistics) - STATE ID-08985 Organizations: DETROIT CITY SCHOOL DISTRICT (SCHOOL DISTRICT)
ALLEN ACADEMY (14595 HEYDEN in DETROIT, MI)
(National Center for Education Statistics) - STATE ID-08724
FAR WEST ALTERNATIVE EDUCATION (15320 LAMPHERE AVENUE in DETROIT, MI)
(National Center for Education Statistics) - STATE ID-08926 Organizations: DETROIT CITY SCHOOL DISTRICT (SCHOOL DISTRICT)
ALCOA CO (12727 WESTWOOD AVE in DETROIT, MI)
(Resource Conservation and Recovery Act (tracking hazardous waste)) TRI REPORTER (Tracking of toxic chemicals releasing facilities) Business SIC classification: CHEMICALS AND CHEMICAL PREPARATIONSOrganizations: ALCOA COMPANY (CONTACT/OPERATOR)
Alternative names: ALDOA CO.
MI DEPT/TRANSPORTATION BRIDGE (I-96 UNDER BURT RD in DETROIT, MI)
(Resource Conservation and Recovery Act (tracking hazardous waste)) Organizations: MICH DEPT OF TRANSPORTATION (CONTACT/OPERATOR)
Alternative names: MIDOT BRIDGE I-96 UNDER BURT RD
MI DEPT/TRANSPORTATION BRIDGE (M-39 & I-96 INTERCHANGE in DETROIT, MI)
(Resource Conservation and Recovery Act (tracking hazardous waste)) Organizations: MICH DEPT OF TRANSPORTATION (CONTACT/OPERATOR)
Alternative names: MIDOT BRIDGE I-96 & M-39
AMOCO OIL CO 7229 (19111 GRAND RIVER AVE in DETROIT, MI)
(Resource Conservation and Recovery Act (tracking hazardous waste)) Organizations: AMOCO OIL COMPANY (CONTACT/OWNER)
ANSON MOLD INC (15526 DALE in DETROIT, MI)
(Resource Conservation and Recovery Act (tracking hazardous waste)) Organizations: ANSON C JOHN (CONTACT/OWNER)
MI DEPT/TRANSPORTATION BRIDGE (M-39 OVER PURITAN in DETROIT, MI)
(Resource Conservation and Recovery Act (tracking hazardous waste)) Organizations: MICH DEPT OF TRANSPORTATION (CONTACT/OPERATOR)
Alternative names: MIDOT BRIDGE M-39 OVER PURITAN AVE
MI DEPT/TRANSPORTATION BRIDGE (I-96 UNDER EVERGREEN in DETROIT, MI)
(Resource Conservation and Recovery Act (tracking hazardous waste)) Organizations: MICH DEPT OF TRANSPORTATION (CONTACT/OPERATOR)
Alternative names: MIDOT BRIDGE I-96 UNDER EVERGREEN
Housing units lacking complete plumbing facilities: 6.9%
Housing units lacking complete kitchen facilities: 8.6%
86.5% Utility gas 10.5% Electricity 1.2% Bottled, tank, or LP gas 1.0% No fuel used 0.5% Other fuel
Population in 1990: 39,612.
Place of birth for U.S.-born residents:
This state: 21,305Northeast: 397Midwest: 610South: 2,742West: 244
56% of the 48223 zip code residents lived in the same house 5 years ago.
Out of people who lived in different houses, 85% lived in this county.
Out of people who lived in different counties, 50% lived in Michigan.
90% of the 48223 zip code residents lived in the same house 1 year ago.
Out of people who lived in different houses, 71% moved from this county.
Out of people who lived in different houses, 18% moved from different county within same state.
Out of people who lived in different houses, 5% moved from different state.
Out of people who lived in different houses, 3% moved from abroad.
Private vs. public school enrollment:
Students in private schools in grades 1 to 8 (elementary and middle school): 268
Students in private schools in grades 9 to 12 (high school): 74
Students in private undergraduate colleges: 284
Occupation by median earnings in the past 12 months ($)
69,742 Law enforcement workers including supervisors 67,772 Legal occupations 66,575 Health diagnosing and treating practitioners and other technical occupations 65,819 Architecture and engineering occupations 57,378 Computer and mathematical occupations 54,623 Management occupations
Companies with federal contracts located in this zip code:
DETROIT GAUGE & TOOL COMPANY (12910 WESTWOOD AVENUE in DETROIT, MI; small business)
$56,000 with Air Force for Torque Converters and Speed Changers. Signed on 2001-09-28. Completion date: 2001-12-31.
KOLENE CORPORATION (12890 WESTWOOD AVENUE in DETROIT, MI; small business) in 3 contracts from 2004 to 2006
$3,600 with Air Force for Miscellaneous Chemical Specialties. Signed on 2004-12-16. Completion date: 2005-01-02.
with Air Force for Maintenance, Repair and Rebuilding of Equipment -- Maintenance and Repair Shop Equipment. Taking place in OK. Signed on 2006-03-23. Completion date: 2006-04-07.
with Air Force for Maintenance, Repair and Rebuilding of Equipment -- Miscellaneous. Taking place in OK. Signed on 2005-06-14. Completion date: 2003-07-31.
Top industries in this zip code by the number of employees in 2005:
Administrative and Support and Waste Management and Remediation Services: Temporary Help Services (over 1000 employees: 1 establishment, 20-49 employees: 1 establishment)Accommodation and Food Services: Limited-Service Restaurants (50-99: 1, 20-49: 3, 10-19: 1, 5-9: 1, 1-4: 7)Health Care and Social Assistance: Child Day Care Services (100-249: 1, 10-19: 1, 5-9: 1, 1-4: 1)Construction: Painting and Wall Covering Contractors (20-49: 3, 1-4: 1)Wholesale Trade: Other Chemical and Allied Products Merchant Wholesalers (20-49: 3)Other Services (except Public Administration): Religious Organizations (20-49: 1, 10-19: 2, 5-9: 2, 1-4: 8)
People in group quarters in 2010:
43 people in other noninstitutional facilities
29 people in group homes intended for adults
People in group quarters in 2000:
205 people in other noninstitutional group quarters
37 people in homes for the mentally ill
10 people in religious group quarters
6 people in homes or halfway houses for drug/alcohol abuse
5 people in homes for the mentally retarded
Fatal accident statistics in 2014:
Fatal accident count: 3Vehicles involved in fatal accidents: 4Fatal accidents caused by drunken drivers: 2Fatalities: 3Persons involved in fatal accidents: 5Pedestrians involved in fatal accidents: 1
Fatal accident statistics in 2013:
Fatal accident count: 2Vehicles involved in fatal accidents: 2Fatal accidents caused by drunken drivers: 0Fatalities: 2Persons involved in fatal accidents: 3Pedestrians involved in fatal accidents: 1
Home Mortgage Disclosure Act Aggregated Statistics For Year 2009(Based on 16 full and 6 partial tracts) A) FHA, FSA/RHS & VA B) Conventional C) Refinancings D) Home Improvement Loans E) Loans on Dwellings For 5+ Families F) Non-occupant Loans on Number Average Value Number Average Value Number Average Value Number Average Value Number Average Value Number Average Value
LOANS ORIGINATED 30 $61,907 21 $45,721 93 $73,679 18 $16,333 1 $94,000 40 $37,344 APPLICATIONS APPROVED, NOT ACCEPTED 11 $58,182 15 $79,417 26 $84,224 5 $10,788 0 $0 7 $66,523 APPLICATIONS DENIED 45 $62,574 50 $54,346 136 $82,880 86 $17,367 2 $248,825 32 $50,145 APPLICATIONS WITHDRAWN 30 $59,640 10 $56,408 41 $74,115 8 $47,160 0 $0 11 $51,889 FILES CLOSED FOR INCOMPLETENESS 6 $53,237 4 $58,975 12 $104,561 0 $0 0 $0 0 $0
Aggregated Statistics For Year 2008(Based on 16 full and 6 partial tracts) A) FHA, FSA/RHS & VA B) Conventional C) Refinancings D) Home Improvement Loans F) Non-occupant Loans on G) Loans On Manufactured Number Average Value Number Average Value Number Average Value Number Average Value Number Average Value Number Average Value
LOANS ORIGINATED 60 $70,591 85 $65,638 140 $98,311 29 $24,773 83 $57,880 0 $0 APPLICATIONS APPROVED, NOT ACCEPTED 5 $98,000 28 $78,779 41 $102,045 14 $16,377 20 $59,054 0 $0 APPLICATIONS DENIED 54 $75,754 152 $79,224 422 $95,964 163 $33,854 116 $64,336 1 $49,660 APPLICATIONS WITHDRAWN 13 $79,098 26 $67,504 104 $91,406 9 $66,797 17 $61,947 0 $0 FILES CLOSED FOR INCOMPLETENESS 3 $121,240 22 $88,416 23 $72,013 5 $34,000 14 $75,887 0 $0
Aggregated Statistics For Year 2007(Based on 16 full and 6 partial tracts) A) FHA, FSA/RHS & VA B) Conventional C) Refinancings D) Home Improvement Loans F) Non-occupant Loans on G) Loans On Manufactured Number Average Value Number Average Value Number Average Value Number Average Value Number Average Value Number Average Value
LOANS ORIGINATED 13 $82,868 393 $81,585 458 $85,694 87 $51,308 275 $65,750 0 $0 APPLICATIONS APPROVED, NOT ACCEPTED 2 $113,520 139 $85,109 210 $88,739 13 $91,451 70 $76,938 0 $0 APPLICATIONS DENIED 7 $91,180 614 $84,078 1,187 $95,764 226 $38,659 380 $74,223 4 $58,745 APPLICATIONS WITHDRAWN 10 $83,075 85 $87,245 250 $106,986 22 $95,492 53 $71,540 0 $0 FILES CLOSED FOR INCOMPLETENESS 2 $189,020 43 $88,323 120 $101,851 4 $19,292 28 $71,896 0 $0
Aggregated Statistics For Year 2006(Based on 16 full and 6 partial tracts) A) FHA, FSA/RHS & VA B) Conventional C) Refinancings D) Home Improvement Loans E) Loans on Dwellings For 5+ Families F) Non-occupant Loans on G) Loans On Manufactured Number Average Value Number Average Value Number Average Value Number Average Value Number Average Value Number Average Value Number Average Value
LOANS ORIGINATED 36 $96,352 950 $75,301 943 $85,690 101 $40,048 5 $1,796,296 532 $63,609 0 $0 APPLICATIONS APPROVED, NOT ACCEPTED 7 $108,936 327 $79,560 427 $89,935 31 $53,737 0 $0 162 $70,557 1 $34,000 APPLICATIONS DENIED 11 $111,502 1,021 $77,692 1,672 $96,577 309 $34,918 3 $850,750 530 $68,305 7 $120,289 APPLICATIONS WITHDRAWN 8 $99,120 276 $74,947 640 $97,082 31 $67,845 0 $0 173 $68,793 0 $0 FILES CLOSED FOR INCOMPLETENESS 0 $0 85 $81,830 230 $108,659 0 $0 0 $0 35 $65,631 0 $0
Aggregated Statistics For Year 2005(Based on 16 full and 6 partial tracts) A) FHA, FSA/RHS & VA B) Conventional C) Refinancings D) Home Improvement Loans E) Loans on Dwellings For 5+ Families F) Non-occupant Loans on G) Loans On Manufactured Number Average Value Number Average Value Number Average Value Number Average Value Number Average Value Number Average Value Number Average Value
LOANS ORIGINATED 81 $93,076 973 $74,303 1,341 $89,336 129 $55,812 8 $515,468 593 $63,227 0 $0 APPLICATIONS APPROVED, NOT ACCEPTED 9 $91,952 339 $74,653 431 $89,075 25 $49,160 0 $0 145 $65,517 2 $60,610 APPLICATIONS DENIED 21 $101,690 812 $76,686 1,990 $93,459 230 $44,879 0 $0 485 $65,562 7 $38,979 APPLICATIONS WITHDRAWN 26 $99,704 407 $88,278 963 $104,535 105 $162,740 0 $0 183 $68,630 0 $0 FILES CLOSED FOR INCOMPLETENESS 2 $115,455 74 $77,777 341 $96,565 3 $91,267 0 $0 38 $62,860 0 $0
Aggregated Statistics For Year 2004(Based on 16 full and 6 partial tracts) A) FHA, FSA/RHS & VA B) Conventional C) Refinancings D) Home Improvement Loans E) Loans on Dwellings For 5+ Families F) Non-occupant Loans on G) Loans On Manufactured Number Average Value Number Average Value Number Average Value Number Average Value Number Average Value Number Average Value Number Average Value
LOANS ORIGINATED 120 $94,936 723 $77,422 1,551 $88,374 123 $46,185 5 $2,764,160 511 $63,158 4 $103,980 APPLICATIONS APPROVED, NOT ACCEPTED 8 $86,025 344 $77,584 625 $86,750 34 $48,574 0 $0 228 $63,061 2 $89,500 APPLICATIONS DENIED 28 $87,268 531 $75,319 1,616 $85,487 222 $28,219 2 $1,115,295 372 $59,807 6 $28,667 APPLICATIONS WITHDRAWN 10 $102,416 100 $92,389 731 $97,919 33 $51,132 0 $0 99 $73,528 0 $0 FILES CLOSED FOR INCOMPLETENESS 6 $79,033 45 $92,379 200 $88,349 3 $69,823 0 $0 39 $70,386 0 $0
Aggregated Statistics For Year 2003(Based on 16 full and 6 partial tracts) A) FHA, FSA/RHS & VA B) Conventional C) Refinancings D) Home Improvement Loans E) Loans on Dwellings For 5+ Families F) Non-occupant Loans on Number Average Value Number Average Value Number Average Value Number Average Value Number Average Value Number Average Value
LOANS ORIGINATED 110 $96,998 445 $79,349 1,940 $85,937 135 $14,087 2 $754,815 317 $55,750 APPLICATIONS APPROVED, NOT ACCEPTED 12 $84,182 194 $78,387 507 $89,557 40 $20,500 0 $0 112 $61,933 APPLICATIONS DENIED 44 $101,023 360 $71,511 1,522 $83,728 280 $12,815 0 $0 266 $59,171 APPLICATIONS WITHDRAWN 17 $83,642 98 $81,661 688 $90,688 11 $55,635 0 $0 80 $58,857 FILES CLOSED FOR INCOMPLETENESS 12 $72,303 22 $105,584 160 $90,886 6 $30,752 2 $704,030 15 $75,565
Aggregated Statistics For Year 2002(Based on 16 full and 6 partial tracts) A) FHA, FSA/RHS & VA B) Conventional C) Refinancings D) Home Improvement Loans E) Loans on Dwellings For 5+ Families F) Non-occupant Loans on Number Average Value Number Average Value Number Average Value Number Average Value Number Average Value Number Average Value
LOANS ORIGINATED 199 $90,138 428 $78,730 1,645 $83,814 170 $13,472 1 $325,000 268 $52,247 APPLICATIONS APPROVED, NOT ACCEPTED 4 $69,280 118 $75,232 472 $84,171 51 $16,691 0 $0 62 $52,865 APPLICATIONS DENIED 40 $94,146 253 $68,164 1,349 $73,240 351 $13,938 0 $0 196 $48,809 APPLICATIONS WITHDRAWN 18 $107,630 103 $70,703 674 $82,569 20 $33,116 0 $0 70 $53,282 FILES CLOSED FOR INCOMPLETENESS 10 $60,646 40 $86,346 196 $86,486 3 $9,987 0 $0 17 $52,468
Aggregated Statistics For Year 2001(Based on 16 full and 6 partial tracts) A) FHA, FSA/RHS & VA B) Conventional C) Refinancings D) Home Improvement Loans E) Loans on Dwellings For 5+ Families F) Non-occupant Loans on Number Average Value Number Average Value Number Average Value Number Average Value Number Average Value Number Average Value
LOANS ORIGINATED 232 $88,998 343 $69,723 1,733 $77,781 222 $17,112 8 $958,255 256 $48,245 APPLICATIONS APPROVED, NOT ACCEPTED 13 $80,982 89 $71,027 437 $73,308 92 $14,337 1 $150,000 55 $43,190 APPLICATIONS DENIED 64 $82,869 285 $74,528 1,632 $69,816 597 $11,777 0 $0 156 $45,818 APPLICATIONS WITHDRAWN 43 $86,411 106 $75,572 679 $70,371 38 $19,964 2 $1,990,600 39 $41,797 FILES CLOSED FOR INCOMPLETENESS 9 $84,124 11 $96,124 186 $77,179 8 $23,172 0 $0 14 $47,467
Aggregated Statistics For Year 2000(Based on 16 full and 6 partial tracts) A) FHA, FSA/RHS & VA B) Conventional C) Refinancings D) Home Improvement Loans E) Loans on Dwellings For 5+ Families F) Non-occupant Loans on Number Average Value Number Average Value Number Average Value Number Average Value Number Average Value Number Average Value
LOANS ORIGINATED 234 $82,367 304 $70,045 1,183 $66,720 256 $12,520 2 $144,000 186 $37,960 APPLICATIONS APPROVED, NOT ACCEPTED 14 $80,056 70 $70,029 391 $70,952 143 $20,649 0 $0 45 $46,124 APPLICATIONS DENIED 58 $85,085 268 $66,373 1,231 $62,164 597 $12,598 1 $1,064,070 181 $42,284 APPLICATIONS WITHDRAWN 36 $72,334 100 $64,952 581 $62,869 44 $31,198 0 $0 49 $37,841 FILES CLOSED FOR INCOMPLETENESS 6 $80,182 11 $71,665 155 $63,739 3 $13,010 0 $0 13 $42,298
Aggregated Statistics For Year 1999(Based on 11 full and 3 partial tracts) A) FHA, FSA/RHS & VA B) Conventional C) Refinancings D) Home Improvement Loans E) Loans on Dwellings For 5+ Families F) Non-occupant Loans on Number Average Value Number Average Value Number Average Value Number Average Value Number Average Value Number Average Value
LOANS ORIGINATED 183 $78,592 159 $75,390 1,108 $64,397 198 $14,474 1 $775,770 119 $37,446 APPLICATIONS APPROVED, NOT ACCEPTED 11 $85,900 34 $74,448 398 $65,329 89 $14,242 0 $0 58 $41,352 APPLICATIONS DENIED 25 $76,679 89 $58,515 815 $57,876 370 $11,416 0 $0 88 $34,946 APPLICATIONS WITHDRAWN 26 $84,699 55 $51,210 537 $61,459 24 $26,474 0 $0 39 $35,916 FILES CLOSED FOR INCOMPLETENESS 4 $61,670 12 $83,182 166 $64,977 1 $42,590 0 $0 8 $40,831
Private Mortgage Insurance Companies Aggregated Statistics For Year 2009(Based on 6 full and 2 partial tracts) A) Conventional B) Refinancings Number Average Value Number Average Value
LOANS ORIGINATED 1 $117,000 0 $0 APPLICATIONS APPROVED, NOT ACCEPTED 5 $67,676 1 $80,000 APPLICATIONS DENIED 0 $0 0 $0 APPLICATIONS WITHDRAWN 1 $126,620 0 $0 FILES CLOSED FOR INCOMPLETENESS 0 $0 0 $0
Aggregated Statistics For Year 2008(Based on 14 full and 6 partial tracts) A) Conventional B) Refinancings C) Non-occupant Loans on Number Average Value Number Average Value Number Average Value
LOANS ORIGINATED 51 $81,714 12 $87,480 17 $64,271 APPLICATIONS APPROVED, NOT ACCEPTED 74 $85,802 33 $109,859 9 $79,019 APPLICATIONS DENIED 15 $92,205 1 $54,000 3 $98,333 APPLICATIONS WITHDRAWN 15 $101,143 0 $0 0 $0 FILES CLOSED FOR INCOMPLETENESS 5 $85,208 0 $0 3 $66,403
Aggregated Statistics For Year 2007(Based on 16 full and 6 partial tracts) A) Conventional B) Refinancings C) Non-occupant Loans on Number Average Value Number Average Value Number Average Value
LOANS ORIGINATED 176 $92,860 62 $106,228 52 $79,141 APPLICATIONS APPROVED, NOT ACCEPTED 41 $91,818 21 $93,077 13 $72,900 APPLICATIONS DENIED 12 $92,079 6 $71,557 7 $70,049 APPLICATIONS WITHDRAWN 17 $97,521 3 $102,183 4 $72,990 FILES CLOSED FOR INCOMPLETENESS 0 $0 2 $117,185 0 $0
Aggregated Statistics For Year 2006(Based on 16 full and 6 partial tracts) A) Conventional B) Refinancings C) Non-occupant Loans on Number Average Value Number Average Value Number Average Value
LOANS ORIGINATED 83 $86,907 57 $104,743 39 $71,139 APPLICATIONS APPROVED, NOT ACCEPTED 16 $82,874 22 $94,542 4 $55,145 APPLICATIONS DENIED 4 $65,670 2 $80,000 2 $80,000 APPLICATIONS WITHDRAWN 3 $79,333 7 $80,880 2 $55,000 FILES CLOSED FOR INCOMPLETENESS 0 $0 0 $0 0 $0
Aggregated Statistics For Year 2005(Based on 16 full and 6 partial tracts) A) Conventional B) Refinancings C) Non-occupant Loans on Number Average Value Number Average Value Number Average Value
LOANS ORIGINATED 65 $96,282 62 $124,174 31 $60,309 APPLICATIONS APPROVED, NOT ACCEPTED 23 $80,664 38 $113,710 12 $55,635 APPLICATIONS DENIED 4 $46,675 2 $152,000 2 $53,625 APPLICATIONS WITHDRAWN 8 $121,384 4 $176,792 4 $118,712 FILES CLOSED FOR INCOMPLETENESS 0 $0 0 $0 0 $0
Aggregated Statistics For Year 2004(Based on 16 full and 6 partial tracts) A) Conventional B) Refinancings C) Non-occupant Loans on Number Average Value Number Average Value Number Average Value
LOANS ORIGINATED 113 $84,762 72 $118,416 53 $58,041 APPLICATIONS APPROVED, NOT ACCEPTED 40 $88,220 45 $111,540 21 $65,268 APPLICATIONS DENIED 5 $69,362 4 $129,035 4 $51,202 APPLICATIONS WITHDRAWN 10 $106,389 13 $127,098 4 $60,120 FILES CLOSED FOR INCOMPLETENESS 9 $99,830 1 $67,900 1 $67,900
Aggregated Statistics For Year 2003(Based on 16 full and 6 partial tracts) A) Conventional B) Refinancings C) Non-occupant Loans on Number Average Value Number Average Value Number Average Value
LOANS ORIGINATED 132 $91,410 160 $110,015 41 $63,450 APPLICATIONS APPROVED, NOT ACCEPTED 21 $87,987 53 $121,986 5 $39,378 APPLICATIONS DENIED 5 $69,362 6 $80,578 6 $63,440 APPLICATIONS WITHDRAWN 2 $81,000 21 $120,322 3 $128,707 FILES CLOSED FOR INCOMPLETENESS 1 $133,000 0 $0 0 $0
Aggregated Statistics For Year 2002(Based on 16 full and 6 partial tracts) A) Conventional B) Refinancings C) Non-occupant Loans on Number Average Value Number Average Value Number Average Value
LOANS ORIGINATED 143 $85,184 137 $111,581 46 $58,329 APPLICATIONS APPROVED, NOT ACCEPTED 50 $87,481 68 $119,944 16 $58,051 APPLICATIONS DENIED 11 $81,958 13 $117,176 8 $55,711 APPLICATIONS WITHDRAWN 26 $68,175 21 $89,841 22 $63,446 FILES CLOSED FOR INCOMPLETENESS 4 $59,750 2 $144,000 4 $59,750
Aggregated Statistics For Year 2001(Based on 16 full and 6 partial tracts) A) Conventional B) Refinancings C) Non-occupant Loans on Number Average Value Number Average Value Number Average Value
LOANS ORIGINATED 110 $85,160 149 $103,887 30 $55,049 APPLICATIONS APPROVED, NOT ACCEPTED 25 $68,310 39 $113,284 13 $54,340 APPLICATIONS DENIED 5 $81,720 17 $82,532 3 $69,147 APPLICATIONS WITHDRAWN 4 $117,500 10 $123,860 1 $40,000 FILES CLOSED FOR INCOMPLETENESS 0 $0 1 $38,000 1 $38,000
Aggregated Statistics For Year 2000(Based on 16 full and 6 partial tracts) A) Conventional B) Refinancings C) Non-occupant Loans on Number Average Value Number Average Value Number Average Value
LOANS ORIGINATED 106 $83,410 134 $66,607 38 $42,359 APPLICATIONS APPROVED, NOT ACCEPTED 15 $85,456 23 $81,561 4 $64,635 APPLICATIONS DENIED 5 $92,278 7 $114,544 0 $0 APPLICATIONS WITHDRAWN 3 $59,303 3 $55,593 3 $59,303 FILES CLOSED FOR INCOMPLETENESS 0 $0 0 $0 0 $0
Aggregated Statistics For Year 1999(Based on 9 full and 3 partial tracts) A) Conventional B) Refinancings C) Non-occupant Loans on Number Average Value Number Average Value Number Average Value
LOANS ORIGINATED 50 $97,510 42 $86,717 5 $37,922 APPLICATIONS APPROVED, NOT ACCEPTED 3 $104,893 9 $86,143 1 $64,480 APPLICATIONS DENIED 4 $64,073 7 $93,140 1 $44,990 APPLICATIONS WITHDRAWN 0 $0 0 $0 0 $0 FILES CLOSED FOR INCOMPLETENESS 0 $0 0 $0 0 $0
2002 - 2018 National Fire Incident Reporting System (NFIRS) incidents See full 2006 National Fire Incident Reporting System statistics for zip code 48223, Michigan
Most common first names in zip code 48223 among deceased individuals Name Count Lived (average)
John 312 73.1 years William 269 72.0 years Mary 234 76.1 years James 220 70.4 years George 168 72.3 years Charles 160 71.3 years Robert 146 66.8 years Joseph 132 73.2 years Edward 113 71.0 years Margaret 107 77.0 years
Most common last names in zip code 48223 among deceased individuals Last name Count Lived (average)
Smith 120 72.1 years Johnson 91 68.7 years Williams 67 65.3 years Jones 66 70.5 years Brown 64 67.1 years Davis 47 66.7 years Wilson 46 73.7 years White 46 69.7 years Miller 45 68.9 years Jackson 39 76.9 years
Businesses in zip code 48223
Name Count Name Count
AutoZone 1 Little Caesars Pizza 1 Blockbuster 1 McDonald's 1 CVS 1 Rite Aid 1 GNC 1 U-Haul 1 GameStop 1 UPS 1
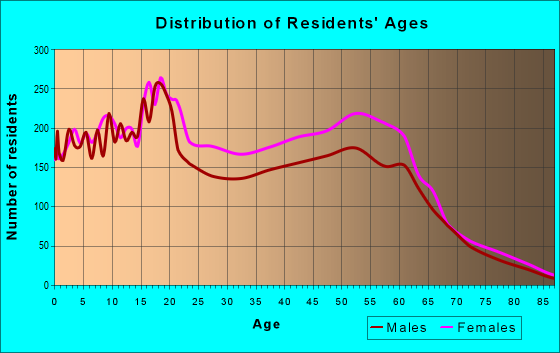
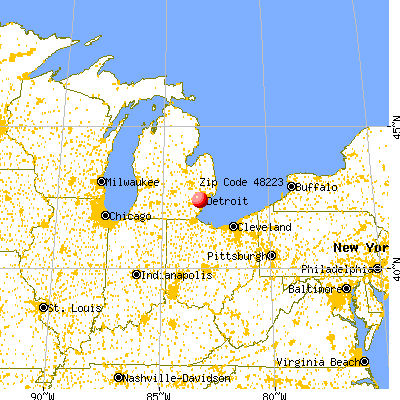


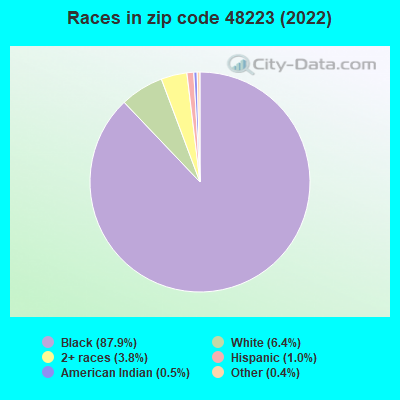


 Nearest zip codes: 48219, 48239, 48228, 48227, 48235, 48240.
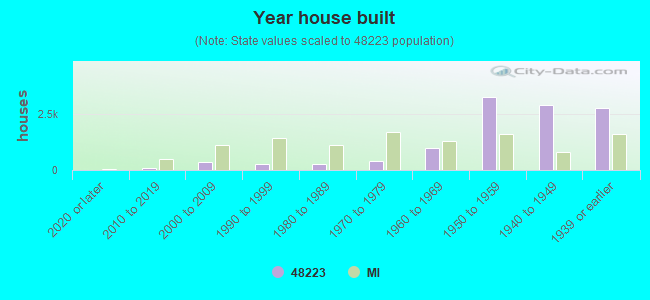

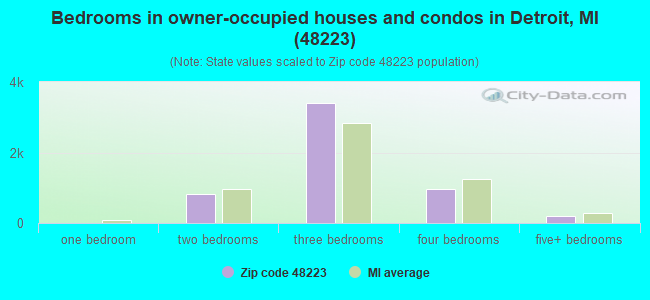
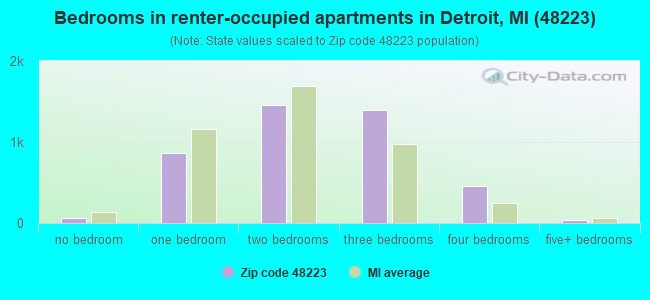
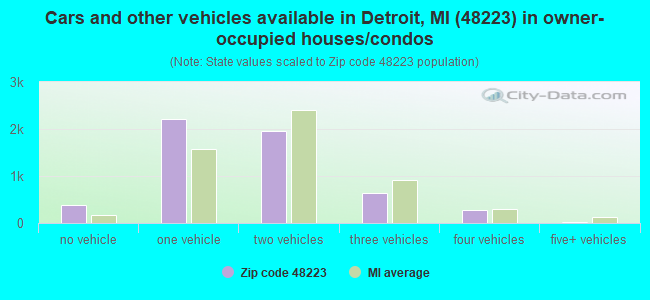
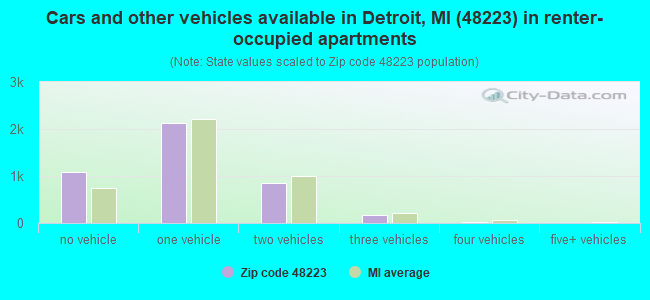


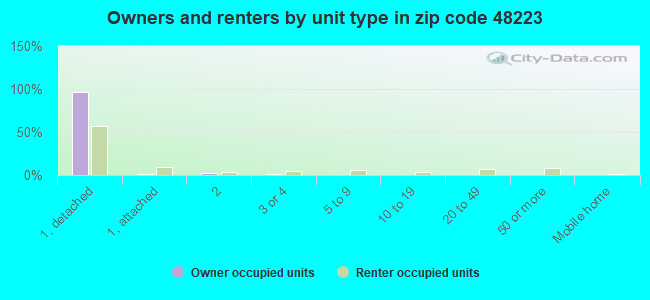
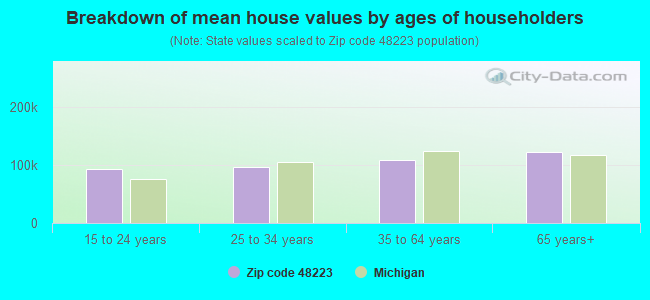


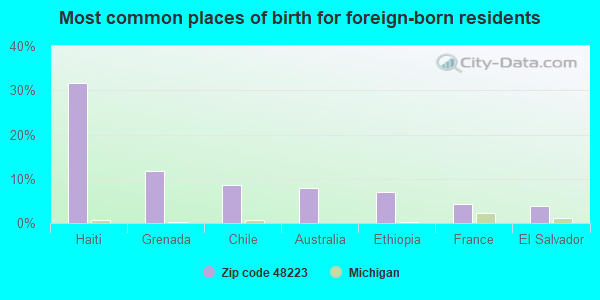
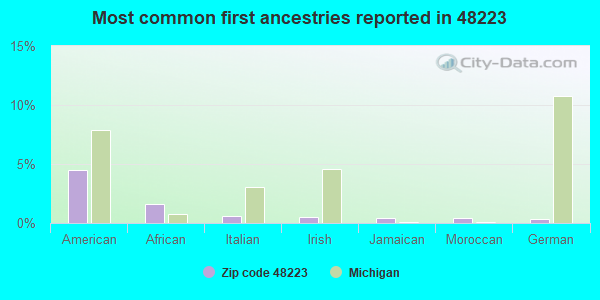
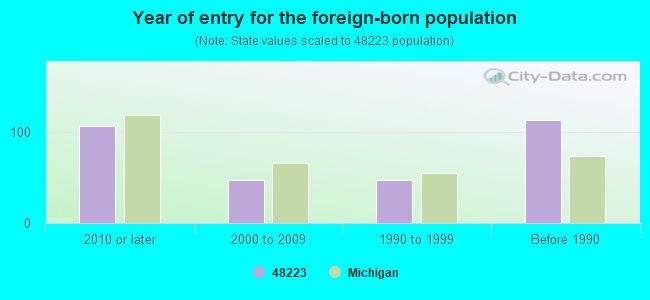


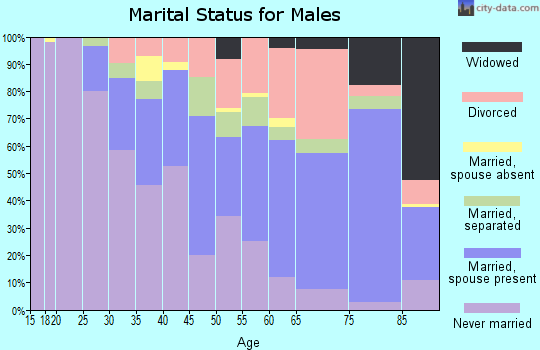
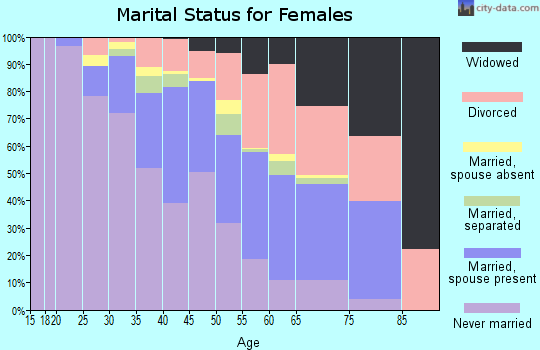
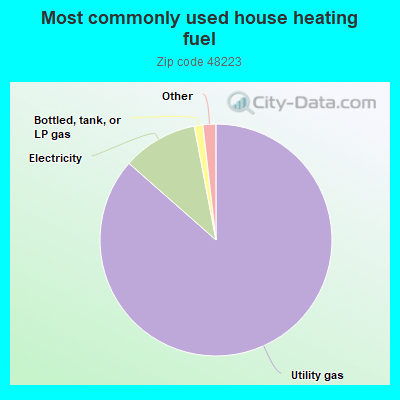
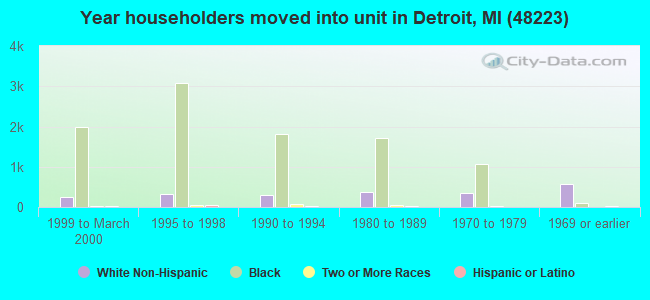
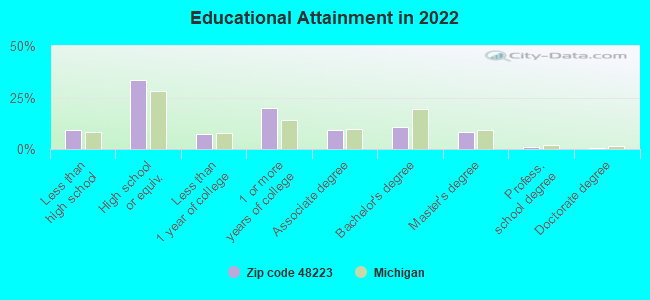
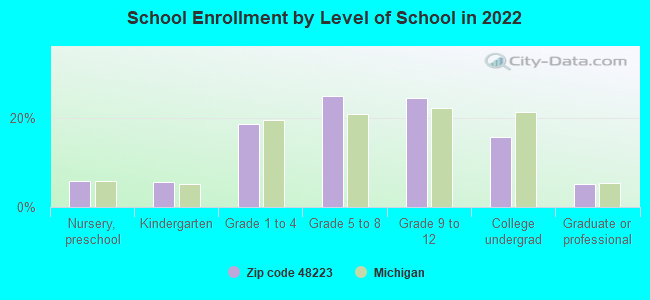
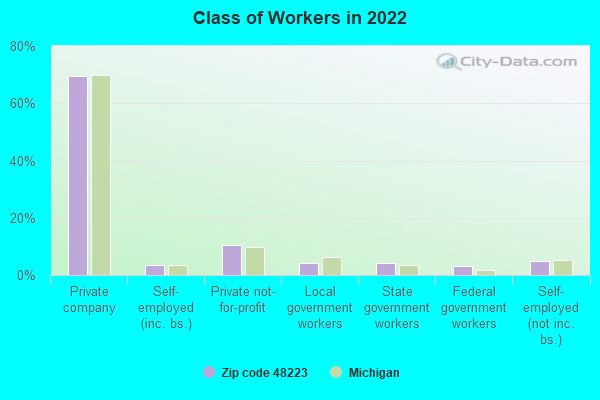
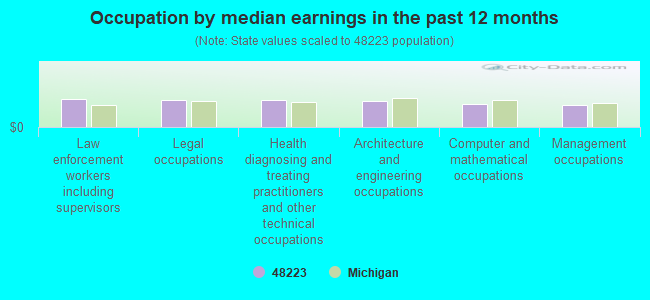
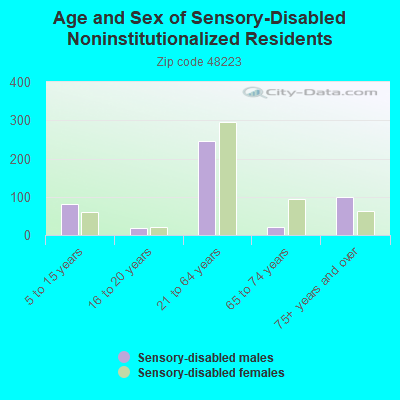
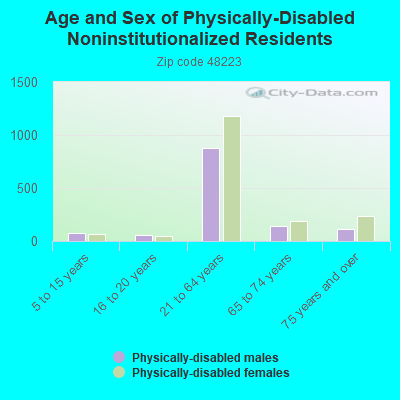
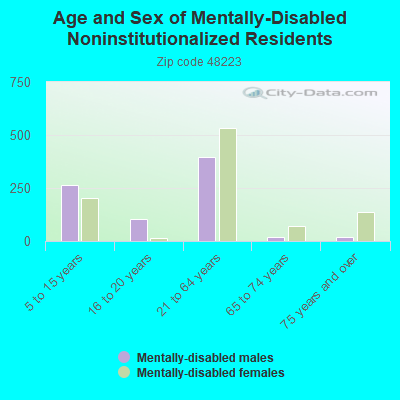
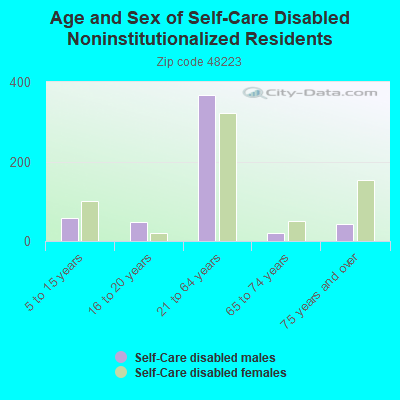
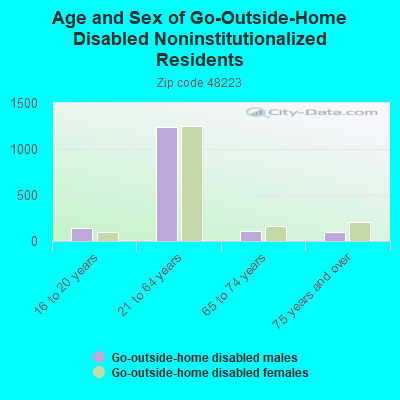
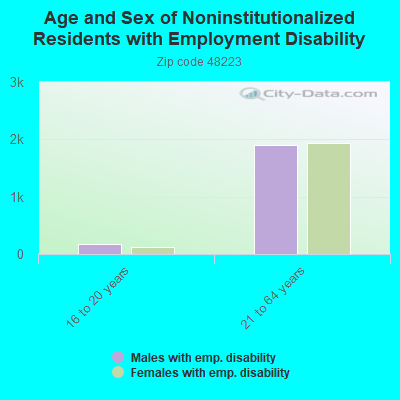
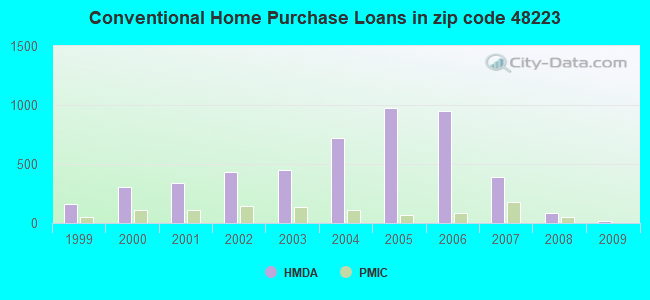
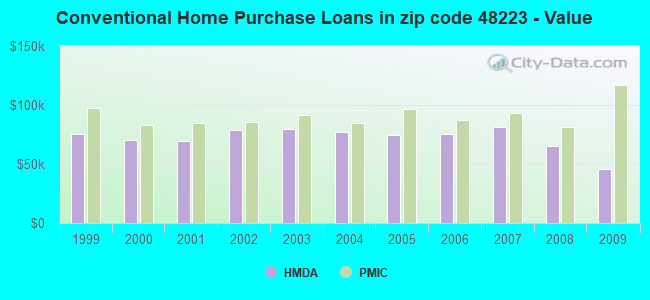
 Based on the data from the years 2002 - 2018 the average number of fires per year is 93. The highest number of fires - 220 took place in 2018, and the least - 0 in 2007. The data has an increasing trend.
 When looking into fire subcategories, the most reports belonged to: Structure Fires (47.5%), and Mobile Property/Vehicle Fires (30.3%).