Estimated zip code population in 2022: 16,818 Zip code population in 2010: 18,407 Zip code population in 2000: 21,773
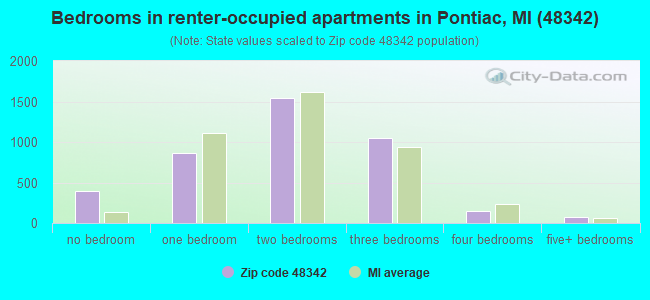
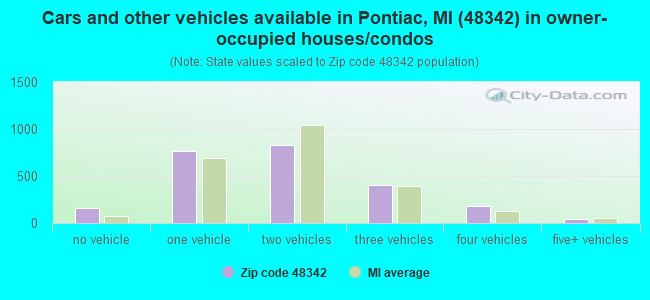
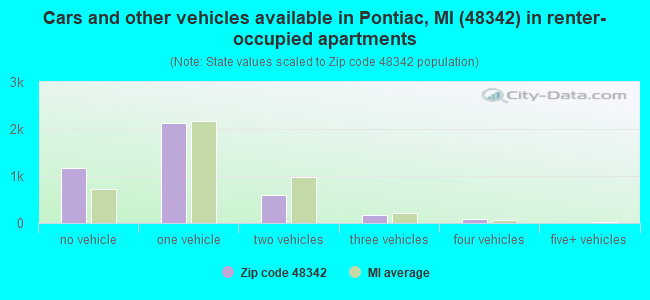
Houses and condos: 7,495 Renter-occupied apartments: 4,172
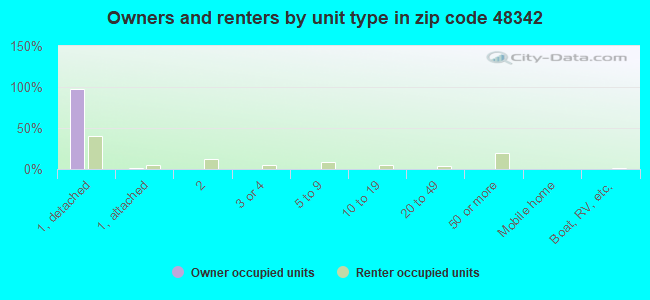
% of renters here:
64%
State:
27%
March 2022 cost of living index in zip code 48342: 94.6 (less than average, U.S. average is 100)
Land area: 5.7 sq. mi. Water area: 0.1 sq. mi.
Population density: 2,933 people per square mile
(average).
OSM Map
General Map
Google Map
MSN Map
OSM Map
General Map
Google Map
MSN Map
OSM Map
General Map
Google Map
MSN Map
OSM Map
General Map
Google Map
MSN Map
Please wait while loading the map...
Real estate property taxes paid for housing units in 2022:
This zip code:
1.0% ($952)
Michigan:
1.2% ($2,746)
Median real estate property taxes paid for housing units with mortgages in 2022: $1,106 (1.0%) Median real estate property taxes paid for housing units with no mortgage in 2022: $825 (1.0%)
Averages for the 2020 tax year for zip code 48342, filed in 2021:
Average Adjusted Gross Income (AGI) in 2020: $28,064 (Individual Income Tax Returns)
Here:
$28,064
State:
$68,945
Salary/wage: $24,063 (reported on 79.3% of returns)
Here:
$24,063
State:
$57,142
(% of AGI for various income ranges: 1021.9% for AGIs below $25k, 2987.6% for AGIs $25k-50k, 6491.0% for AGIs $50k-75k, 10020.8% for AGIs $75k-100k, 15660.0% for AGIs $100k-200k)
Taxable interest for individuals: $224 (reported on 8.4% of returns)
This zip code:
$224
Michigan:
$1,630
(% of AGI for various income ranges: 1.1% for AGIs below $25k, 2.5% for AGIs $25k-50k, 6.5% for AGIs $50k-75k, 10.8% for AGIs $75k-100k, 25.0% for AGIs $100k-200k)
Ordinary dividends: $782 (reported on 2.3% of returns)
Here:
$782
State:
$6,972
(% of AGI for various income ranges: 1.0% for AGIs below $25k, 1.5% for AGIs $25k-50k, 7.0% for AGIs $50k-75k, 35.8% for AGIs $75k-100k)
Net capital gain/loss in AGI: +$1,807 (reported on 2.0% of returns)
Here:
+$1,807
State:
+$20,064
(% of AGI for various income ranges: 0.4% for AGIs below $25k, 3.3% for AGIs $25k-50k, 154.2% for AGIs $75k-100k)
Profit/loss from business: +$1,269 (reported on 20.7% of returns)
Here:
+$1,269
State:
+$11,172
(% of AGI for various income ranges: 57.4% for AGIs below $25k, 26.2% for AGIs $50k-75k, 187.5% for AGIs $75k-100k, 575.0% for AGIs $100k-200k)
Taxable individual retirement arrangement distribution: $9,960 (reported on 2.0% of returns)
48342:
$9,960
Michigan:
$19,803
(% of AGI for various income ranges: 9.3% for AGIs below $25k, 24.4% for AGIs $25k-50k, 171.2% for AGIs $50k-75k)
Total itemized deductions: $23,379 (reported on 1.9% of returns)
Here:
$23,379
State:
$34,117
(% of AGI for various income ranges: 12.9% for AGIs below $25k, 41.9% for AGIs $25k-50k, 195.5% for AGIs $50k-75k, 992.5% for AGIs $75k-100k)
Charity contributions: $8,670 (reported on 1.3% of returns)
Here:
$8,670
State:
$13,548
(% of AGI for various income ranges: 12.3% for AGIs $25k-50k, 36.2% for AGIs $50k-75k, 377.5% for AGIs $75k-100k)
Taxes paid: $6,179 (reported on 1.9% of returns)
48342:
$6,179
State:
$7,972
(% of AGI for various income ranges: 13.2% for AGIs $25k-50k, 54.2% for AGIs $50k-75k, 300.0% for AGIs $75k-100k)
Earned income credit: $2,790 (reported on 38.3% of returns)
Here:
$2,790
State:
$2,251
(% of AGI for various income ranges: 164.7% for AGIs below $25k, 140.2% for AGIs $25k-50k, 3.0% for AGIs $50k-75k)
Percentage of individuals using paid preparers for their 2020 taxes: 90.4%
Here:
90%
State:
93%
(% for various income ranges: 90.1% for AGIs below $25k, 91.4% for AGIs $25k-50k, 86.0% for AGIs $50k-75k, 89.5% for AGIs $75k-100k, 100.0% for AGIs $100k-200k)
Averages for the 2012 tax year for zip code 48342, filed in 2013:
Average Adjusted Gross Income (AGI) in 2012: $22,834 (Individual Income Tax Returns)
Here:
$22,834
State:
$55,609
Salary/wage: $18,725 (reported on 85.8% of returns)
Here:
$18,725
State:
$46,782
(% of AGI for various income ranges: 70.3% for AGIs below $25k, 72.8% for AGIs $25k-50k, 72.6% for AGIs $50k-75k, 71.4% for AGIs $75k-100k, 52.7% for AGIs $100k-200k)
Taxable interest for individuals: $497 (reported on 8.7% of returns)
This zip code:
$497
Michigan:
$1,491
(% of AGI for various income ranges: 0.2% for AGIs below $25k, 0.2% for AGIs $25k-50k, 0.3% for AGIs $75k-100k)
Ordinary dividends: $1,472 (reported on 2.5% of returns)
Here:
$1,472
State:
$6,225
(% of AGI for various income ranges: 0.4% for AGIs $25k-50k, 0.1% for AGIs $75k-100k)
Net capital gain/loss in AGI: +$282 (reported on 1.5% of returns)
Here:
+$282
State:
+$9,326
(% of AGI for various income ranges: )
Profit/loss from business: +$6,553 (reported on 18.7% of returns)
Here:
+$6,553
State:
+$11,523
(% of AGI for various income ranges: 13.6% for AGIs below $25k, 0.8% for AGIs $25k-50k)
Taxable individual retirement arrangement distribution: $10,167 (reported on 2.9% of returns)
48342:
$10,167
Michigan:
$15,298
(% of AGI for various income ranges: 0.4% for AGIs below $25k, 0.7% for AGIs $25k-50k, 2.3% for AGIs $50k-75k, 2.3% for AGIs $75k-100k, 5.7% for AGIs $100k-200k)
Total itemized deductions: $14,458 (28% of AGI, reported on 10.3% of returns)
Here:
$14,458
State:
$21,628
Here:
27.5% of AGI
State:
18.4% of AGI
(% of AGI for various income ranges: 3.1% for AGIs below $25k, 6.3% for AGIs $25k-50k, 11.0% for AGIs $50k-75k, 11.3% for AGIs $75k-100k, 10.0% for AGIs $100k-200k)
Charity contributions: $4,378 (reported on 8.4% of returns)
Here:
$4,378
State:
$4,225
(% of AGI for various income ranges: 0.5% for AGIs below $25k, 1.4% for AGIs $25k-50k, 3.2% for AGIs $50k-75k, 3.2% for AGIs $75k-100k, 3.3% for AGIs $100k-200k)
Taxes paid: $3,715 (reported on 10.4% of returns)
48342:
$3,715
State:
$8,327
(% of AGI for various income ranges: 0.5% for AGIs below $25k, 1.6% for AGIs $25k-50k, 3.0% for AGIs $50k-75k, 3.6% for AGIs $75k-100k, 3.8% for AGIs $100k-200k)
Earned income credit: $2,861 (reported on 45.5% of returns)
Here:
$2,861
State:
$2,306
(% of AGI for various income ranges: 13.6% for AGIs below $25k, 1.8% for AGIs $25k-50k)
Percentage of individuals using paid preparers for their 2012 taxes: 51.8%
Here:
52%
State:
57%
(% for various income ranges: 50.1% for AGIs below $25k, 55.6% for AGIs $25k-50k, 53.5% for AGIs $50k-75k, 53.3% for AGIs $75k-100k, 75.0% for AGIs $100k-200k)
Averages for the 2004 tax year for zip code 48342, filed in 2005:
Average Adjusted Gross Income (AGI) in 2004: $25,885 (Individual Income Tax Returns)
Here:
$25,885
State:
$48,204
Salary/wage: $23,612 (reported on 91.3% of returns)
Here:
$23,612
State:
$42,791
(% of AGI for various income ranges: 80.9% for AGIs below $10k, 78.5% for AGIs $10k-25k, 83.1% for AGIs $25k-50k, 84.3% for AGIs $50k-75k, 88.7% for AGIs $75k-100k, 88.3% for AGIs over 100k)
Taxable interest for individuals: $492 (reported on 19.1% of returns)
This zip code:
$492
Michigan:
$1,725
(% of AGI for various income ranges: 0.6% for AGIs below $10k, 0.5% for AGIs $10k-25k, 0.3% for AGIs $25k-50k, 0.3% for AGIs $50k-75k, 0.3% for AGIs $75k-100k, 0.4% for AGIs over 100k)
Taxable dividends: $353 (reported on 5.8% of returns)
Here:
$353
State:
$3,420
(% of AGI for various income ranges: 0.2% for AGIs below $10k, 0.1% for AGIs $10k-25k, 0.1% for AGIs $25k-50k, 0.0% for AGIs $50k-75k, 0.0% for AGIs $75k-100k, 0.2% for AGIs over 100k)
Net capital gain/loss: +$2,445 (reported on 2.4% of returns)
Here:
+$2,445
State:
+$8,532
(% of AGI for various income ranges: 0.2% for AGIs below $10k, 0.1% for AGIs $10k-25k, -0.0% for AGIs $25k-50k, 0.3% for AGIs $50k-75k, 0.0% for AGIs $75k-100k, 1.5% for AGIs over 100k)
Profit/loss from business: +$4,773 (reported on 9.4% of returns)
Here:
+$4,773
State:
+$9,547
(% of AGI for various income ranges: 9.8% for AGIs below $10k, 4.0% for AGIs $10k-25k, 0.8% for AGIs $25k-50k, 0.7% for AGIs $50k-75k, -0.1% for AGIs $75k-100k, -0.4% for AGIs over 100k)
IRA payment deduction: $1,679 (reported on 0.8% of returns)
48342:
$1,679
Michigan:
$2,875
Total itemized deductions: $15,039 (28% of AGI, reported on 20.2% of returns)
Here:
$15,039
State:
$18,509
Here:
28.5% of AGI
State:
20.7% of AGI
(% of AGI for various income ranges: 4.3% for AGIs below $10k, 5.9% for AGIs $10k-25k, 10.4% for AGIs $25k-50k, 17.4% for AGIs $50k-75k, 15.6% for AGIs $75k-100k, 17.3% for AGIs over 100k)
Charity contributions deductions: $3,952 (7% of AGI, reported on 17.9% of returns)
Here:
$3,952
State:
$3,365
Here:
7.2% of AGI
State:
3.6% of AGI
(% of AGI for various income ranges: 0.5% for AGIs below $10k, 1.1% for AGIs $10k-25k, 2.4% for AGIs $25k-50k, 3.3% for AGIs $50k-75k, 4.5% for AGIs $75k-100k, 5.5% for AGIs over 100k)
Total tax: $3,273 (reported on 56.2% of returns)
48342:
$3,273
State:
$7,691
(% of AGI for various income ranges: 2.0% for AGIs below $10k, 2.8% for AGIs $10k-25k, 5.5% for AGIs $25k-50k, 9.5% for AGIs $50k-75k, 11.7% for AGIs $75k-100k, 15.0% for AGIs over 100k)
Earned income credit: $1,949 (reported on 38.9% of returns)
Here:
$1,949
State:
$1,737
Percentage of individuals using paid preparers for their 2004 taxes: 66.6%
Here:
67%
State:
60%
(% for various income ranges: 63.3% for AGIs below $10k, 70.9% for AGIs $10k-25k, 64.7% for AGIs $25k-50k, 63.9% for AGIs $50k-75k, 65.2% for AGIs $75k-100k, 74.8% for AGIs over 100k)
Likely homosexual households (counted as self-reported same-sex unmarried-partner households)
Lesbian couples: 0.2% of all households
Gay men: 0.0% of all households
Household received Food Stamps/SNAP in the past 12 months: 3,080 Household did not receive Food Stamps/SNAP in the past 12 months: 3,725
Women who had a birth in the past 12 months: 284 (15 now married, 256 unmarried) Women who did not have a birth in the past 12 months: 3,760 (624 now married, 3,155 unmarried)
Housing units in zip code 48342 with a mortgage: 1,159 (200 second mortgage, 179 both second mortgage and home equity loan) Median monthly owner costs for units with a mortgage: $1,046 Median monthly owner costs for units without a mortgage: $394
Residents with income below the poverty level in 2022:
This zip code:
35.3%
Whole state:
13.4%
Residents with income below 50% of the poverty level in 2022:
This zip code:
17.8%
Whole state:
6.9%
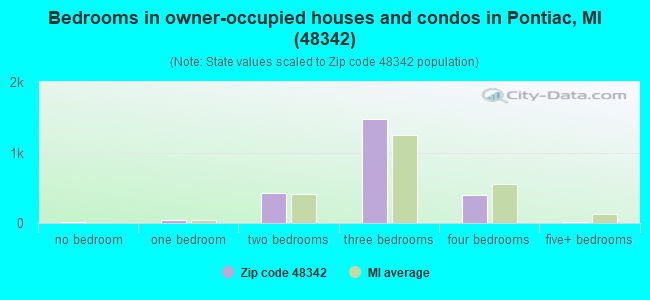
Median number of rooms in houses and condos:
Here:
6.0
State:
6.5
Median number of rooms in apartments:
Here:
4.3
State:
4.3
Notable locations in this zip code not listed on our city pages
Notable locations in zip code 48342: Oliver Playground (A), Montcalm Playground (B), Pontiac City Hall (C), Star Emergency Medical Services (D), Pontiac Chamber of Commerce (E), Pontiac Fire Department Station 1 Headquarters (F), Pontiac Silverdome (G), Mercy Place-Neighborhood Clinic (H). Display/hide their locations on the map
Parks in zip code 48342 include: South Kiwanis Park (1), Elizabeth Denison Forth Historical Marker (2), First Baptist Church Historical Marker (3), First Methodist Episcopal Church Historical Marker (4), First Presbyterian Church Historical Marker (5), Oak Hill Cemetery Historical Marker (6), Pine Grove Historical Marker (7), Saint Vincent de Paul Church Historical Marker (8), Galloway Lake Park (9). Display/hide their locations on the map
1,079 married couples with children.
2,496 single-parent households (338 men, 2,158 women).
77.1% of residents of 48342 zip code speak English at home.
15.9% of residents speak Spanish at home (50% very well, 21% well, 23% not well, 6% not at all).
0.6% of residents speak other Indo-European language at home (63% very well, 16% well, 2% not well, 18% not at all).
5.4% of residents speak Asian or Pacific Island language at home (38% very well, 35% well, 27% not well).
0.5% of residents speak other language at home (100% very well).
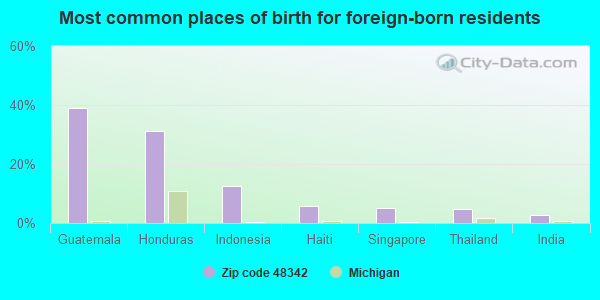
Foreign born population: 1,461 (8.7%) (34.7% of them are naturalized citizens)
Major facilities with environmental interests located in this zip code:
METAL WORKING LUBRICANTS CO (25 SILVERDOME INDUSTRIAL PK in PONTIAC, MI)
(Integrated Compliance Information System) - ICIS-05-2000-0314, FORMAL ENFORCEMENT ACTION (Resource Conservation and Recovery Act (tracking hazardous waste)) Business NAICS classification: MEASURING AND DISPENSING PUMP MANUFACTURING.
AQUATEC CHEMICAL INTL. INC. (408 AUBURN AVE. in PONTIAC, MI)
COMPLIANCE ACTIVITY (Tracking inspections of insecticide, fungicide, and rodenticide, and toxic substances) (Resource Conservation and Recovery Act (tracking hazardous waste)) TRI REPORTER (Tracking of toxic chemicals releasing facilities) Business SIC classification: CHEMICALS AND CHEMICAL PREPARATIONS Alternative names: AQUATEC CHEMICAL INC, INC, AQUATER CHEM INTL INC, BURMAH TECHNICAL SERVICES INC.
FREIBORNE INDUSTRIES INC. (15 SILVERDOME INDL. PARK in PONTIAC, MI)
AIR MINOR (AIRS/AFS) CRITERIA AND HAZARDOUS AIR POLLUTANT INVENTORY (Inventory of air pollution sources) Large Quantity Generators, more that 1000 kg of hazardous waste/month (Resource Conservation and Recovery Act (tracking hazardous waste)) TRI REPORTER (Tracking of toxic chemicals releasing facilities) Business SIC classification: INDUSTRIAL INORGANIC CHEMICALS; CHEMICALS AND CHEMICAL PREPARATIONS Business NAICS classification: ALL OTHER MISCELLANEOUS CHEMICAL PRODUCT AND PREPARATION MANUFACTURING. Organizations: GILL A. COLM (CONTACT/OPERATOR)
GREAT LAKES ACADEMY (46312 WOODWARD AVENUE in PONTIAC, MI)
(National Center for Education Statistics) - STATE ID-08464
EDISON/PERDUE ACADEMY (25 S. SANFORD STREET in PONTIAC, MI)
(National Center for Education Statistics) - STATE ID-07012 Organizations: PONTIAC CITY SCHOOL DISTRICT (SCHOOL DISTRICT)
GENERAL MOTORS TRUCK AND BUS DIVISION PONTIAC (31 JUDSON STREET in PONTIAC, MI)
(Integrated Compliance Information System) - ICIS-05-1995-0330, FORMAL ENFORCEMENT ACTION
ANDREW AND GARY KRAUSE (392 S SANFORD ST in PONTIAC, MI)
(Resource Conservation and Recovery Act (tracking hazardous waste)) Organizations: ARS (CONTACT/OWNER)
CHEMICO SYSTEMS INC (1130 WIDE TRACK DR W in PONTIAC, MI)
CRITERIA AND HAZARDOUS AIR POLLUTANT INVENTORY (Inventory of air pollution sources) (Resource Conservation and Recovery Act (tracking hazardous waste)) Business SIC classification: SPECIALTY CLEANING, POLISHING, AND SANITATION PREPARATIONS
DOWNTOWN VALET CLEANERS (113 N PERRY in PONTIAC, MI)
(Resource Conservation and Recovery Act (tracking hazardous waste)) Organizations: BILL QUINN (CONTACT/OWNER)
ART METAL PLATERS CORP (61 SHORT RD in PONTIAC, MI)
(Resource Conservation and Recovery Act (tracking hazardous waste))
BLOOMFIELD COLLISION INC (630 CORWIN in PONTIAC, MI)
(Resource Conservation and Recovery Act (tracking hazardous waste))
FARBMAN GROUP AS RECEIVER FOR PONTIAC PL (140 S SAGINAW in PONTIAC, MI)
Small Quantity Generators, between 100 kg and 1000 kg of hazardous waste/month (Resource Conservation and Recovery Act (tracking hazardous waste)) Organizations: GMAC COMMERCIAL MORTGAGE CORP (CONTACT/OWNER)
Alternative names: PONTIAC PLACE LAMBERT CO
FAST TRACK VENTURES ACQUISITIONS LLC (325 N CASS AVE in PONTIAC, MI)
Conditionally Exempt Small Quantity Generators, less than 100 kg/month of hazardous waste (Resource Conservation and Recovery Act (tracking hazardous waste)) Organizations: ADHAM MACLIE (CONTACT/OPERATOR)
Alternative names: CLARK OIL CO 0859
Housing units lacking complete plumbing facilities: 2.9% Housing units lacking complete kitchen facilities: 3.2%
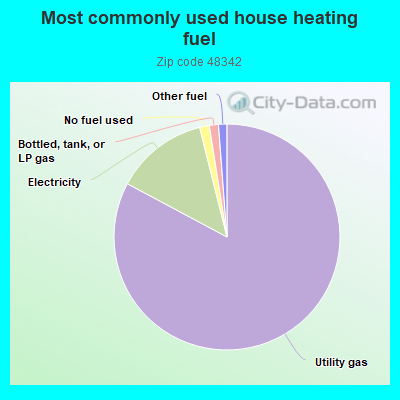
82.9%Utility gas
13.3%Electricity
1.4%No fuel used
1.3%Bottled, tank, or LP gas
1.2%Other fuel
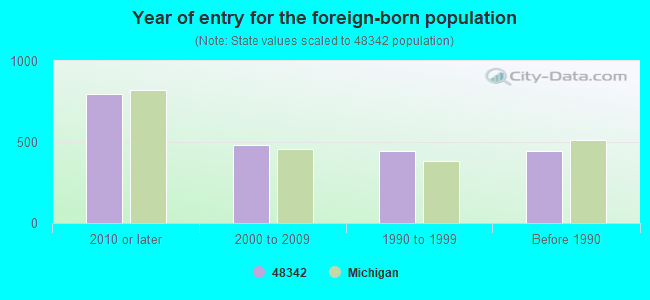
Population in 1990: 24,663.
Place of birth for U.S.-born residents:
This state: 11,323
Northeast: 154
Midwest: 404
South: 2,093
West: 657
54% of the 48342 zip code residents lived in the same house 5 years ago. Out of people who lived in different houses, 75% lived in this county. Out of people who lived in different counties, 50% lived in Michigan.
90% of the 48342 zip code residents lived in the same house 1 year ago. Out of people who lived in different houses, 62% moved from this county. Out of people who lived in different houses, 21% moved from different county within same state. Out of people who lived in different houses, 12% moved from different state. Out of people who lived in different houses, 3% moved from abroad.
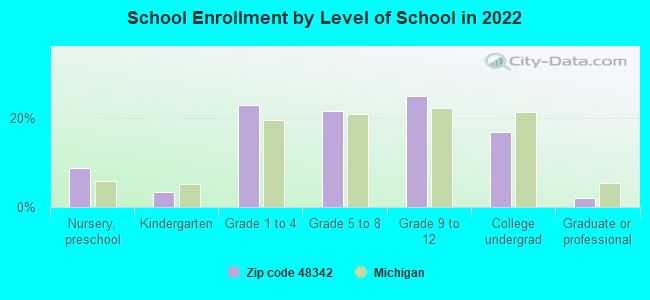
Private vs. public school enrollment:
Students in private schools in grades 1 to 8 (elementary and middle school): 133
Here:
7.8%
Michigan:
12.4%
Students in private schools in grades 9 to 12 (high school): 7
Here:
0.8%
Michigan:
9.8%
Students in private undergraduate colleges: 89
Here:
13.8%
Michigan:
14.9%
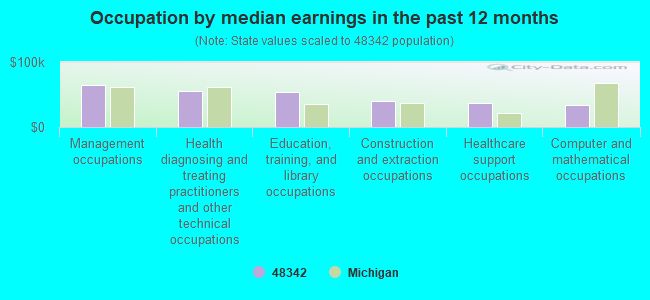
Occupation by median earnings in the past 12 months ($)
65,250Management occupations
54,974Health diagnosing and treating practitioners and other technical occupations
53,971Education, training, and library occupations
40,067Construction and extraction occupations
37,692Healthcare support occupations
33,982Computer and mathematical occupations
Companies with federal contracts located in this zip code (PONTIAC, MI):
SOUTHERN AUTOMOTIVE WHOLESALER (597 N SAGINAW STREET; small business) : $17,680,025 in 319 contractsfrom 1999 to 2006
Contracts for Engine Electrical System Components, Nonaircraft, Generators and Generators Sets, Electrical, Switches, Electrical Control Equipment, and moreby Defense Logistics Agency, Army Signed by year:2000: $3,081,159; 2001: $2,898,727; 2002: $1,558,359; 2003: $2,302,014; 2004: $3,620,527; 2005: $3,058,777; 2006: $1,042,677.
Biggest contracts:
$1,008,147 with Defense Logistics Agency for Engine Electrical System Components, Nonaircraft. Signed on 2001-06-13. Completion date: 2002-08-07.
$825,600 with Army for Generators and Generators Sets, Electrical. Signed on 2004-09-22. Completion date: 2015-01-04.
$628,180 with Defense Logistics Agency for Engine Electrical System Components, Nonaircraft. Signed on 2005-04-22. Completion date: 2006-03-23.
$508,080, same as above.Signed on 2001-11-20. Completion date: 2003-10-31.
METALWORKING LUBRICANTS CO (25 SILVERDOME INDUSTRIAL; small business) : $78,194 in 12 contractsfrom 2004 to 2006
Contracts for Oils and Greases: Cutting, Lubricating, and Hydraulic by Army Signed by year:2000: $0; 2001: $0; 2002: $0; 2003: $0; 2004: $21,569; 2005: $41,781; 2006: $14,844.
Biggest contracts:
$22,132 with Army for Oils and Greases: Cutting, Lubricating, and Hydraulic. Signed on 2005-06-13. Completion date: 2005-07-16.
$19,767, same as above.Signed on 2006-04-13. Completion date: 2006-05-01.
$13,134, same as above.Signed on 2005-01-04. Completion date: 2006-01-04.
$8,039, same as above.Signed on 2004-01-20. Completion date: 2005-01-19.
AMERITECH MONITORING SERVICES, (54 N MILL ST)
$25,000 with U.S. Army Corps of Engineers - civil program financing only for Telephone and/or Communications Services (includes Telegraph, Telex, and Cablevision Services). Signed on 1999-12-06. Completion date: 2000-09-30.
JOHNSON, DONEARL (113 HILLDALE DR; small business) : $19,753 in 3 contractsfrom 2004 to 2005
$10,000 with Army for ADP Support Equipment. Signed on 2004-04-19. Completion date: 2004-05-27.
$9,328 with Army for Video Recording and Reproducing Equipment. Signed on 2005-04-21. Completion date: 2005-05-26.
$425 with Army for ADP Support Equipment. Signed on 2004-06-03. Completion date: 2004-05-27.
Top industries in this zip code by the number of employees in 2005:
Management of Companies and Enterprises: Corporate, Subsidiary, and Regional Managing Offices (over 1000 employees: 1 establishment, 20-49 employees: 4 establishments, 5-9 employees: 1 establishment, 1-4 employees: 1 establishment)
Health Care and Social Assistance: General Medical and Surgical Hospitals (over 1000: 1)
Health Care and Social Assistance: Other Individual and Family Services (250-499: 1, 50-99: 2, 20-49: 2, 5-9: 1, 1-4: 1)
Health Care and Social Assistance: Residential Mental Health and Substance Abuse Facilities (250-499: 1, 10-19: 1, 1-4: 3)
2002 - 2018 National Fire Incident Reporting System (NFIRS) incidents
According to the data from the years 2002 - 2018 the average number of fires per year is 94. The highest number of fires - 151 took place in 2016, and the least - 0 in 2009. The data has a rising trend.
When looking into fire subcategories, the most reports belonged to: Structure Fires (61.4%), and Outside Fires (17.9%).
Fire incident types reported to NFIRS in Zip Code 48342
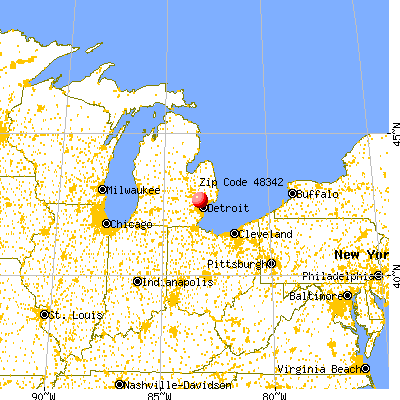


 Nearest zip codes: 48341, 48340, 48326, 48302, 48304, 48320.
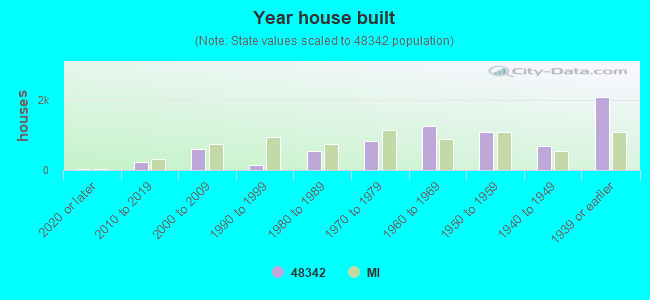


 According to the data from the years 2002 - 2018 the average number of fires per year is 94. The highest number of fires - 151 took place in 2016, and the least - 0 in 2009. The data has a rising trend.
 When looking into fire subcategories, the most reports belonged to: Structure Fires (61.4%), and Outside Fires (17.9%).