Estimated zip code population in 2022: 2,190 Zip code population in 2010: 2,740 Zip code population in 2000: 2,656
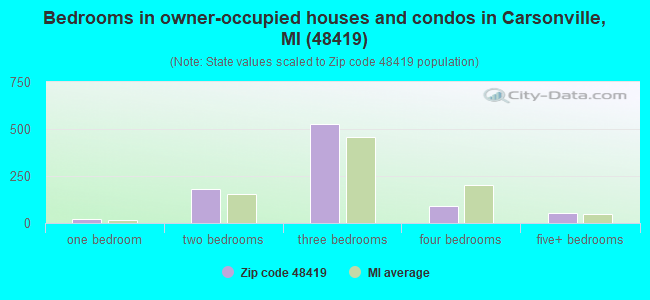
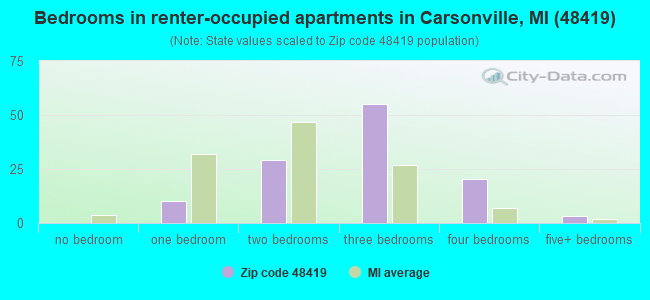
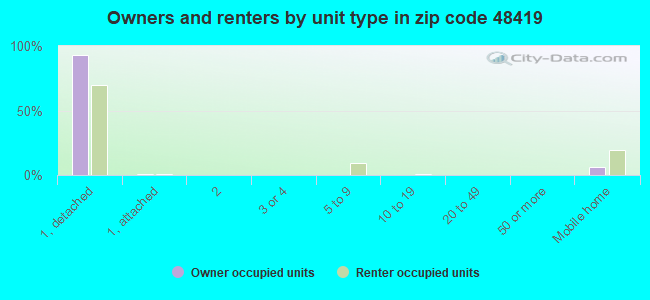
Houses and condos: 1,283 Renter-occupied apartments: 118
% of renters here:
12%
State:
27%
March 2022 cost of living index in zip code 48419: 81.6 (low, U.S. average is 100)
Land area: 77.3 sq. mi. Water area: 1.0 sq. mi.
Population density: 28 people per square mile
(very low).
OSM Map
General Map
Google Map
MSN Map
OSM Map
General Map
Google Map
MSN Map
OSM Map
General Map
Google Map
MSN Map
OSM Map
General Map
Google Map
MSN Map
Please wait while loading the map...
Real estate property taxes paid for housing units in 2022:
This zip code:
0.8% ($1,483)
Michigan:
1.2% ($2,746)
Median real estate property taxes paid for housing units with mortgages in 2022: $1,611 (0.8%) Median real estate property taxes paid for housing units with no mortgage in 2022: $1,337 (0.9%)
Business Search- 14 Million verified businesses
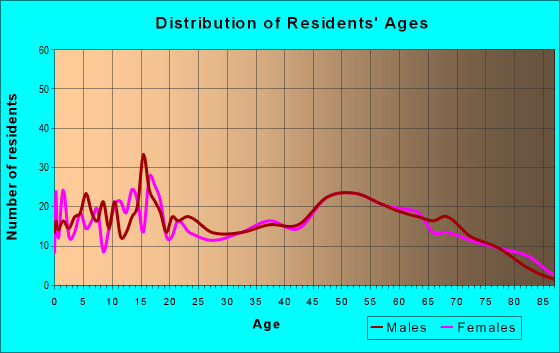
Males: 1,045
(47.7%)
Females: 1,144
(52.3%)
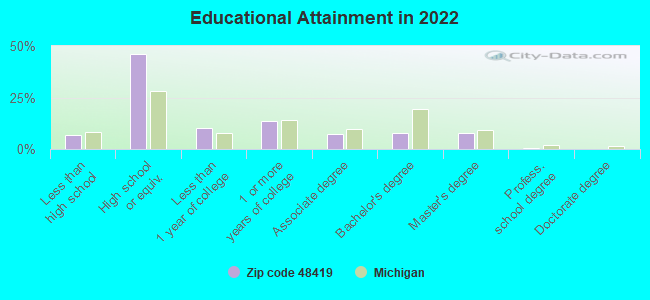
For population 25 years and over in 48419:
High school or higher: 92.2%
Bachelor's degree or higher: 16.0%
Graduate or professional degree: 8.5%
Unemployed: 4.7%
Mean travel time to work (commute): 30.6 minutes
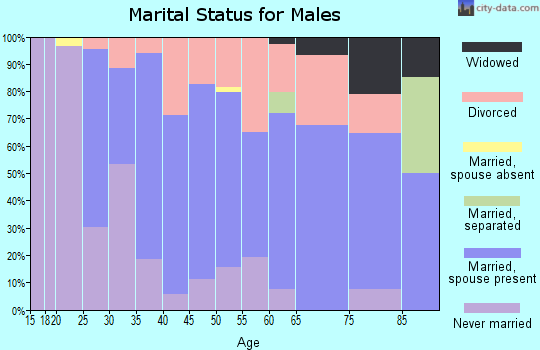
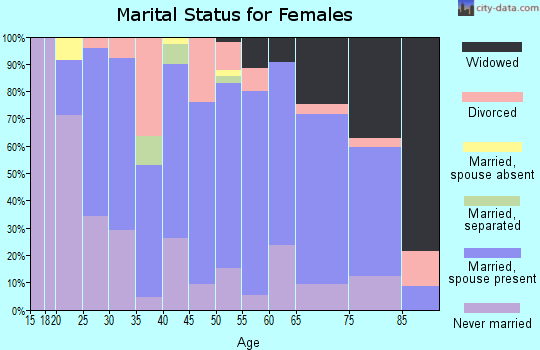
For population 15 years and over in 48419:
Never married: 21.7%
Now married: 56.7%
Separated: 0.6%
Widowed: 8.2%
Divorced: 12.8%
Zip code 48419 compared to state average:
Black race population percentage significantly below state average.
Median age above state average.
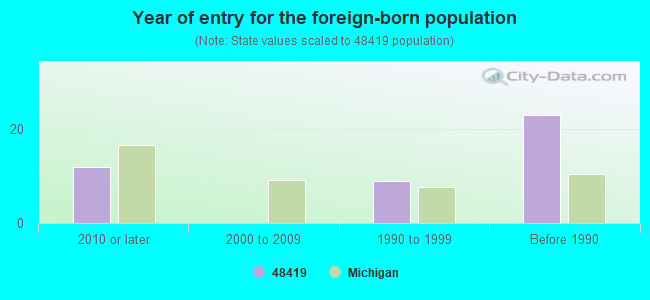
Foreign-born population percentage significantly below state average.
Renting percentage below state average.
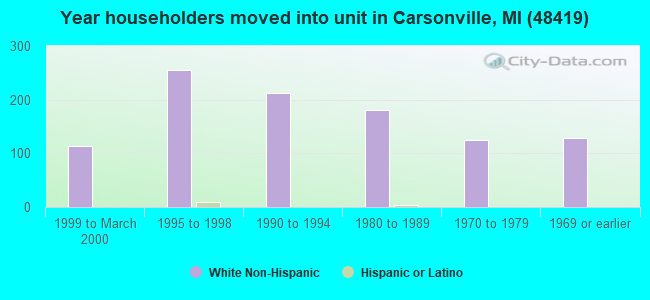
Length of stay since moving in significantly above state average.
Percentage of population with a bachelor's degree or higher below state average.
Averages for the 2020 tax year for zip code 48419, filed in 2021:
Average Adjusted Gross Income (AGI) in 2020: $52,267 (Individual Income Tax Returns)
Here:
$52,267
State:
$68,945
Salary/wage: $44,345 (reported on 74.6% of returns)
Here:
$44,345
State:
$57,142
(% of AGI for various income ranges: 996.0% for AGIs below $25k, 3417.5% for AGIs $25k-50k, 6817.7% for AGIs $50k-75k, 9145.7% for AGIs $75k-100k, 26134.0% for AGIs $100k-200k)
Taxable interest for individuals: $1,419 (reported on 27.1% of returns)
This zip code:
$1,419
Michigan:
$1,630
(% of AGI for various income ranges: 19.2% for AGIs below $25k, 20.8% for AGIs $25k-50k, 36.2% for AGIs $50k-75k, 45.7% for AGIs $75k-100k, 554.0% for AGIs $100k-200k)
Ordinary dividends: $1,871 (reported on 14.4% of returns)
Here:
$1,871
State:
$6,972
(% of AGI for various income ranges: 17.6% for AGIs below $25k, 11.7% for AGIs $25k-50k, 37.7% for AGIs $50k-75k, 51.4% for AGIs $75k-100k, 322.0% for AGIs $100k-200k)
Net capital gain/loss in AGI: +$6,950 (reported on 11.9% of returns)
Here:
+$6,950
State:
+$20,064
(% of AGI for various income ranges: 27.6% for AGIs below $25k, 25.0% for AGIs $25k-50k, 208.6% for AGIs $75k-100k, 1396.0% for AGIs $100k-200k)
Profit/loss from business: +$6,012 (reported on 14.4% of returns)
Here:
+$6,012
State:
+$11,172
(% of AGI for various income ranges: 150.4% for AGIs below $25k, 49.6% for AGIs $25k-50k, 287.7% for AGIs $50k-75k, 218.6% for AGIs $75k-100k)
Taxable individual retirement arrangement distribution: $13,790 (reported on 8.5% of returns)
48419:
$13,790
Michigan:
$19,803
(% of AGI for various income ranges: 87.6% for AGIs below $25k, 183.8% for AGIs $25k-50k, 1027.1% for AGIs $75k-100k)
Earned income credit: $2,170 (reported on 16.9% of returns)
Here:
$2,170
State:
$2,251
(% of AGI for various income ranges: 94.0% for AGIs below $25k, 82.9% for AGIs $25k-50k)
Percentage of individuals using paid preparers for their 2020 taxes: 94.9%
Here:
95%
State:
93%
(% for various income ranges: 93.3% for AGIs below $25k, 93.8% for AGIs $25k-50k, 94.7% for AGIs $50k-75k, 100.0% for AGIs $75k-100k, 100.0% for AGIs $100k-200k)
Averages for the 2012 tax year for zip code 48419, filed in 2013:
Average Adjusted Gross Income (AGI) in 2012: $35,980 (Individual Income Tax Returns)
Here:
$35,980
State:
$55,609
Salary/wage: $32,079 (reported on 78.7% of returns)
Here:
$32,079
State:
$46,782
(% of AGI for various income ranges: 64.5% for AGIs below $25k, 70.6% for AGIs $25k-50k, 75.3% for AGIs $50k-75k, 71.6% for AGIs $75k-100k, 66.4% for AGIs $100k-200k)
Taxable interest for individuals: $1,000 (reported on 29.6% of returns)
This zip code:
$1,000
Michigan:
$1,491
(% of AGI for various income ranges: 1.2% for AGIs below $25k, 1.1% for AGIs $25k-50k, 0.4% for AGIs $50k-75k, 0.4% for AGIs $75k-100k, 1.0% for AGIs $100k-200k)
Ordinary dividends: $1,532 (reported on 17.6% of returns)
Here:
$1,532
State:
$6,225
(% of AGI for various income ranges: 1.9% for AGIs below $25k, 0.9% for AGIs $25k-50k, 0.1% for AGIs $50k-75k, 1.0% for AGIs $75k-100k)
Net capital gain/loss in AGI: +$843 (reported on 13.0% of returns)
Here:
+$843
State:
+$9,326
(% of AGI for various income ranges: 0.6% for AGIs $25k-50k, 1.1% for AGIs $75k-100k)
Profit/loss from business: +$5,319 (reported on 19.4% of returns)
Here:
+$5,319
State:
+$11,523
(% of AGI for various income ranges: 8.6% for AGIs below $25k, 3.0% for AGIs $25k-50k, 2.4% for AGIs $50k-75k, 1.3% for AGIs $75k-100k)
Taxable individual retirement arrangement distribution: $7,718 (reported on 10.2% of returns)
48419:
$7,718
Michigan:
$15,298
(% of AGI for various income ranges: 2.4% for AGIs below $25k, 2.7% for AGIs $25k-50k, 5.1% for AGIs $50k-75k)
Total itemized deductions: $16,900 (26% of AGI, reported on 16.7% of returns)
Here:
$16,900
State:
$21,628
Here:
25.9% of AGI
State:
18.4% of AGI
(% of AGI for various income ranges: 7.3% for AGIs below $25k, 6.8% for AGIs $25k-50k, 7.2% for AGIs $50k-75k, 8.1% for AGIs $75k-100k, 10.3% for AGIs $100k-200k)
Charity contributions: $2,200 (reported on 13.0% of returns)
Here:
$2,200
State:
$4,225
(% of AGI for various income ranges: 1.0% for AGIs $25k-50k, 0.5% for AGIs $50k-75k, 1.0% for AGIs $75k-100k, 1.2% for AGIs $100k-200k)
Taxes paid: $4,372 (reported on 16.7% of returns)
48419:
$4,372
State:
$8,327
(% of AGI for various income ranges: 0.8% for AGIs below $25k, 1.3% for AGIs $25k-50k, 2.2% for AGIs $50k-75k, 2.3% for AGIs $75k-100k, 3.7% for AGIs $100k-200k)
Earned income credit: $2,439 (reported on 21.3% of returns)
Here:
$2,439
State:
$2,306
(% of AGI for various income ranges: 7.2% for AGIs below $25k, 1.3% for AGIs $25k-50k)
Percentage of individuals using paid preparers for their 2012 taxes: 71.3%
Here:
71%
State:
57%
(% for various income ranges: 67.3% for AGIs below $25k, 75.9% for AGIs $25k-50k, 71.4% for AGIs $50k-75k, 75.0% for AGIs $75k-100k, 80.0% for AGIs $100k-200k)
Averages for the 2004 tax year for zip code 48419, filed in 2005:
Average Adjusted Gross Income (AGI) in 2004: $31,121 (Individual Income Tax Returns)
Here:
$31,121
State:
$48,204
Salary/wage: $30,786 (reported on 80.0% of returns)
Here:
$30,786
State:
$42,791
(% of AGI for various income ranges: 114.0% for AGIs below $10k, 66.7% for AGIs $10k-25k, 79.1% for AGIs $25k-50k, 81.4% for AGIs $50k-75k, 81.2% for AGIs $75k-100k, 79.9% for AGIs over 100k)
Taxable interest for individuals: $1,052 (reported on 50.4% of returns)
This zip code:
$1,052
Michigan:
$1,725
(% of AGI for various income ranges: 10.2% for AGIs below $10k, 2.7% for AGIs $10k-25k, 1.5% for AGIs $25k-50k, 1.2% for AGIs $50k-75k, 1.0% for AGIs $75k-100k, 1.4% for AGIs over 100k)
Taxable dividends: $948 (reported on 19.6% of returns)
Here:
$948
State:
$3,420
(% of AGI for various income ranges: 4.0% for AGIs below $10k, 1.0% for AGIs $10k-25k, 0.3% for AGIs $25k-50k, 0.4% for AGIs $50k-75k, 0.6% for AGIs $75k-100k, 0.5% for AGIs over 100k)
Net capital gain/loss: +$5,250 (reported on 14.2% of returns)
Here:
+$5,250
State:
+$8,532
(% of AGI for various income ranges: 4.2% for AGIs below $10k, 0.4% for AGIs $10k-25k, 1.2% for AGIs $25k-50k, 3.2% for AGIs $50k-75k, 4.6% for AGIs $75k-100k, 2.9% for AGIs over 100k)
Profit/loss from business: +$3,151 (reported on 17.4% of returns)
Here:
+$3,151
State:
+$9,547
(% of AGI for various income ranges: 11.8% for AGIs below $10k, 5.8% for AGIs $10k-25k, 1.7% for AGIs $25k-50k, 1.4% for AGIs $50k-75k, -1.6% for AGIs $75k-100k)
IRA payment deduction: $2,414 (reported on 2.5% of returns)
48419:
$2,414
Michigan:
$2,875
Total itemized deductions: $15,320 (26% of AGI, reported on 19.6% of returns)
Here:
$15,320
State:
$18,509
Here:
26.0% of AGI
State:
20.7% of AGI
(% of AGI for various income ranges: 14.5% for AGIs below $10k, 7.6% for AGIs $10k-25k, 9.5% for AGIs $25k-50k, 9.4% for AGIs $50k-75k, 8.4% for AGIs $75k-100k, 13.1% for AGIs over 100k)
Charity contributions deductions: $1,881 (3% of AGI, reported on 16.4% of returns)
Here:
$1,881
State:
$3,365
Here:
3.0% of AGI
State:
3.6% of AGI
(% of AGI for various income ranges: 1.1% for AGIs $10k-25k, 0.7% for AGIs $25k-50k, 1.2% for AGIs $50k-75k, 0.5% for AGIs $75k-100k, 1.7% for AGIs over 100k)
Total tax: $3,673 (reported on 70.2% of returns)
48419:
$3,673
State:
$7,691
(% of AGI for various income ranges: 5.0% for AGIs below $10k, 3.5% for AGIs $10k-25k, 5.8% for AGIs $25k-50k, 8.3% for AGIs $50k-75k, 10.4% for AGIs $75k-100k, 17.1% for AGIs over 100k)
Earned income credit: $1,856 (reported on 17.6% of returns)
Here:
$1,856
State:
$1,737
Percentage of individuals using paid preparers for their 2004 taxes: 72.2%
Here:
72%
State:
60%
(% for various income ranges: 68.8% for AGIs below $10k, 72.9% for AGIs $10k-25k, 75.3% for AGIs $25k-50k, 69.8% for AGIs $50k-75k, 73.0% for AGIs $75k-100k, 80.6% for AGIs over 100k)
Household received Food Stamps/SNAP in the past 12 months: 131 Household did not receive Food Stamps/SNAP in the past 12 months: 854
Women who had a birth in the past 12 months: 21 (0 now married, 20 unmarried) Women who did not have a birth in the past 12 months: 369 (214 now married, 153 unmarried)
Housing units in zip code 48419 with a mortgage: 408 (19 second mortgage, 18 both second mortgage and home equity loan) Houses without a mortgage: 21
Median monthly owner costs for units with a mortgage: $1,167 Median monthly owner costs for units without a mortgage: $433
Residents with income below the poverty level in 2022:
This zip code:
7.7%
Whole state:
13.4%
Residents with income below 50% of the poverty level in 2022:
This zip code:
4.2%
Whole state:
6.9%
Median number of rooms in houses and condos:
Here:
6.4
State:
6.5
Median number of rooms in apartments:
Here:
5.4
State:
4.3
Notable locations in this zip code not listed on our city pages
Notable locations in zip code 48419: Camp Ozanam (A), Pack's Mills Station (B), Carsonville Station (C), Hi-Way Drive-In Theater (D), Lake Huron Campground (E), Bridge Hampton Township Hall (F), Carsonville Fire Department (G), Carsonville Police Department (H). Display/hide their locations on the map
Churches in zip code 48419 include: Carsonville Assembly of God Church (A), United Methodist Church (B), Port Sanilac Baptist Church (C). Display/hide their locations on the map
Cemeteries: Washington Township Cemetery (1), Forester Township Cemetery (2), Lee Cemetery (3), Saint John Cemetery (4), Saint Marys Cemetery (5), Mount Zion Cemetery (6). Display/hide their locations on the map
Streams, rivers, and creeks: Kelly Creek (A), Sherman Creek (B), Pine Hill Stream (C), McKenzie Creek (D), Elk Creek (E). Display/hide their locations on the map
305 married couples with children.
122 single-parent households (68 men, 54 women).
95.8% of residents of 48419 zip code speak English at home.
3.6% of residents speak Spanish at home (76% very well, 13% well, 8% not well, 3% not at all).
0.5% of residents speak other Indo-European language at home (91% very well, 9% not well).
0.1% of residents speak Asian or Pacific Island language at home (50% very well, 50% well).
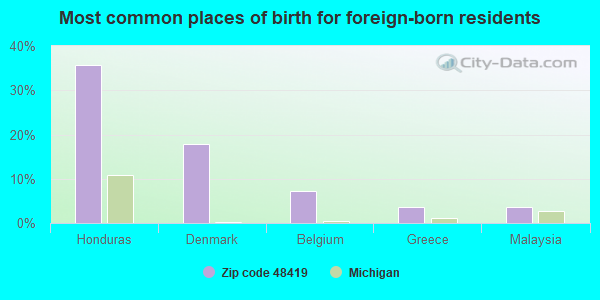
Foreign born population: 27 (1.3%) (40.5% of them are naturalized citizens)
This zip code:
1.3%
Whole state:
6.9%
36%Honduras
18%Denmark
7%Belgium
4%Greece
4%Malaysia
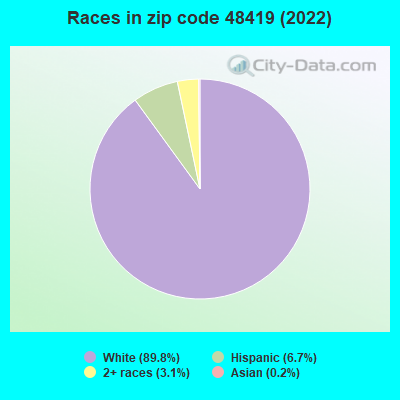
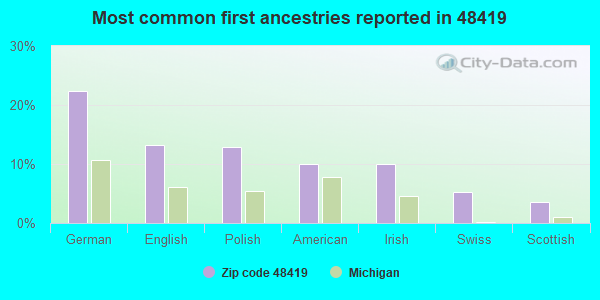
22%German
13%English
13%Polish
10%American
10%Irish
5%Swiss
4%Scottish
Year of entry for the foreign-born population
122010 or later
02000 to 2009
91990 to 1999
23Before 1990
Facilities with environmental interests located in this zip code:
MCPHERSON HARDWARE (3 N MAIN ST in CARSONVILLE, MI)
HAZARDOUS WASTE BIENNIAL REPORTER (Resource Conservation and Recovery Act (tracking hazardous waste)) (Resource Conservation and Recovery Act (tracking hazardous waste)) Organizations: WLLIAM AND MARION BURGESS (CONTACT/OWNER)
BACKUS OIL CO INC (3801 CHANDLER in CARSONVILLE, MI)
(Resource Conservation and Recovery Act (tracking hazardous waste))
Housing units lacking complete plumbing facilities: 2.0% Housing units lacking complete kitchen facilities: 1.9%
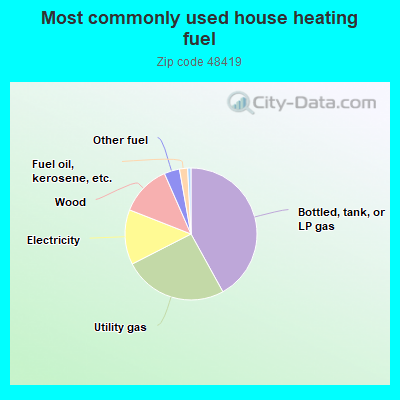
42.1%Bottled, tank, or LP gas
25.6%Utility gas
13.5%Electricity
12.5%Wood
3.8%Other fuel
2.0%Fuel oil, kerosene, etc.
0.8%No fuel used
Population in 1990: 2,621. Population change in the 1990s: +35 (+1.3%).
Place of birth for U.S.-born residents:
This state: 1,989
Northeast: 18
Midwest: 34
South: 65
West: 31
68% of the 48419 zip code residents lived in the same house 5 years ago. Out of people who lived in different houses, 54% lived in this county. Out of people who lived in different counties, 50% lived in Michigan.
93% of the 48419 zip code residents lived in the same house 1 year ago. Out of people who lived in different houses, 44% moved from this county. Out of people who lived in different houses, 45% moved from different county within same state. Out of people who lived in different houses, 11% moved from abroad.
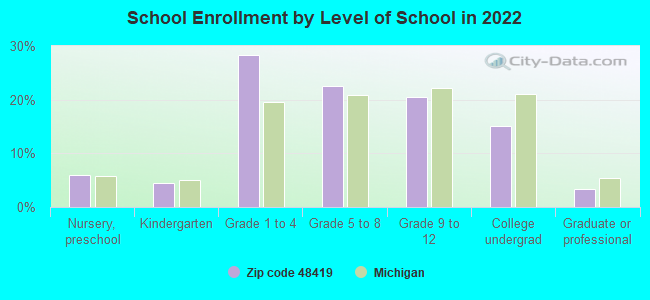
Private vs. public school enrollment:
Students in private schools in grades 1 to 8 (elementary and middle school): 20
Here:
9.0%
Michigan:
12.4%
Students in private schools in grades 9 to 12 (high school): 4
Here:
5.0%
Michigan:
9.8%
Students in private undergraduate colleges: 26
Here:
38.5%
Michigan:
14.9%
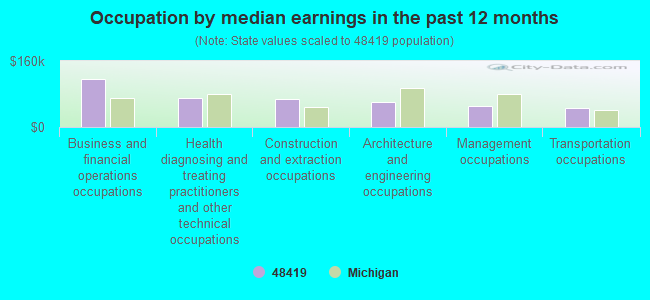
Occupation by median earnings in the past 12 months ($)
117,355Business and financial operations occupations
70,971Health diagnosing and treating practitioners and other technical occupations
68,705Construction and extraction occupations
59,417Architecture and engineering occupations
50,388Management occupations
47,177Transportation occupations
Top industries in this zip code by the number of employees in 2005:
Management of Companies and Enterprises: Offices of Bank Holding Companies (20-49 employees: 1 establishment)
Accommodation and Food Services: Full-Service Restaurants (10-19: 1, 1-4: 1)
Finance and Insurance: Direct Property and Casualty Insurance Carriers (10-19: 1)
Construction: Framing Contractors (10-19: 1)
Construction: Roofing Contractors (5-9: 1)
Finance and Insurance: Commercial Banking (5-9: 1)
Arts, Entertainment, and Recreation: Fitness and Recreational Sports Centers (5-9: 1)
Administrative and Support and Waste Management and Remediation Services: Solid Waste Landfill (5-9: 1)
People in group quarters in 2010:
6 people in nursing facilities/skilled-nursing facilities
People in group quarters in 2000:
8 people in other group homes
Fatal accident statistics in 2011:
Fatal accident count: 1
Vehicles involved in fatal accidents: 1
Fatal accidents caused by drunken drivers: 1
Fatalities: 1
Persons involved in fatal accidents: 1
Pedestrians involved in fatal accidents: 0
Fatal accident statistics in 2010:
Fatal accident count: 1
Vehicles involved in fatal accidents: 1
Fatal accidents caused by drunken drivers: 0
Fatalities: 1
Persons involved in fatal accidents: 1
Pedestrians involved in fatal accidents: 0
2002 - 2018 National Fire Incident Reporting System (NFIRS) incidents
According to the data from the years 2002 - 2018 the average number of fires per year is 9. The highest number of fires - 14 took place in 2010, and the least - 0 in 2004. The data has a growing trend.
When looking into fire subcategories, the most reports belonged to: Structure Fires (62.8%), and Outside Fires (20.9%).
Fire incident types reported to NFIRS in Zip Code 48419
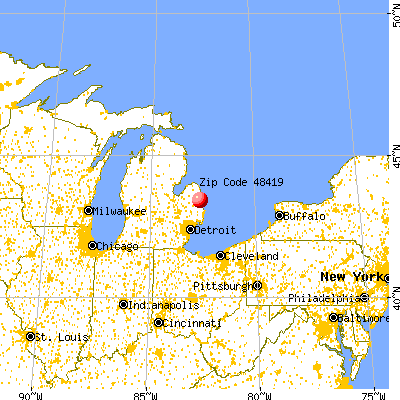


 Nearest zip codes: 48401, 48469, 48427, 48422, 48465, 48471.


 According to the data from the years 2002 - 2018 the average number of fires per year is 9. The highest number of fires - 14 took place in 2010, and the least - 0 in 2004. The data has a growing trend.
 When looking into fire subcategories, the most reports belonged to: Structure Fires (62.8%), and Outside Fires (20.9%).