Estimated zip code population in 2022: 25,762 Zip code population in 2010: 26,497 Zip code population in 2000: 25,121
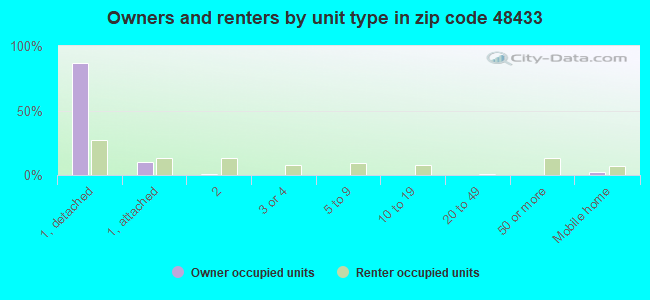
Houses and condos: 10,628 Renter-occupied apartments: 1,419
% of renters here:
14%
State:
27%
March 2022 cost of living index in zip code 48433: 80.8 (low, U.S. average is 100)
Land area: 55.5 sq. mi. Water area: 0.6 sq. mi.
Population density: 464 people per square mile
(low).
OSM Map
General Map
Google Map
MSN Map
OSM Map
General Map
Google Map
MSN Map
OSM Map
General Map
Google Map
MSN Map
OSM Map
General Map
Google Map
MSN Map
Please wait while loading the map...
Real estate property taxes paid for housing units in 2022:
This zip code:
1.3% ($2,707)
Michigan:
1.2% ($2,746)
Median real estate property taxes paid for housing units with mortgages in 2022: $2,839 (1.4%) Median real estate property taxes paid for housing units with no mortgage in 2022: $2,541 (1.4%)
Business Search- 14 Million verified businesses
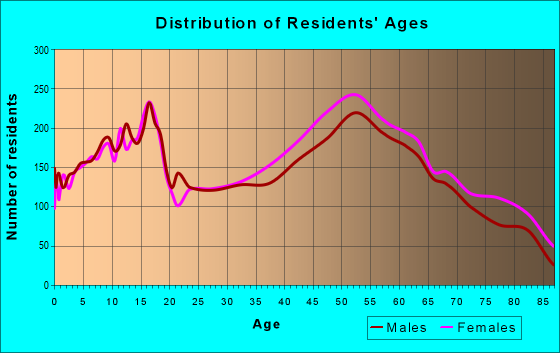
Males: 12,721
(49.4%)
Females: 13,041
(50.6%)
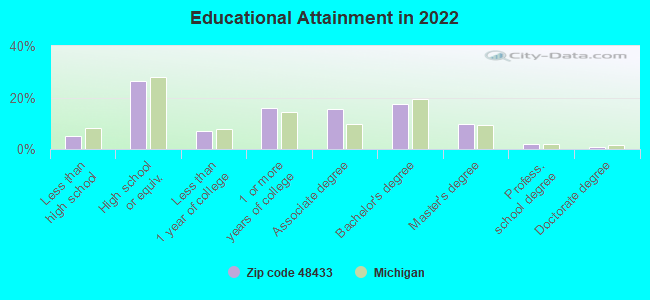
For population 25 years and over in 48433:
High school or higher: 94.7%
Bachelor's degree or higher: 30.2%
Graduate or professional degree: 12.5%
Unemployed: 3.8%
Mean travel time to work (commute): 24.8 minutes
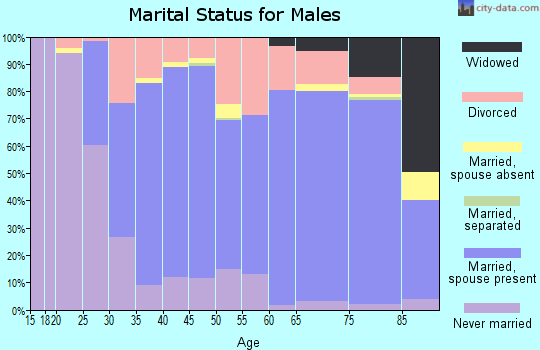
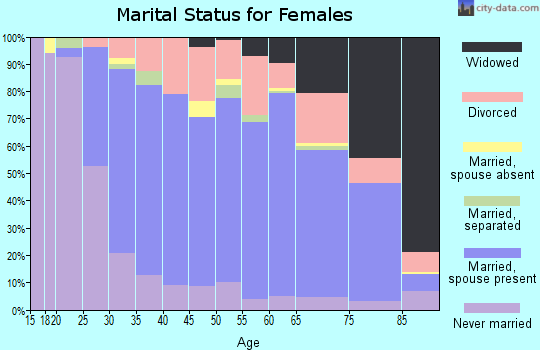
For population 15 years and over in 48433:
Never married: 29.7%
Now married: 54.3%
Separated: 1.1%
Widowed: 4.8%
Divorced: 10.1%
Zip code 48433 compared to state average:
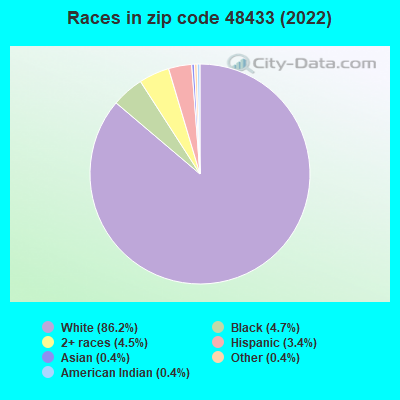
Black race population percentage below state average.
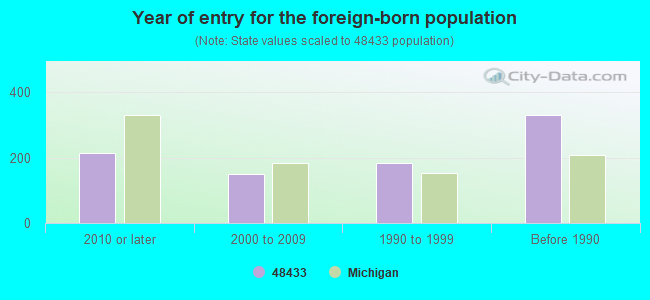
Foreign-born population percentage significantly below state average.
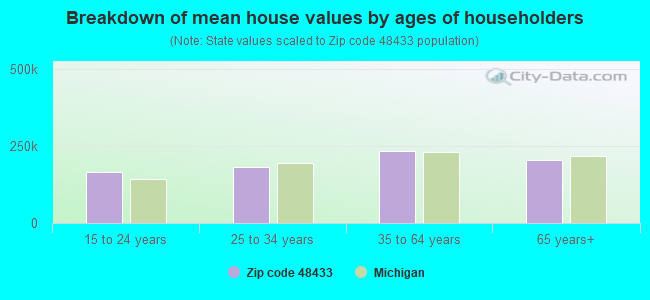
Estimated median house/condo value in 2022: $200,744
48433:
$200,744
Michigan:
$224,400
According to our research of Michigan and other state lists, there were 33 registered sex offenders living in 48433 zip code as of April 27, 2024. The ratio of all residents to sex offenders in zip code 48433 is 808 to 1. The ratio of registered sex offenders to all residents in this zip code is much lower than the state average.
Median resident age:
This zip code:
42.6 years
Michigan median age:
40.3 years
Average household size:
This zip code:
2.5 people
Michigan:
2.4 people
Averages for the 2020 tax year for zip code 48433, filed in 2021:
Average Adjusted Gross Income (AGI) in 2020: $63,312 (Individual Income Tax Returns)
Here:
$63,312
State:
$68,945
Salary/wage: $54,522 (reported on 72.8% of returns)
Here:
$54,522
State:
$57,142
(% of AGI for various income ranges: 901.1% for AGIs below $25k, 2830.4% for AGIs $25k-50k, 5434.7% for AGIs $50k-75k, 8120.3% for AGIs $75k-100k, 14610.5% for AGIs $100k-200k, 69445.0% for AGIs over 200k)
Taxable interest for individuals: $1,140 (reported on 34.3% of returns)
This zip code:
$1,140
Michigan:
$1,630
(% of AGI for various income ranges: 18.2% for AGIs below $25k, 28.0% for AGIs $25k-50k, 44.6% for AGIs $50k-75k, 60.9% for AGIs $75k-100k, 117.1% for AGIs $100k-200k, 1025.0% for AGIs over 200k)
Ordinary dividends: $4,357 (reported on 19.9% of returns)
Here:
$4,357
State:
$6,972
(% of AGI for various income ranges: 31.0% for AGIs below $25k, 50.2% for AGIs $25k-50k, 92.8% for AGIs $50k-75k, 137.3% for AGIs $75k-100k, 272.4% for AGIs $100k-200k, 2661.7% for AGIs over 200k)
Net capital gain/loss in AGI: +$9,319 (reported on 18.8% of returns)
Here:
+$9,319
State:
+$20,064
(% of AGI for various income ranges: 7.6% for AGIs below $25k, 33.6% for AGIs $25k-50k, 61.9% for AGIs $50k-75k, 177.8% for AGIs $75k-100k, 364.3% for AGIs $100k-200k, 12730.0% for AGIs over 200k)
Profit/loss from business: +$8,281 (reported on 13.6% of returns)
Here:
+$8,281
State:
+$11,172
(% of AGI for various income ranges: 61.5% for AGIs below $25k, 84.0% for AGIs $25k-50k, 137.5% for AGIs $50k-75k, 158.7% for AGIs $75k-100k, 369.8% for AGIs $100k-200k, 2317.5% for AGIs over 200k)
Taxable individual retirement arrangement distribution: $18,509 (reported on 11.9% of returns)
48433:
$18,509
Michigan:
$19,803
(% of AGI for various income ranges: 61.4% for AGIs below $25k, 126.0% for AGIs $25k-50k, 267.4% for AGIs $50k-75k, 433.3% for AGIs $75k-100k, 811.6% for AGIs $100k-200k, 4821.7% for AGIs over 200k)
Self-employed (Keogh) retirement plans: $20,067 (reported on 0.2% of returns)
48433:
$20,067
Michigan:
$25,132
(% of AGI for various income ranges: 46.7% for AGIs $100k-200k)
Total itemized deductions: $34,428 (reported on 5.3% of returns)
Here:
$34,428
State:
$34,117
(% of AGI for various income ranges: 51.6% for AGIs below $25k, 76.5% for AGIs $25k-50k, 186.5% for AGIs $50k-75k, 253.1% for AGIs $75k-100k, 524.2% for AGIs $100k-200k, 7399.2% for AGIs over 200k)
Charity contributions: $15,358 (reported on 4.4% of returns)
Here:
$15,358
State:
$13,548
(% of AGI for various income ranges: 3.2% for AGIs below $25k, 11.1% for AGIs $25k-50k, 43.1% for AGIs $50k-75k, 61.5% for AGIs $75k-100k, 163.3% for AGIs $100k-200k, 4493.3% for AGIs over 200k)
Taxes paid: $7,272 (reported on 5.3% of returns)
48433:
$7,272
State:
$7,972
(% of AGI for various income ranges: 7.5% for AGIs below $25k, 14.6% for AGIs $25k-50k, 47.3% for AGIs $50k-75k, 73.5% for AGIs $75k-100k, 151.2% for AGIs $100k-200k, 962.5% for AGIs over 200k)
Earned income credit: $2,068 (reported on 12.2% of returns)
Here:
$2,068
State:
$2,251
(% of AGI for various income ranges: 62.1% for AGIs below $25k, 61.2% for AGIs $25k-50k, 1.6% for AGIs $50k-75k)
Percentage of individuals using paid preparers for their 2020 taxes: 93.9%
Here:
94%
State:
93%
(% for various income ranges: 92.8% for AGIs below $25k, 94.4% for AGIs $25k-50k, 94.3% for AGIs $50k-75k, 93.4% for AGIs $75k-100k, 95.1% for AGIs $100k-200k, 94.9% for AGIs over 200k)
Averages for the 2012 tax year for zip code 48433, filed in 2013:
Average Adjusted Gross Income (AGI) in 2012: $56,458 (Individual Income Tax Returns)
Here:
$56,458
State:
$55,609
Salary/wage: $44,639 (reported on 79.1% of returns)
Here:
$44,639
State:
$46,782
(% of AGI for various income ranges: 56.6% for AGIs below $25k, 57.9% for AGIs $25k-50k, 62.9% for AGIs $50k-75k, 65.6% for AGIs $75k-100k, 72.9% for AGIs $100k-200k, 49.2% for AGIs over 200k)
Taxable interest for individuals: $1,195 (reported on 40.0% of returns)
This zip code:
$1,195
Michigan:
$1,491
(% of AGI for various income ranges: 1.6% for AGIs below $25k, 1.0% for AGIs $25k-50k, 0.7% for AGIs $50k-75k, 0.6% for AGIs $75k-100k, 0.6% for AGIs $100k-200k, 1.1% for AGIs over 200k)
Ordinary dividends: $3,586 (reported on 23.6% of returns)
Here:
$3,586
State:
$6,225
(% of AGI for various income ranges: 2.1% for AGIs below $25k, 1.4% for AGIs $25k-50k, 1.4% for AGIs $50k-75k, 1.4% for AGIs $75k-100k, 1.3% for AGIs $100k-200k, 1.8% for AGIs over 200k)
Net capital gain/loss in AGI: +$4,470 (reported on 19.6% of returns)
Here:
+$4,470
State:
+$9,326
(% of AGI for various income ranges: 0.2% for AGIs $50k-75k, 0.2% for AGIs $75k-100k, 0.8% for AGIs $100k-200k, 7.5% for AGIs over 200k)
Profit/loss from business: +$10,566 (reported on 14.2% of returns)
Here:
+$10,566
State:
+$11,523
(% of AGI for various income ranges: 6.3% for AGIs below $25k, 2.2% for AGIs $25k-50k, 1.9% for AGIs $50k-75k, 1.7% for AGIs $75k-100k, 1.8% for AGIs $100k-200k, 4.3% for AGIs over 200k)
Taxable individual retirement arrangement distribution: $13,184 (reported on 14.7% of returns)
48433:
$13,184
Michigan:
$15,298
(% of AGI for various income ranges: 3.5% for AGIs below $25k, 3.5% for AGIs $25k-50k, 3.9% for AGIs $50k-75k, 4.1% for AGIs $75k-100k, 3.6% for AGIs $100k-200k, 2.0% for AGIs over 200k)
Self-employment retirement plans: $20,040 (reported on 0.4% of returns)
48433:
$20,040
Michigan:
$20,834
Total itemized deductions: $19,682 (19% of AGI, reported on 34.2% of returns)
Here:
$19,682
State:
$21,628
Here:
19.3% of AGI
State:
18.4% of AGI
(% of AGI for various income ranges: 11.1% for AGIs below $25k, 10.7% for AGIs $25k-50k, 11.2% for AGIs $50k-75k, 12.5% for AGIs $75k-100k, 13.4% for AGIs $100k-200k, 11.0% for AGIs over 200k)
Charity contributions: $3,780 (reported on 30.0% of returns)
Here:
$3,780
State:
$4,225
(% of AGI for various income ranges: 1.0% for AGIs below $25k, 1.5% for AGIs $25k-50k, 1.7% for AGIs $50k-75k, 2.1% for AGIs $75k-100k, 2.3% for AGIs $100k-200k, 2.5% for AGIs over 200k)
Taxes paid: $7,010 (reported on 34.1% of returns)
48433:
$7,010
State:
$8,327
(% of AGI for various income ranges: 2.1% for AGIs below $25k, 2.7% for AGIs $25k-50k, 3.5% for AGIs $50k-75k, 4.1% for AGIs $75k-100k, 5.4% for AGIs $100k-200k, 5.4% for AGIs over 200k)
Earned income credit: $2,073 (reported on 13.6% of returns)
Here:
$2,073
State:
$2,306
(% of AGI for various income ranges: 5.1% for AGIs below $25k, 0.8% for AGIs $25k-50k)
Percentage of individuals using paid preparers for their 2012 taxes: 62.3%
Here:
62%
State:
57%
(% for various income ranges: 57.5% for AGIs below $25k, 61.6% for AGIs $25k-50k, 64.9% for AGIs $50k-75k, 65.7% for AGIs $75k-100k, 68.4% for AGIs $100k-200k, 82.8% for AGIs over 200k)
Averages for the 2004 tax year for zip code 48433, filed in 2005:
Average Adjusted Gross Income (AGI) in 2004: $51,093 (Individual Income Tax Returns)
Here:
$51,093
State:
$48,204
Salary/wage: $44,849 (reported on 83.4% of returns)
Here:
$44,849
State:
$42,791
(% of AGI for various income ranges: 97.2% for AGIs below $10k, 53.7% for AGIs $10k-25k, 63.4% for AGIs $25k-50k, 74.1% for AGIs $50k-75k, 81.4% for AGIs $75k-100k, 75.0% for AGIs over 100k)
Taxable interest for individuals: $1,598 (reported on 57.2% of returns)
This zip code:
$1,598
Michigan:
$1,725
(% of AGI for various income ranges: 5.3% for AGIs below $10k, 4.4% for AGIs $10k-25k, 2.4% for AGIs $25k-50k, 1.6% for AGIs $50k-75k, 1.1% for AGIs $75k-100k, 1.4% for AGIs over 100k)
Taxable dividends: $2,385 (reported on 32.6% of returns)
Here:
$2,385
State:
$3,420
(% of AGI for various income ranges: 3.3% for AGIs below $10k, 2.8% for AGIs $10k-25k, 1.6% for AGIs $25k-50k, 1.3% for AGIs $50k-75k, 1.0% for AGIs $75k-100k, 1.6% for AGIs over 100k)
Net capital gain/loss: +$3,196 (reported on 24.3% of returns)
Here:
+$3,196
State:
+$8,532
(% of AGI for various income ranges: -2.1% for AGIs below $10k, -0.1% for AGIs $10k-25k, 0.3% for AGIs $25k-50k, 0.5% for AGIs $50k-75k, 0.6% for AGIs $75k-100k, 3.3% for AGIs over 100k)
Profit/loss from business: +$8,679 (reported on 14.4% of returns)
Here:
+$8,679
State:
+$9,547
(% of AGI for various income ranges: 5.2% for AGIs below $10k, 4.4% for AGIs $10k-25k, 2.7% for AGIs $25k-50k, 1.9% for AGIs $50k-75k, 1.5% for AGIs $75k-100k, 2.7% for AGIs over 100k)
IRA payment deduction: $3,236 (reported on 2.0% of returns)
48433:
$3,236
Michigan:
$2,875
(% of AGI for various income ranges: 0.2% for AGIs $10k-25k, 0.2% for AGIs $25k-50k, 0.1% for AGIs $50k-75k, 0.1% for AGIs $75k-100k, 0.1% for AGIs over 100k)
Self-employed pension: $16,508 (reported on 0.5% of returns)
Here:
$16,508
Michigan:
$13,826
(% of AGI for various income ranges: 0.1% for AGIs $50k-75k, 0.0% for AGIs $75k-100k, 0.4% for AGIs over 100k)
Total itemized deductions: $17,485 (21% of AGI, reported on 43.5% of returns)
Here:
$17,485
State:
$18,509
Here:
20.7% of AGI
State:
20.7% of AGI
(% of AGI for various income ranges: 14.5% for AGIs below $10k, 12.0% for AGIs $10k-25k, 15.5% for AGIs $25k-50k, 16.1% for AGIs $50k-75k, 16.1% for AGIs $75k-100k, 14.0% for AGIs over 100k)
Charity contributions deductions: $3,104 (4% of AGI, reported on 40.3% of returns)
Here:
$3,104
State:
$3,365
Here:
3.6% of AGI
State:
3.6% of AGI
(% of AGI for various income ranges: 0.8% for AGIs below $10k, 1.7% for AGIs $10k-25k, 1.9% for AGIs $25k-50k, 2.4% for AGIs $50k-75k, 2.5% for AGIs $75k-100k, 2.9% for AGIs over 100k)
Total tax: $7,394 (reported on 79.7% of returns)
48433:
$7,394
State:
$7,691
(% of AGI for various income ranges: 3.0% for AGIs below $10k, 4.0% for AGIs $10k-25k, 6.8% for AGIs $25k-50k, 8.8% for AGIs $50k-75k, 10.1% for AGIs $75k-100k, 17.0% for AGIs over 100k)
Earned income credit: $1,619 (reported on 8.5% of returns)
Here:
$1,619
State:
$1,737
Percentage of individuals using paid preparers for their 2004 taxes: 64.8%
Here:
65%
State:
60%
(% for various income ranges: 55.3% for AGIs below $10k, 65.8% for AGIs $10k-25k, 66.0% for AGIs $25k-50k, 67.7% for AGIs $50k-75k, 67.8% for AGIs $75k-100k, 69.8% for AGIs over 100k)
Household received Food Stamps/SNAP in the past 12 months: 1,009 Household did not receive Food Stamps/SNAP in the past 12 months: 9,174
Women who had a birth in the past 12 months: 194 (116 now married, 77 unmarried) Women who did not have a birth in the past 12 months: 5,182 (2,113 now married, 3,067 unmarried)
Housing units in zip code 48433 with a mortgage: 5,666 (365 second mortgage, 279 both second mortgage and home equity loan) Houses without a mortgage: 203
Median monthly owner costs for units with a mortgage: $1,438 Median monthly owner costs for units without a mortgage: $603
Residents with income below the poverty level in 2022:
This zip code:
10.9%
Whole state:
13.4%
Residents with income below 50% of the poverty level in 2022:
This zip code:
8.1%
Whole state:
6.9%
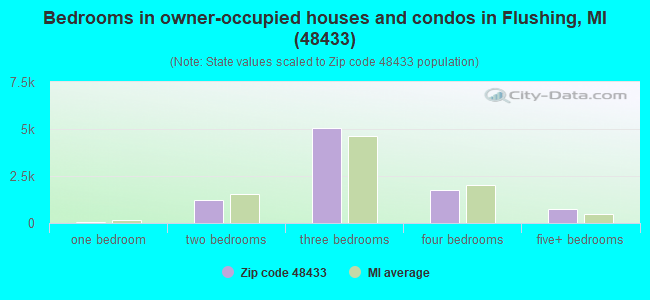
Median number of rooms in houses and condos:
Here:
6.8
State:
6.5
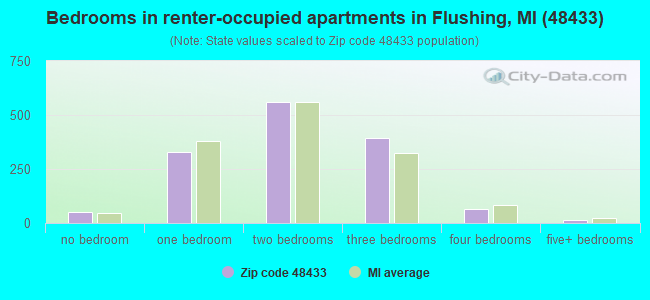
Median number of rooms in apartments:
Here:
4.2
State:
4.3
Notable locations in this zip code not listed on our city pages
Notable locations in zip code 48433: Flushing Valley Country Club (A), Brent Creek Station (B), Flushing Station (C), Flushing City Hall (D), Flushing Library (E), Flushing Fire Department (F), Flushing Police Department (G), Flushing Area Museum (H). Display/hide their locations on the map
Churches in zip code 48433 include: King of Glory Lutheran Church (A), Westwood Church of God (B), First Christian Church (C), Saint Michael Byzantine Catholic Church (D), Westside Baptist Church (E), Kingdom Hall of Jehovah's Witnesses (F), Mayfair Bible Church (G), Trinity Baptist Church (H), Judah Full Gospel Baptist Church (I). Display/hide their locations on the map
Parks in zip code 48433 include: Amos Woodruff Historical Marker (1), Amos Woodruff House Historical Marker (2), First Methodist Episcopal Church Historical Marker (3), Harrison Homestead Historical Marker (4), Brent Creek United Methodist Church Historical Marker (5), Eastview Park (6), River Road Park (7), Flushing Park (8), Mutton Park (9). Display/hide their locations on the map
In group quarters: 236 (-1 institutionalized population)
Size of family households: 3,628 2-persons, 1,256 3-persons, 1,277 4-persons, 536 5-persons, 223 6-persons, 179 7-or-more-persons
Size of nonfamily households: 2,609 1-person, 428 2-persons, 57 3-persons
4,267 married couples with children.
1,383 single-parent households (307 men, 1,076 women).
95.3% of residents of 48433 zip code speak English at home.
1.3% of residents speak Spanish at home (60% very well, 27% well, 6% not well, 7% not at all).
1.0% of residents speak other Indo-European language at home (76% very well, 17% well, 7% not well).
0.1% of residents speak Asian or Pacific Island language at home (100% very well).
2.4% of residents speak other language at home (68% very well, 25% well, 7% not well).
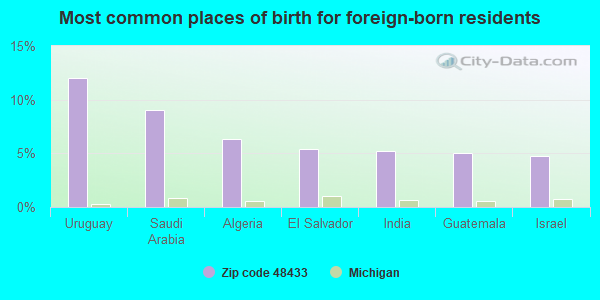
Foreign born population: 641 (2.5%) (84.1% of them are naturalized citizens)
This zip code:
2.5%
Whole state:
6.9%
12%Uruguay
9%Saudi Arabia
6%Algeria
5%El Salvador
5%India
5%Guatemala
5%Israel
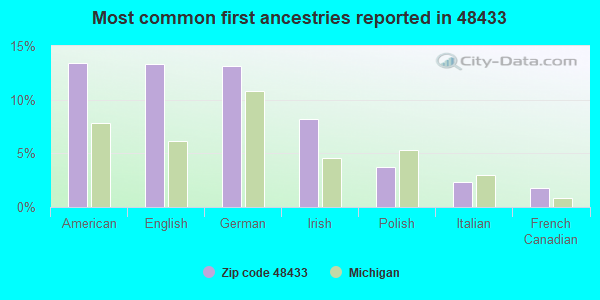
13%American
13%English
13%German
8%Irish
4%Polish
2%Italian
2%French Canadian
Year of entry for the foreign-born population
2132010 or later
1502000 to 2009
1821990 to 1999
329Before 1990
Major facilities with environmental interests located in this zip code:
FLUSHING HIGH SCHOOL (5039 DELAND ROAD in FLUSHING, MI)
(Geographic Names Information System) (National Center for Education Statistics) - STATE ID-01256 Organizations: FLUSHING COMMUNITY SCHOOLS (SCHOOL DISTRICT)
FLUSHING JUNIOR HIGH SCHOOL (409 CHAMBERLAIN STREET in FLUSHING, MI)
(National Center for Education Statistics) - STATE ID-01257 Organizations: FLUSHING COMMUNITY SCHOOLS (SCHOOL DISTRICT)
ELMS ELEMENTARY SCHOOL (6125 N. ELMS ROAD in FLUSHING, MI)
(National Center for Education Statistics) - STATE ID-01125 Organizations: FLUSHING COMMUNITY SCHOOLS (SCHOOL DISTRICT)
FLUSHING WWTP (140 INDUSTRIAL DRIVE in FLUSHING, MI)
National Pollutant Discharge Elimination System MAJOR (Tracking pollutant discharge elimination systems) - permit National Pollutant Discharge Elimination System NON-MAJOR (Tracking pollutant discharge elimination systems) - permit Business SIC classification: SEWERAGE SYSTEMS Organizations: FLUSHING, CITY OF (CONTACT/OWNER)
Alternative names: CITY OF FLUSHING
FLUSHING TWP WATER PROJECT (10639 WM T MORRIS RD in FLUSHING, MI)
(Resource Conservation and Recovery Act (tracking hazardous waste))
ALS FURNITURE CLINIC (730 E MAIN ST in FLUSHING, MI)
(Resource Conservation and Recovery Act (tracking hazardous waste))
FLUSHING SERVICE CENTER (1560 EAST PIERSON ROAD in FLUSHING, MI)
(Resource Conservation and Recovery Act (tracking hazardous waste))
AUTO PRIDE COLLISION OF FLUSHING INC (G6034 W PIERSON ROAD in FLUSHING, MI)
Conditionally Exempt Small Quantity Generators, less than 100 kg/month of hazardous waste (Resource Conservation and Recovery Act (tracking hazardous waste)) Organizations: ROBERT DUNIGAN (CONTACT/OWNER)
Conditionally Exempt Small Quantity Generators, less than 100 kg/month of hazardous waste (Resource Conservation and Recovery Act (tracking hazardous waste))
FLUSHING CITY OF DPW GARAGE (230 S MCKINLEY in FLUSHING, MI)
Conditionally Exempt Small Quantity Generators, less than 100 kg/month of hazardous waste (Resource Conservation and Recovery Act (tracking hazardous waste)) - notification
FLUSHING COMMUNITY SCHOOLS (522 N MCKINLEY STREET in FLUSHING, MI)
COMPLIANCE ACTIVITY (Tracking inspections of insecticide, fungicide, and rodenticide, and toxic substances)
FLUSHING COUNTY PARK (4416 MCKINLEY RD in FLUSHING, MI)
Conditionally Exempt Small Quantity Generators, less than 100 kg/month of hazardous waste (Resource Conservation and Recovery Act (tracking hazardous waste)) - notification Organizations: COUNTY OF GENESEE PARKS AND REC COMM (CONTACT/OPERATOR)
Alternative names: FLUSHING CO PK
Housing units lacking complete plumbing facilities: 1.4% Housing units lacking complete kitchen facilities: 2.1%
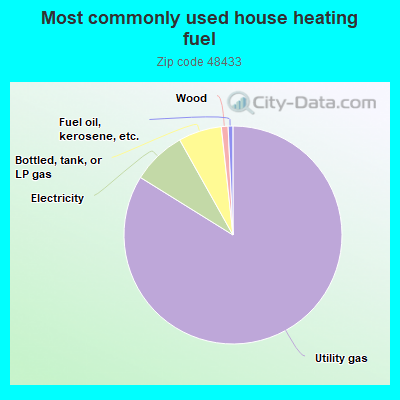
83.6%Utility gas
8.0%Electricity
6.4%Bottled, tank, or LP gas
1.0%Wood
0.7%Fuel oil, kerosene, etc.
Population in 1990: 23,082. Population change in the 1990s: +2,039 (+8.8%).
Place of birth for U.S.-born residents:
This state: 21,340
Northeast: 368
Midwest: 995
South: 1,439
West: 698
63% of the 48433 zip code residents lived in the same house 5 years ago. Out of people who lived in different houses, 75% lived in this county. Out of people who lived in different counties, 50% lived in Michigan.
92% of the 48433 zip code residents lived in the same house 1 year ago. Out of people who lived in different houses, 68% moved from this county. Out of people who lived in different houses, 20% moved from different county within same state. Out of people who lived in different houses, 9% moved from different state. Out of people who lived in different houses, 3% moved from abroad.
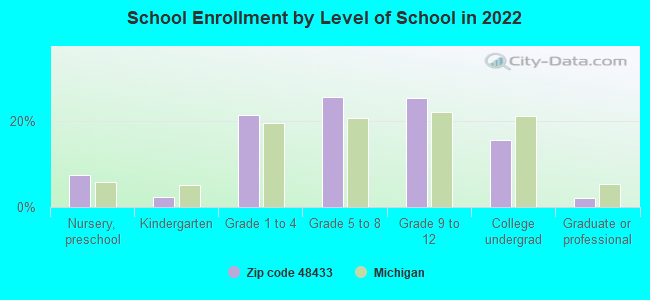
Private vs. public school enrollment:
Students in private schools in grades 1 to 8 (elementary and middle school): 225
Here:
7.4%
Michigan:
12.4%
Students in private schools in grades 9 to 12 (high school): 65
Here:
4.0%
Michigan:
9.8%
Students in private undergraduate colleges: 91
Here:
9.0%
Michigan:
14.9%
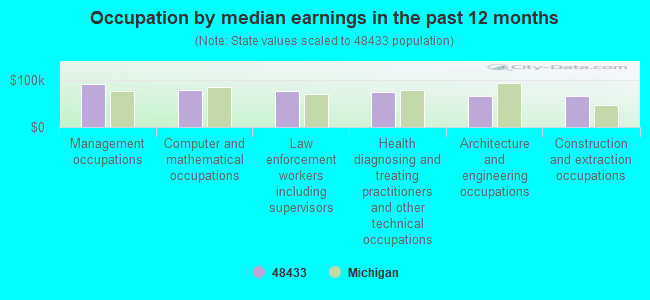
Occupation by median earnings in the past 12 months ($)
91,468Management occupations
77,921Computer and mathematical occupations
75,928Law enforcement workers including supervisors
73,955Health diagnosing and treating practitioners and other technical occupations
66,179Architecture and engineering occupations
65,665Construction and extraction occupations
Companies with federal contracts located in this zip code:
KING PAR CORPORATION (G-5140 FLUSHING RD in FLUSHING, MI; small business)
$4,750 with Air Force for Athletic and Sporting Equipment. Signed on 2006-05-04. Completion date: 2006-05-22.
Top industries in this zip code by the number of employees in 2005:
Administrative and Support and Waste Management and Remediation Services: Office Administrative Services (250-499 employees: 1 establishment, 1-4 employees: 1 establishment)
2002 - 2018 National Fire Incident Reporting System (NFIRS) incidents
According to the data from the years 2002 - 2018 the average number of fires per year is 66. The highest number of fires - 89 took place in 2017, and the least - 46 in 2012. The data has a dropping trend.
When looking into fire subcategories, the most reports belonged to: Structure Fires (64.1%), and Outside Fires (19.3%).
Fire incident types reported to NFIRS in Zip Code 48433
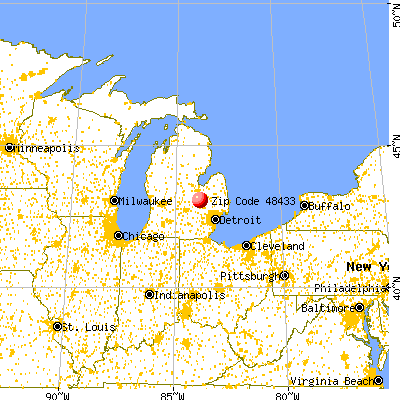


 Nearest zip codes: 48532, 48449, 48457, 48504, 48554, 48460.


 According to the data from the years 2002 - 2018 the average number of fires per year is 66. The highest number of fires - 89 took place in 2017, and the least - 46 in 2012. The data has a dropping trend.
 When looking into fire subcategories, the most reports belonged to: Structure Fires (64.1%), and Outside Fires (19.3%).