Estimated zip code population in 2022: 1,263 Zip code population in 2010: 1,294 Zip code population in 2000: 1,397
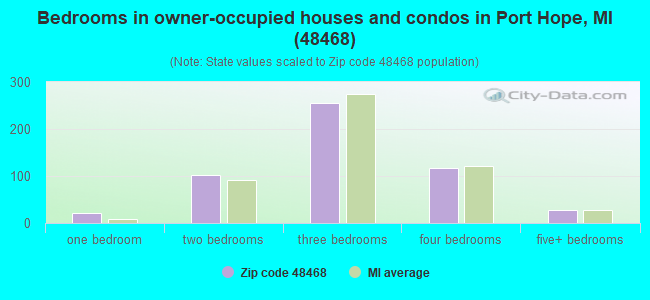
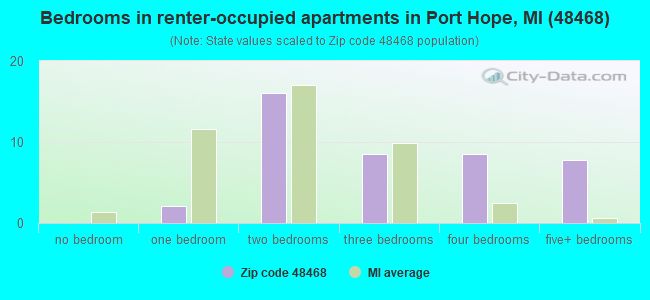
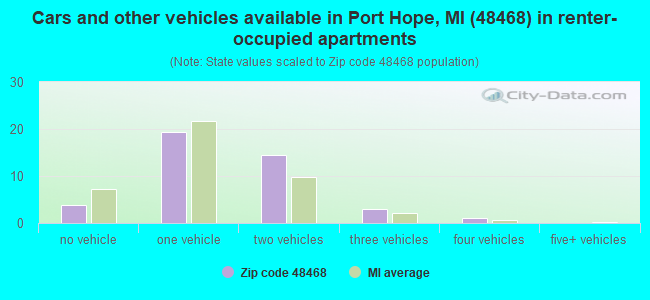
Houses and condos: 1,049 Renter-occupied apartments: 41
% of renters here:
7%
State:
27%
March 2022 cost of living index in zip code 48468: 79.8 (low, U.S. average is 100)
Land area: 63.7 sq. mi. Water area: 9.2 sq. mi.
Population density: 20 people per square mile
(very low).
OSM Map
General Map
Google Map
MSN Map
OSM Map
General Map
Google Map
MSN Map
OSM Map
General Map
Google Map
MSN Map
OSM Map
General Map
Google Map
MSN Map
Please wait while loading the map...
Real estate property taxes paid for housing units in 2022:
This zip code:
1.1% ($1,382)
Michigan:
1.2% ($2,746)
Median real estate property taxes paid for housing units with mortgages in 2022: $1,446 (1.1%) Median real estate property taxes paid for housing units with no mortgage in 2022: $1,328 (1.1%)
Business Search- 14 Million verified businesses
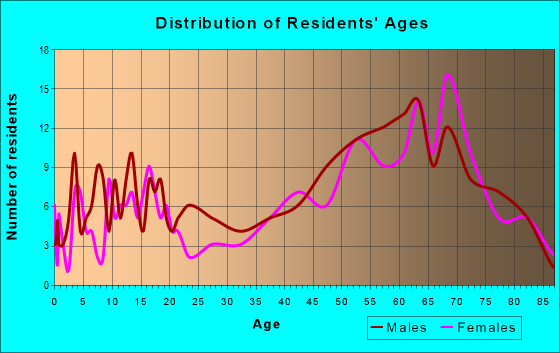
Males: 697
(55.3%)
Females: 564
(44.7%)
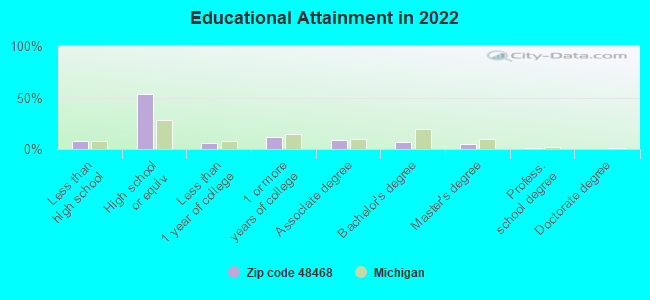
For population 25 years and over in 48468:
High school or higher: 91.1%
Bachelor's degree or higher: 13.1%
Graduate or professional degree: 6.1%
Unemployed: 6.3%
Mean travel time to work (commute): 23.4 minutes
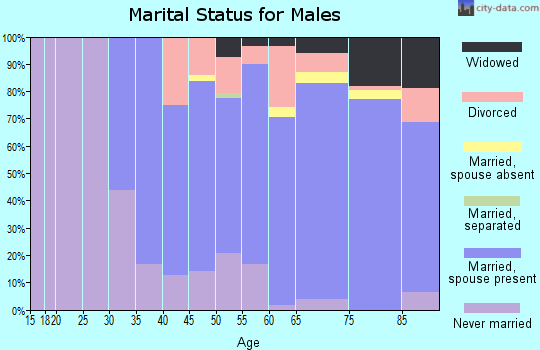
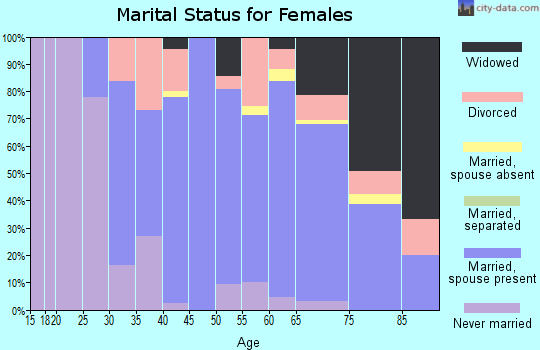
For population 15 years and over in 48468:
Never married: 25.3%
Now married: 57.3%
Separated: 0.8%
Widowed: 9.3%
Divorced: 7.3%
Zip code 48468 compared to state average:
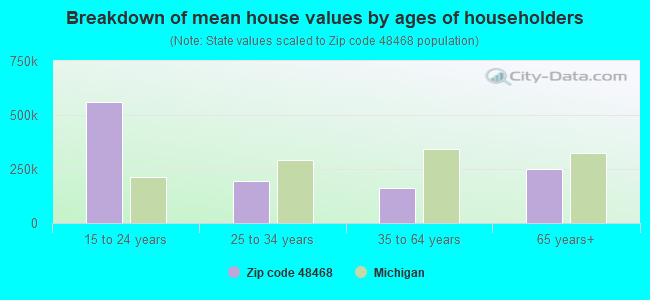
Median house value below state average.
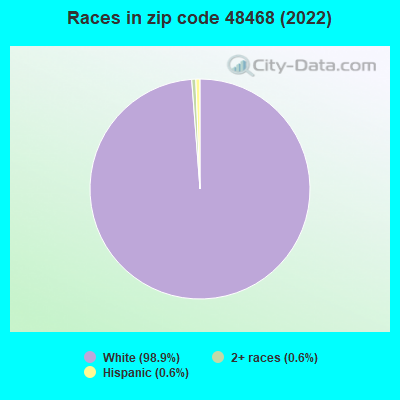
Black race population percentage significantly below state average.
Hispanic race population percentage significantly below state average.
Median age significantly above state average.
Foreign-born population percentage significantly below state average.
Renting percentage significantly below state average.
Length of stay since moving in significantly above state average.
Number of college students significantly below state average.
Percentage of population with a bachelor's degree or higher below state average.
Estimated median house/condo value in 2022: $124,530
48468:
$124,530
Michigan:
$224,400
According to our research of Michigan and other state lists, there were 4 registered sex offenders living in 48468 zip code as of April 27, 2024. The ratio of all residents to sex offenders in zip code 48468 is 302 to 1. The ratio of registered sex offenders to all residents in this zip code is near the state average.
Median resident age:
This zip code:
59.7 years
Michigan median age:
40.3 years
Average household size:
This zip code:
2.2 people
Michigan:
2.4 people
Averages for the 2020 tax year for zip code 48468, filed in 2021:
Average Adjusted Gross Income (AGI) in 2020: $48,968 (Individual Income Tax Returns)
Here:
$48,968
State:
$68,945
Salary/wage: $38,654 (reported on 63.1% of returns)
Here:
$38,654
State:
$57,142
(% of AGI for various income ranges: 1078.6% for AGIs below $25k, 3332.7% for AGIs $25k-50k, 5536.0% for AGIs $50k-75k, 8646.7% for AGIs $75k-100k, 17700.0% for AGIs $100k-200k)
Taxable interest for individuals: $1,828 (reported on 38.5% of returns)
This zip code:
$1,828
Michigan:
$1,630
(% of AGI for various income ranges: 43.6% for AGIs below $25k, 53.6% for AGIs $25k-50k, 110.0% for AGIs $50k-75k, 126.7% for AGIs $75k-100k, 813.3% for AGIs $100k-200k)
Ordinary dividends: $3,364 (reported on 21.5% of returns)
Here:
$3,364
State:
$6,972
(% of AGI for various income ranges: 37.9% for AGIs below $25k, 93.6% for AGIs $25k-50k, 296.7% for AGIs $75k-100k, 753.3% for AGIs $100k-200k)
Net capital gain/loss in AGI: +$6,775 (reported on 18.5% of returns)
Here:
+$6,775
State:
+$20,064
(% of AGI for various income ranges: 12.1% for AGIs below $25k, 24.5% for AGIs $25k-50k, 492.0% for AGIs $50k-75k, 1743.3% for AGIs $100k-200k)
Profit/loss from business: +$3,211 (reported on 13.8% of returns)
Here:
+$3,211
State:
+$11,172
(% of AGI for various income ranges: 110.0% for AGIs below $25k, 42.7% for AGIs $25k-50k, 176.0% for AGIs $50k-75k)
Taxable individual retirement arrangement distribution: $14,160 (reported on 23.1% of returns)
48468:
$14,160
Michigan:
$19,803
(% of AGI for various income ranges: 236.4% for AGIs below $25k, 308.2% for AGIs $25k-50k, 1392.0% for AGIs $50k-75k, 2526.7% for AGIs $100k-200k)
Total itemized deductions: $35,133 (reported on 4.6% of returns)
Here:
$35,133
State:
$34,117
(% of AGI for various income ranges: 2108.0% for AGIs $50k-75k)
Charity contributions: $16,000 (reported on 3.1% of returns)
Here:
$16,000
State:
$13,548
(% of AGI for various income ranges: 290.9% for AGIs $25k-50k)
Taxes paid: $5,333 (reported on 4.6% of returns)
48468:
$5,333
State:
$7,972
(% of AGI for various income ranges: 320.0% for AGIs $50k-75k)
Earned income credit: $2,300 (reported on 7.7% of returns)
Here:
$2,300
State:
$2,251
(% of AGI for various income ranges: 82.1% for AGIs below $25k)
Percentage of individuals using paid preparers for their 2020 taxes: 92.3%
Here:
92%
State:
93%
(% for various income ranges: 96.2% for AGIs below $25k, 88.2% for AGIs $25k-50k, 87.5% for AGIs $50k-75k, 100.0% for AGIs $75k-100k, 87.5% for AGIs $100k-200k)
Averages for the 2012 tax year for zip code 48468, filed in 2013:
Average Adjusted Gross Income (AGI) in 2012: $39,655 (Individual Income Tax Returns)
Here:
$39,655
State:
$55,609
Salary/wage: $29,224 (reported on 68.3% of returns)
Here:
$29,224
State:
$46,782
(% of AGI for various income ranges: 54.6% for AGIs below $25k, 53.3% for AGIs $25k-50k, 61.4% for AGIs $50k-75k, 46.1% for AGIs $75k-100k, 35.9% for AGIs $100k-200k)
Taxable interest for individuals: $1,380 (reported on 50.0% of returns)
This zip code:
$1,380
Michigan:
$1,491
(% of AGI for various income ranges: 2.8% for AGIs below $25k, 2.3% for AGIs $25k-50k, 1.3% for AGIs $50k-75k, 1.9% for AGIs $75k-100k, 0.7% for AGIs $100k-200k)
Ordinary dividends: $2,759 (reported on 28.3% of returns)
Here:
$2,759
State:
$6,225
(% of AGI for various income ranges: 2.4% for AGIs below $25k, 1.4% for AGIs $25k-50k, 1.4% for AGIs $50k-75k, 5.6% for AGIs $75k-100k)
Net capital gain/loss in AGI: +$646 (reported on 21.7% of returns)
Here:
+$646
State:
+$9,326
(% of AGI for various income ranges: 2.8% for AGIs $75k-100k)
Profit/loss from business: +$3,125 (reported on 13.3% of returns)
Here:
+$3,125
State:
+$11,523
(% of AGI for various income ranges: 4.6% for AGIs below $25k, 0.7% for AGIs $25k-50k, 1.0% for AGIs $50k-75k)
Taxable individual retirement arrangement distribution: $9,585 (reported on 21.7% of returns)
48468:
$9,585
Michigan:
$15,298
(% of AGI for various income ranges: 5.5% for AGIs below $25k, 5.2% for AGIs $25k-50k, 4.9% for AGIs $50k-75k, 11.9% for AGIs $75k-100k)
Total itemized deductions: $18,033 (27% of AGI, reported on 15.0% of returns)
Here:
$18,033
State:
$21,628
Here:
27.4% of AGI
State:
18.4% of AGI
Charity contributions: $3,525 (reported on 13.3% of returns)
Here:
$3,525
State:
$4,225
Taxes paid: $4,656 (reported on 15.0% of returns)
48468:
$4,656
State:
$8,327
Earned income credit: $1,638 (reported on 13.3% of returns)
Here:
$1,638
State:
$2,306
(% of AGI for various income ranges: 3.9% for AGIs below $25k)
Percentage of individuals using paid preparers for their 2012 taxes: 71.7%
Here:
72%
State:
57%
(% for various income ranges: 70.4% for AGIs below $25k, 75.0% for AGIs $25k-50k, 66.7% for AGIs $50k-75k, 80.0% for AGIs $75k-100k, 66.7% for AGIs $100k-200k)
Averages for the 2004 tax year for zip code 48468, filed in 2005:
Average Adjusted Gross Income (AGI) in 2004: $32,465 (Individual Income Tax Returns)
Here:
$32,465
State:
$48,204
Salary/wage: $26,779 (reported on 68.9% of returns)
Here:
$26,779
State:
$42,791
(% of AGI for various income ranges: 79.5% for AGIs below $10k, 42.4% for AGIs $10k-25k, 64.0% for AGIs $25k-50k, 63.7% for AGIs $50k-75k, 69.0% for AGIs $75k-100k, 38.4% for AGIs over 100k)
Taxable interest for individuals: $1,769 (reported on 67.1% of returns)
This zip code:
$1,769
Michigan:
$1,725
(% of AGI for various income ranges: 15.4% for AGIs below $10k, 7.1% for AGIs $10k-25k, 2.5% for AGIs $25k-50k, 3.7% for AGIs $50k-75k, 1.2% for AGIs $75k-100k, 2.3% for AGIs over 100k)
Taxable dividends: $2,185 (reported on 30.2% of returns)
Here:
$2,185
State:
$3,420
(% of AGI for various income ranges: 4.1% for AGIs below $10k, 3.1% for AGIs $10k-25k, 2.0% for AGIs $25k-50k, 2.5% for AGIs $50k-75k, 0.6% for AGIs $75k-100k, 1.1% for AGIs over 100k)
Net capital gain/loss: +$3,449 (reported on 25.2% of returns)
Here:
+$3,449
State:
+$8,532
(% of AGI for various income ranges: -4.5% for AGIs below $10k, 0.8% for AGIs $10k-25k, 1.0% for AGIs $25k-50k, 5.0% for AGIs $50k-75k, 6.4% for AGIs over 100k)
Profit/loss from business: +$3,126 (reported on 16.7% of returns)
Here:
+$3,126
State:
+$9,547
(% of AGI for various income ranges: 13.1% for AGIs below $10k, 3.7% for AGIs $10k-25k, 2.3% for AGIs $25k-50k, 0.2% for AGIs $50k-75k)
IRA payment deduction: $1,667 (reported on 2.7% of returns)
48468:
$1,667
Michigan:
$2,875
Total itemized deductions: $15,115 (26% of AGI, reported on 19.6% of returns)
Here:
$15,115
State:
$18,509
Here:
25.8% of AGI
State:
20.7% of AGI
(% of AGI for various income ranges: 12.8% for AGIs $10k-25k, 9.7% for AGIs $25k-50k, 6.8% for AGIs $50k-75k, 6.6% for AGIs $75k-100k, 11.1% for AGIs over 100k)
Charity contributions deductions: $2,691 (5% of AGI, reported on 16.6% of returns)
Here:
$2,691
State:
$3,365
Here:
4.5% of AGI
State:
3.6% of AGI
(% of AGI for various income ranges: 1.6% for AGIs $10k-25k, 1.1% for AGIs $25k-50k, 1.0% for AGIs $50k-75k, 1.5% for AGIs $75k-100k, 2.3% for AGIs over 100k)
Total tax: $4,021 (reported on 72.4% of returns)
48468:
$4,021
State:
$7,691
(% of AGI for various income ranges: 4.5% for AGIs below $10k, 3.5% for AGIs $10k-25k, 6.5% for AGIs $25k-50k, 8.8% for AGIs $50k-75k, 11.8% for AGIs $75k-100k, 16.4% for AGIs over 100k)
Earned income credit: $1,410 (reported on 12.5% of returns)
Here:
$1,410
State:
$1,737
Percentage of individuals using paid preparers for their 2004 taxes: 74.5%
Here:
75%
State:
60%
(% for various income ranges: 68.5% for AGIs below $10k, 76.0% for AGIs $10k-25k, 75.2% for AGIs $25k-50k, 82.4% for AGIs $50k-75k, 72.4% for AGIs $75k-100k, 73.9% for AGIs over 100k)
Likely homosexual households (counted as self-reported same-sex unmarried-partner households)
Lesbian couples: 0.0% of all households
Gay men: 0.2% of all households
Household received Food Stamps/SNAP in the past 12 months: 38 Household did not receive Food Stamps/SNAP in the past 12 months: 521
Women who had a birth in the past 12 months: 5 (0 now married, 5 unmarried) Women who did not have a birth in the past 12 months: 125 (48 now married, 77 unmarried)
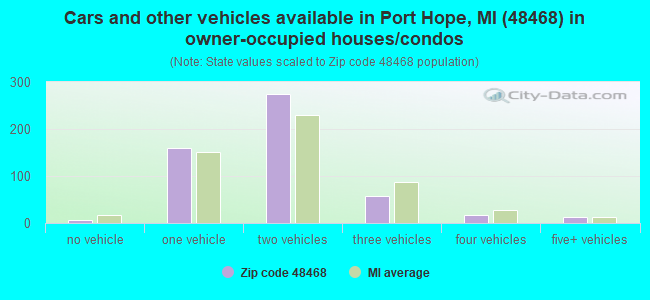
Housing units in zip code 48468 with a mortgage: 228 (12 second mortgage, 8 both second mortgage and home equity loan) Houses without a mortgage: 6
Median monthly owner costs for units with a mortgage: $933 Median monthly owner costs for units without a mortgage: $415
Residents with income below the poverty level in 2022:
This zip code:
11.7%
Whole state:
13.4%
Residents with income below 50% of the poverty level in 2022:
This zip code:
6.4%
Whole state:
6.9%
Median number of rooms in houses and condos:
Here:
6.6
State:
6.5
Median number of rooms in apartments:
Here:
5.4
State:
4.3
Notable locations in this zip code not listed on our city pages
Notable locations in zip code 48468: Pie aux Barques Light (A), Pointe Aux Barques Lighthouse (B), Huron City Museum (C), Village of Port Hope Fire Department (D), Pointe Aux Barques Lighthouse Museum (E). Display/hide their locations on the map
Cemeteries: Gore Cemetery (1), Lake View Cemetery (2), Marquardt Cemetery (3), Port Hope Cemetery (4), Ludington Cemetery (5). Display/hide their locations on the map
Parks in zip code 48468 include: Stafford County Park (1), Port Hope Chimney Historical Marker (2), Huron City Historical Marker (3), Pointe aux Barques Lighthouse Historical Marker (4), Lighthouse County Park (5). Display/hide their locations on the map
In group quarters: 2 (-1 institutionalized population)
Size of family households: 244 2-persons, 61 3-persons, 45 4-persons, 16 5-persons, 5 6-persons, 5 7-or-more-persons
Size of nonfamily households: 174 1-person, 11 2-persons
70 married couples with children.
23 single-parent households (17 men, 6 women).
100.1% of residents of 48468 zip code speak English at home.
0.1% of residents speak Spanish at home (100% very well).
0.3% of residents speak other Indo-European language at home (100% very well).
0.1% of residents speak Asian or Pacific Island language at home (100% very well).
0.2% of residents speak other language at home (100% very well).
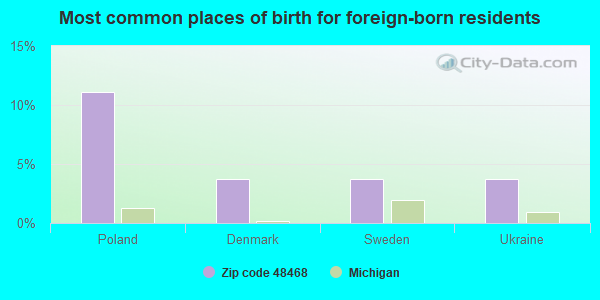
Foreign born population: 26 (2.1%) (45.7% of them are naturalized citizens)
This zip code:
2.1%
Whole state:
6.9%
11%Poland
4%Denmark
4%Sweden
4%Ukraine
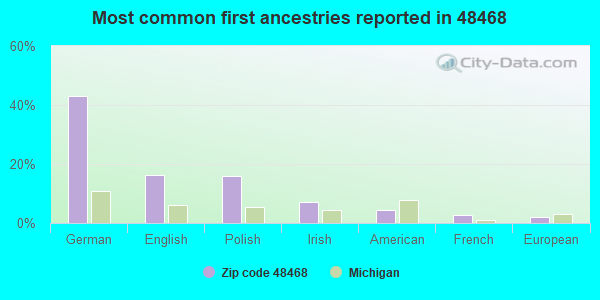
43%German
16%English
16%Polish
7%Irish
5%American
3%French
2%European
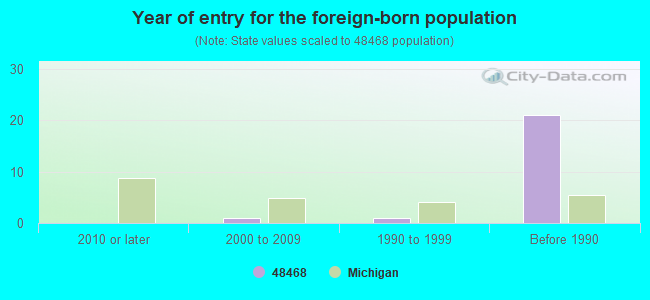
Year of entry for the foreign-born population
02010 or later
12000 to 2009
11990 to 1999
21Before 1990
Facilities with environmental interests located in this zip code:
HURON COUNTY ROAD COMMISSION (LIGHTHOUSE COUNTY PARK in PORT HOPE, MI)
National Pollutant Discharge Elimination System NON-MAJOR (Tracking pollutant discharge elimination systems) - permit Business SIC classification: AMUSEMENT AND RECREATION SERVICES Alternative names: HURON CO LIGHTHOUSE PARK WWSL
CLASSIC GRINDSTONE-PT HOPE (5000 STODDARD RD in PORT HOPE, MI)
National Pollutant Discharge Elimination System NON-MAJOR (Tracking pollutant discharge elimination systems) - permit Business SIC classification: DIMENSION STONE Organizations: CLASSIC STONE LLC (CONTACT/OWNER)
Housing units lacking complete plumbing facilities: 4.9% Housing units lacking complete kitchen facilities: 1.8%
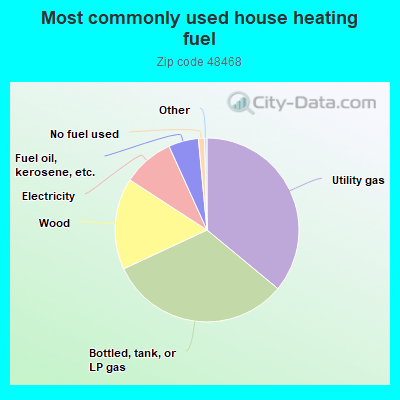
36.2%Utility gas
32.2%Bottled, tank, or LP gas
16.2%Wood
9.1%Electricity
5.3%Fuel oil, kerosene, etc.
1.1%No fuel used
Population in 1990: 1,490.
Place of birth for U.S.-born residents:
This state: 1,115
Northeast: 13
Midwest: 69
South: 28
West: 5
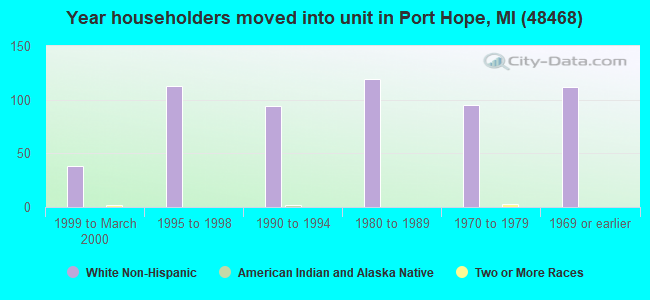
74% of the 48468 zip code residents lived in the same house 5 years ago. Out of people who lived in different houses, 57% lived in this county. Out of people who lived in different counties, 50% lived in Michigan.
97% of the 48468 zip code residents lived in the same house 1 year ago. Out of people who lived in different houses, 20% moved from this county. Out of people who lived in different houses, 87% moved from different county within same state.
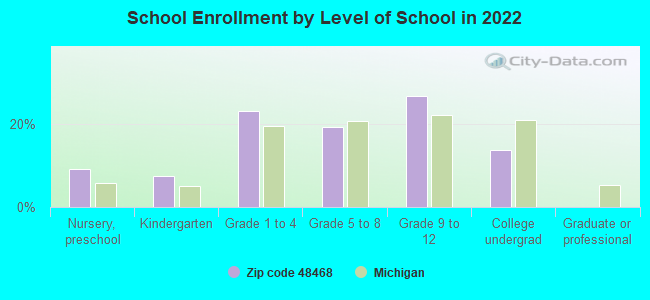
Private vs. public school enrollment:
Students in private schools in grades 1 to 8 (elementary and middle school): 13
Here:
27.7%
Michigan:
12.4%
Students in private schools in grades 9 to 12 (high school): 2
Here:
7.0%
Michigan:
9.8%
Students in private undergraduate colleges: 1
Here:
10.8%
Michigan:
14.9%
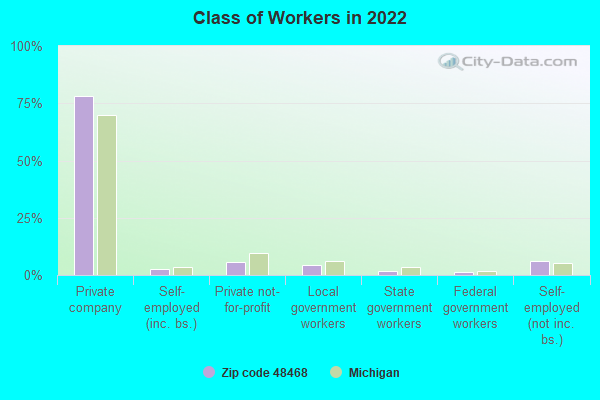
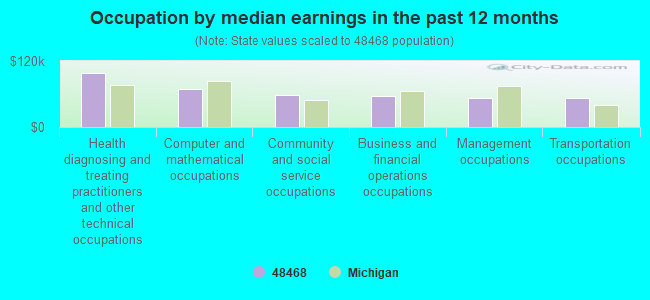
Occupation by median earnings in the past 12 months ($)
98,696Health diagnosing and treating practitioners and other technical occupations
69,832Computer and mathematical occupations
57,853Community and social service occupations
56,561Business and financial operations occupations
53,342Management occupations
52,383Transportation occupations
Top industries in this zip code by the number of employees in 2005:
Other Services (except Public Administration): Religious Organizations (10-19 employees: 1 establishment, 5-9 employees: 1 establishment)
Accommodation and Food Services: Full-Service Restaurants (5-9: 1, 1-4: 1)
Finance and Insurance: Commercial Banking (5-9: 1)
Finance and Insurance: Insurance Agencies and Brokerages (1-4: 1)
Utilities: Water Supply and Irrigation Systems (1-4: 1)
People in group quarters in 2010:
3 people in group homes intended for adults
People in group quarters in 2000:
5 people in other group homes
Fatal accident statistics in 2013:
Fatal accident count: 1
Vehicles involved in fatal accidents: 1
Fatal accidents caused by drunken drivers: 1
Fatalities: 1
Persons involved in fatal accidents: 2
Pedestrians involved in fatal accidents: 0
2002 - 2018 National Fire Incident Reporting System (NFIRS) incidents
Based on the data from the years 2002 - 2018 the average number of fire incidents per year is 7. The highest number of fires - 14 took place in 2011, and the least - 2 in 2014. The data has a dropping trend.
When looking into fire subcategories, the most reports belonged to: Structure Fires (51.6%), and Outside Fires (32.5%).
Fire incident types reported to NFIRS in Zip Code 48468
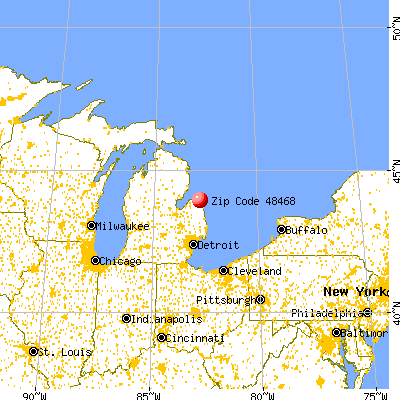


 Nearest zip codes: 48441, 48432, 48470, 48445, 48467, 48413.


 Based on the data from the years 2002 - 2018 the average number of fire incidents per year is 7. The highest number of fires - 14 took place in 2011, and the least - 2 in 2014. The data has a dropping trend.
 When looking into fire subcategories, the most reports belonged to: Structure Fires (51.6%), and Outside Fires (32.5%).