Estimated zip code population in 2022: 3,776 Zip code population in 2010: 4,058 Zip code population in 2000: 4,525
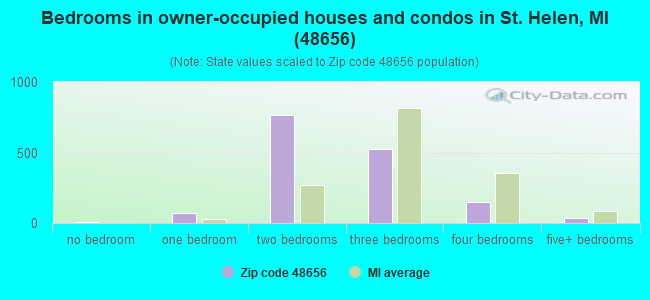
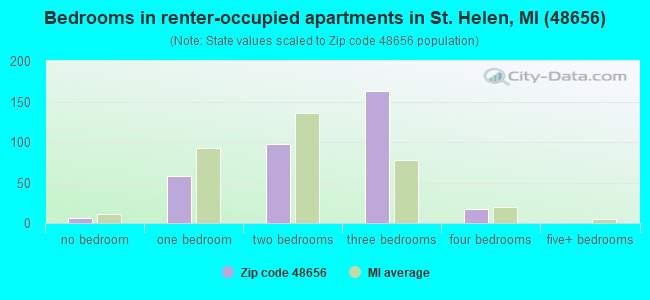
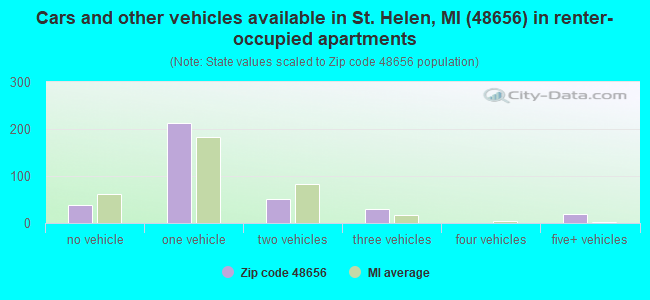
Houses and condos: 3,870 Renter-occupied apartments: 347
% of renters here:
18%
State:
27%
March 2022 cost of living index in zip code 48656: 80.6 (low, U.S. average is 100)
Land area: 132.9 sq. mi. Water area: 5.0 sq. mi.
Population density: 28 people per square mile
(very low).
OSM Map
General Map
Google Map
MSN Map
OSM Map
General Map
Google Map
MSN Map
OSM Map
General Map
Google Map
MSN Map
OSM Map
General Map
Google Map
MSN Map
Please wait while loading the map...
Real estate property taxes paid for housing units in 2022:
This zip code:
1.1% ($1,099)
Michigan:
1.2% ($2,746)
Median real estate property taxes paid for housing units with mortgages in 2022: $1,154 (1.2%) Median real estate property taxes paid for housing units with no mortgage in 2022: $1,067 (1.1%)
Averages for the 2020 tax year for zip code 48656, filed in 2021:
Average Adjusted Gross Income (AGI) in 2020: $42,963 (Individual Income Tax Returns)
Here:
$42,963
State:
$68,945
Salary/wage: $35,188 (reported on 66.5% of returns)
Here:
$35,188
State:
$57,142
(% of AGI for various income ranges: 778.2% for AGIs below $25k, 2569.3% for AGIs $25k-50k, 4589.5% for AGIs $50k-75k, 7310.0% for AGIs $75k-100k, 11436.2% for AGIs $100k-200k)
Taxable interest for individuals: $1,040 (reported on 25.8% of returns)
This zip code:
$1,040
Michigan:
$1,630
(% of AGI for various income ranges: 16.8% for AGIs below $25k, 30.0% for AGIs $25k-50k, 43.2% for AGIs $50k-75k, 55.6% for AGIs $75k-100k, 168.8% for AGIs $100k-200k)
Ordinary dividends: $2,600 (reported on 12.6% of returns)
Here:
$2,600
State:
$6,972
(% of AGI for various income ranges: 11.2% for AGIs below $25k, 25.0% for AGIs $25k-50k, 79.5% for AGIs $50k-75k, 62.2% for AGIs $75k-100k, 277.5% for AGIs $100k-200k)
Net capital gain/loss in AGI: +$6,281 (reported on 11.5% of returns)
Here:
+$6,281
State:
+$20,064
(% of AGI for various income ranges: 5.3% for AGIs below $25k, 33.3% for AGIs $25k-50k, 60.0% for AGIs $50k-75k, 83.3% for AGIs $75k-100k, 1200.0% for AGIs $100k-200k)
Profit/loss from business: +$5,904 (reported on 12.6% of returns)
Here:
+$5,904
State:
+$11,172
(% of AGI for various income ranges: 90.2% for AGIs below $25k, 117.1% for AGIs $25k-50k, 128.4% for AGIs $50k-75k, 120.0% for AGIs $75k-100k)
Taxable individual retirement arrangement distribution: $14,270 (reported on 12.6% of returns)
48656:
$14,270
Michigan:
$19,803
(% of AGI for various income ranges: 45.4% for AGIs below $25k, 90.0% for AGIs $25k-50k, 356.8% for AGIs $50k-75k, 784.4% for AGIs $75k-100k, 1576.2% for AGIs $100k-200k)
Total itemized deductions: $23,925 (reported on 2.2% of returns)
Here:
$23,925
State:
$34,117
(% of AGI for various income ranges: 1063.3% for AGIs $75k-100k)
Charity contributions: $9,250 (reported on 1.1% of returns)
Here:
$9,250
State:
$13,548
(% of AGI for various income ranges: 44.0% for AGIs $25k-50k)
Taxes paid: $6,500 (reported on 2.2% of returns)
48656:
$6,500
State:
$7,972
(% of AGI for various income ranges: 288.9% for AGIs $75k-100k)
Earned income credit: $1,955 (reported on 18.1% of returns)
Here:
$1,955
State:
$2,251
(% of AGI for various income ranges: 70.7% for AGIs below $25k, 57.6% for AGIs $25k-50k)
Percentage of individuals using paid preparers for their 2020 taxes: 95.1%
Here:
95%
State:
93%
(% for various income ranges: 92.3% for AGIs below $25k, 96.1% for AGIs $25k-50k, 100.0% for AGIs $50k-75k, 92.9% for AGIs $75k-100k, 100.0% for AGIs $100k-200k, 100.0% for AGIs over 200k)
Averages for the 2012 tax year for zip code 48656, filed in 2013:
Average Adjusted Gross Income (AGI) in 2012: $31,690 (Individual Income Tax Returns)
Here:
$31,690
State:
$55,609
Salary/wage: $22,969 (reported on 74.3% of returns)
Here:
$22,969
State:
$46,782
(% of AGI for various income ranges: 50.4% for AGIs below $25k, 56.9% for AGIs $25k-50k, 54.8% for AGIs $50k-75k, 59.7% for AGIs $75k-100k, 47.2% for AGIs $100k-200k)
Taxable interest for individuals: $890 (reported on 29.3% of returns)
This zip code:
$890
Michigan:
$1,491
(% of AGI for various income ranges: 1.6% for AGIs below $25k, 0.8% for AGIs $25k-50k, 0.4% for AGIs $50k-75k, 0.6% for AGIs $75k-100k, 0.6% for AGIs $100k-200k)
Ordinary dividends: $2,052 (reported on 13.8% of returns)
Here:
$2,052
State:
$6,225
(% of AGI for various income ranges: 1.8% for AGIs below $25k, 0.9% for AGIs $25k-50k, 0.4% for AGIs $50k-75k, 0.5% for AGIs $75k-100k, 0.7% for AGIs $100k-200k)
Net capital gain/loss in AGI: +$405 (reported on 12.0% of returns)
Here:
+$405
State:
+$9,326
(% of AGI for various income ranges: 1.6% for AGIs $100k-200k)
Profit/loss from business: +$5,860 (reported on 12.0% of returns)
Here:
+$5,860
State:
+$11,523
(% of AGI for various income ranges: 5.3% for AGIs below $25k, 2.3% for AGIs $25k-50k, 2.1% for AGIs $50k-75k)
Taxable individual retirement arrangement distribution: $11,350 (reported on 13.2% of returns)
48656:
$11,350
Michigan:
$15,298
(% of AGI for various income ranges: 3.4% for AGIs below $25k, 3.2% for AGIs $25k-50k, 4.6% for AGIs $50k-75k, 15.6% for AGIs $75k-100k)
Total itemized deductions: $15,970 (24% of AGI, reported on 13.8% of returns)
Here:
$15,970
State:
$21,628
Here:
23.8% of AGI
State:
18.4% of AGI
(% of AGI for various income ranges: 5.9% for AGIs below $25k, 5.5% for AGIs $25k-50k, 6.3% for AGIs $50k-75k, 9.2% for AGIs $75k-100k, 9.6% for AGIs $100k-200k)
Charity contributions: $1,972 (reported on 10.8% of returns)
Here:
$1,972
State:
$4,225
(% of AGI for various income ranges: 0.5% for AGIs below $25k, 0.3% for AGIs $25k-50k, 0.9% for AGIs $50k-75k, 1.3% for AGIs $75k-100k, 0.7% for AGIs $100k-200k)
Taxes paid: $4,987 (reported on 13.8% of returns)
48656:
$4,987
State:
$8,327
(% of AGI for various income ranges: 1.2% for AGIs below $25k, 1.2% for AGIs $25k-50k, 1.6% for AGIs $50k-75k, 2.8% for AGIs $75k-100k, 5.0% for AGIs $100k-200k)
Earned income credit: $2,059 (reported on 22.2% of returns)
Here:
$2,059
State:
$2,306
(% of AGI for various income ranges: 5.4% for AGIs below $25k, 0.9% for AGIs $25k-50k)
Percentage of individuals using paid preparers for their 2012 taxes: 59.9%
Here:
60%
State:
57%
(% for various income ranges: 55.3% for AGIs below $25k, 61.9% for AGIs $25k-50k, 68.8% for AGIs $50k-75k, 66.7% for AGIs $75k-100k, 83.3% for AGIs $100k-200k)
Averages for the 2004 tax year for zip code 48656, filed in 2005:
Average Adjusted Gross Income (AGI) in 2004: $26,993 (Individual Income Tax Returns)
Here:
$26,993
State:
$48,204
Salary/wage: $20,674 (reported on 76.7% of returns)
Here:
$20,674
State:
$42,791
(% of AGI for various income ranges: 68.8% for AGIs below $10k, 49.5% for AGIs $10k-25k, 57.2% for AGIs $25k-50k, 67.6% for AGIs $50k-75k, 65.0% for AGIs $75k-100k, 54.3% for AGIs over 100k)
Taxable interest for individuals: $1,096 (reported on 45.7% of returns)
This zip code:
$1,096
Michigan:
$1,725
(% of AGI for various income ranges: 5.3% for AGIs below $10k, 2.7% for AGIs $10k-25k, 1.9% for AGIs $25k-50k, 1.1% for AGIs $50k-75k, 0.7% for AGIs $75k-100k, 1.3% for AGIs over 100k)
Taxable dividends: $1,148 (reported on 18.9% of returns)
Here:
$1,148
State:
$3,420
(% of AGI for various income ranges: 1.8% for AGIs below $10k, 1.2% for AGIs $10k-25k, 0.8% for AGIs $25k-50k, 0.5% for AGIs $50k-75k, 0.7% for AGIs $75k-100k, 0.3% for AGIs over 100k)
Net capital gain/loss: +$2,321 (reported on 14.5% of returns)
Here:
+$2,321
State:
+$8,532
(% of AGI for various income ranges: -2.4% for AGIs below $10k, 0.4% for AGIs $10k-25k, 0.0% for AGIs $25k-50k, 3.4% for AGIs $50k-75k, -0.2% for AGIs $75k-100k, 5.5% for AGIs over 100k)
Profit/loss from business: +$5,389 (reported on 13.6% of returns)
Here:
+$5,389
State:
+$9,547
(% of AGI for various income ranges: 7.3% for AGIs below $10k, 4.9% for AGIs $10k-25k, 2.2% for AGIs $25k-50k, 2.9% for AGIs $50k-75k)
IRA payment deduction: $2,300 (reported on 1.6% of returns)
48656:
$2,300
Michigan:
$2,875
Total itemized deductions: $13,402 (27% of AGI, reported on 16.8% of returns)
Here:
$13,402
State:
$18,509
Here:
26.5% of AGI
State:
20.7% of AGI
(% of AGI for various income ranges: 12.1% for AGIs below $10k, 6.7% for AGIs $10k-25k, 7.4% for AGIs $25k-50k, 9.3% for AGIs $50k-75k, 10.1% for AGIs $75k-100k, 9.6% for AGIs over 100k)
Charity contributions deductions: $1,509 (3% of AGI, reported on 12.5% of returns)
Here:
$1,509
State:
$3,365
Here:
2.8% of AGI
State:
3.6% of AGI
(% of AGI for various income ranges: 0.5% for AGIs $10k-25k, 0.4% for AGIs $25k-50k, 1.0% for AGIs $50k-75k, 1.1% for AGIs $75k-100k, 1.4% for AGIs over 100k)
Total tax: $2,964 (reported on 69.0% of returns)
48656:
$2,964
State:
$7,691
(% of AGI for various income ranges: 2.7% for AGIs below $10k, 3.2% for AGIs $10k-25k, 6.2% for AGIs $25k-50k, 9.1% for AGIs $50k-75k, 11.0% for AGIs $75k-100k, 16.6% for AGIs over 100k)
Earned income credit: $1,539 (reported on 22.0% of returns)
Here:
$1,539
State:
$1,737
Percentage of individuals using paid preparers for their 2004 taxes: 64.2%
Here:
64%
State:
60%
(% for various income ranges: 60.2% for AGIs below $10k, 67.6% for AGIs $10k-25k, 64.2% for AGIs $25k-50k, 61.8% for AGIs $50k-75k, 60.0% for AGIs $75k-100k, 73.5% for AGIs over 100k)
Likely homosexual households (counted as self-reported same-sex unmarried-partner households)
Lesbian couples: 0.0% of all households
Gay men: 0.3% of all households
Household received Food Stamps/SNAP in the past 12 months: 448 Household did not receive Food Stamps/SNAP in the past 12 months: 1,461
Women who had a birth in the past 12 months: 21 (0 now married, 20 unmarried) Women who did not have a birth in the past 12 months: 469 (223 now married, 245 unmarried)
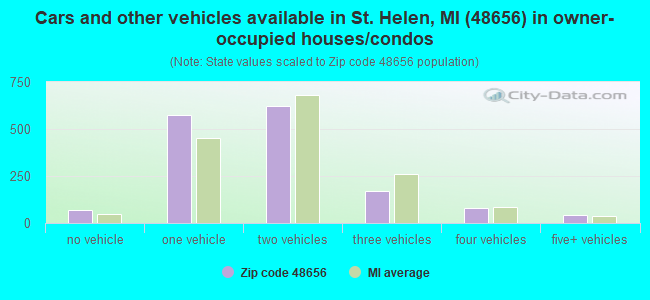
Housing units in zip code 48656 with a mortgage: 628 (43 second mortgage, 12 both second mortgage and home equity loan) Houses without a mortgage: 11
Median monthly owner costs for units with a mortgage: $814 Median monthly owner costs for units without a mortgage: $372
Residents with income below the poverty level in 2022:
This zip code:
20.6%
Whole state:
13.4%
Residents with income below 50% of the poverty level in 2022:
This zip code:
9.7%
Whole state:
6.9%
Median number of rooms in houses and condos:
Here:
5.2
State:
6.5
Median number of rooms in apartments:
Here:
5.3
State:
4.3
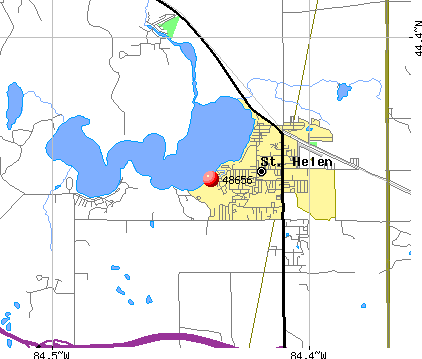
Notable locations in this zip code not listed on our city pages
Notable locations in zip code 48656: Saint Helen Station (A), Birch Pointe Golf Club (B), Artesia Beach Campground (C), Twin Lakes Campground (D), Backus Township Hall (E), Richfield Township Police Department (F), Richfield Township Public Library (G), Richfield Township Department of Public Safety Fire Station (H). Display/hide their locations on the map
Churches in zip code 48656 include: Saint Helen Assembly of God Church (A), Community Baptist Church (B), Saint Helen Catholic Church (C), Hope Lutheran Church (D), Lake Saint Helen Baptist Church (E). Display/hide their locations on the map
Lakes and reservoirs: Little Woods Lake (A), West Twin Lake (B), Ninemile Lake (C), Woods Lake (D), Indian Lake (E), Mud Lake (F), Fisher Lake (G), Eddy Lake (H). Display/hide their locations on the map
Creeks: South Creek (A), Cameron Creek (B), Lost Creek (C), Cedar Creek (D), Marsh Creek (E), Russell Creek (F), East Creek (G). Display/hide their locations on the map
214 married couples with children.
172 single-parent households (54 men, 118 women).
97.6% of residents of 48656 zip code speak English at home.
1.2% of residents speak Spanish at home (81% very well, 19% well).
0.8% of residents speak other Indo-European language at home (100% very well).
0.9% of residents speak Asian or Pacific Island language at home (100% not well).
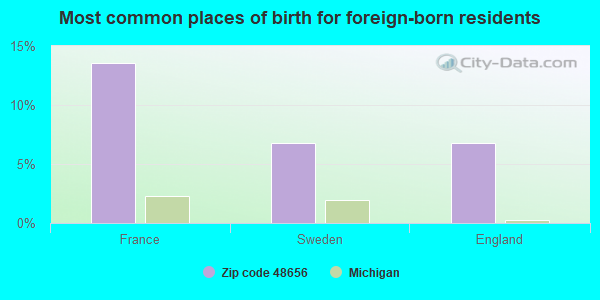
Foreign born population: 57 (1.5%) (19.4% of them are naturalized citizens)
This zip code:
1.5%
Whole state:
6.9%
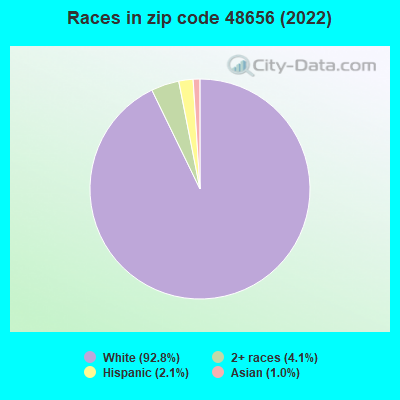
14%France
7%Sweden
7%England
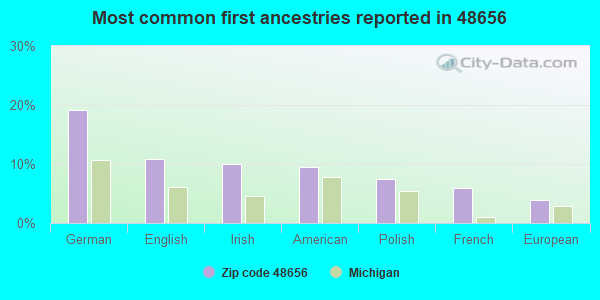
19%German
11%English
10%Irish
9%American
7%Polish
6%French
4%European
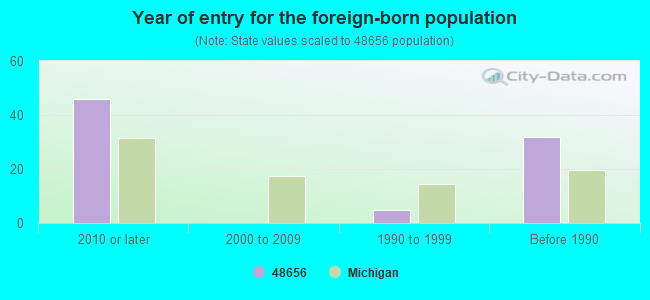
Year of entry for the foreign-born population
462010 or later
02000 to 2009
51990 to 1999
32Before 1990
Facilities with environmental interests located in this zip code:
GERRISH-HIGGINS ALTERNATIVE EDUCATION (10113 E. AIRPORT in ST. HELEN, MI)
(National Center for Education Statistics) - STATE ID-07952 Organizations: GERRISH-HIGGINS SCHOOL DISTRICT (SCHOOL DISTRICT)
Housing units lacking complete plumbing facilities: 3.0% Housing units lacking complete kitchen facilities: 3.4%
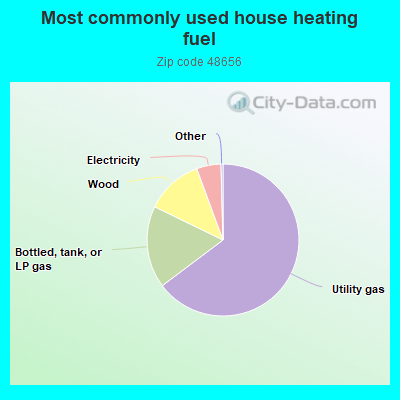
64.8%Utility gas
17.5%Bottled, tank, or LP gas
12.2%Wood
5.2%Electricity
Population in 1990: 3,686. Population change in the 1990s: +839 (+22.8%).
Place of birth for U.S.-born residents:
This state: 3,184
Northeast: 78
Midwest: 134
South: 199
West: 94
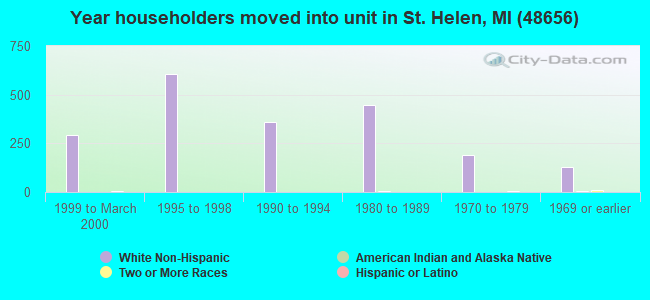
56% of the 48656 zip code residents lived in the same house 5 years ago. Out of people who lived in different houses, 26% lived in this county. Out of people who lived in different counties, 50% lived in Michigan.
89% of the 48656 zip code residents lived in the same house 1 year ago. Out of people who lived in different houses, 16% moved from this county. Out of people who lived in different houses, 62% moved from different county within same state. Out of people who lived in different houses, 22% moved from different state.
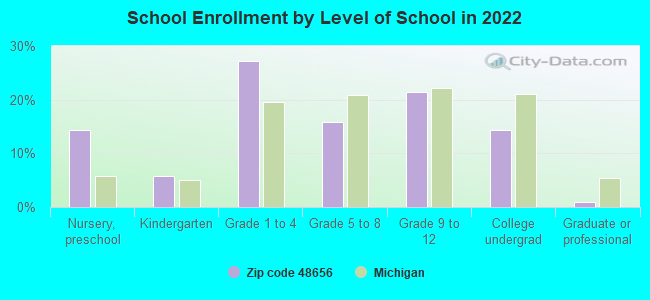
Private vs. public school enrollment:
Students in private schools in grades 1 to 8 (elementary and middle school): 42
Here:
22.5%
Michigan:
12.4%
Students in private schools in grades 9 to 12 (high school): 17
Here:
19.1%
Michigan:
9.8%
Students in private undergraduate colleges:
Here:
0.0%
Michigan:
14.9%
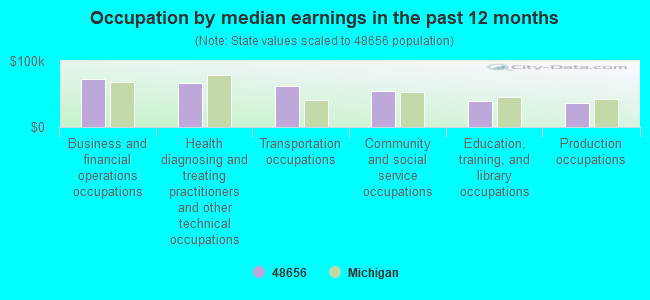
Occupation by median earnings in the past 12 months ($)
72,701Business and financial operations occupations
66,216Health diagnosing and treating practitioners and other technical occupations
61,684Transportation occupations
54,996Community and social service occupations
39,395Education, training, and library occupations
35,694Production occupations
Top industries in this zip code by the number of employees in 2005:
Health Care and Social Assistance: Offices of Physicians (except Mental Health Specialists) (20-49: 1)
Finance and Insurance: Insurance Agencies and Brokerages (5-9: 2)
Construction: All Other Specialty Trade Contractors (1-4: 6)
Construction: New Single-Family Housing Construction (except Operative Builders) (1-4: 5)
Accommodation and Food Services: Limited-Service Restaurants (5-9: 1, 1-4: 1)
Fatal accident statistics in 2014:
Fatal accident count: 1
Vehicles involved in fatal accidents: 1
Fatal accidents caused by drunken drivers: 0
Fatalities: 1
Persons involved in fatal accidents: 1
Pedestrians involved in fatal accidents: 0
Fatal accident statistics in 2013:
Fatal accident count: 5
Vehicles involved in fatal accidents: 5
Fatal accidents caused by drunken drivers: 2
Fatalities: 6
Persons involved in fatal accidents: 7
Pedestrians involved in fatal accidents: 0
2002 - 2018 National Fire Incident Reporting System (NFIRS) incidents
Based on the data from the years 2002 - 2018 the average number of fire incidents per year is 20. The highest number of reported fires - 52 took place in 2007, and the least - 4 in 2010. The data has an increasing trend.
When looking into fire subcategories, the most incidents belonged to: Structure Fires (46.2%), and Outside Fires (25.0%).
Fire incident types reported to NFIRS in Zip Code 48656


 Nearest zip codes: 48651, 48653, 48661, 48624, 48636, 48630.


 Based on the data from the years 2002 - 2018 the average number of fire incidents per year is 20. The highest number of reported fires - 52 took place in 2007, and the least - 4 in 2010. The data has an increasing trend.
 When looking into fire subcategories, the most incidents belonged to: Structure Fires (46.2%), and Outside Fires (25.0%).