Estimated zip code population in 2022: 2,636 Zip code population in 2010: 2,850 Zip code population in 2000: 2,755
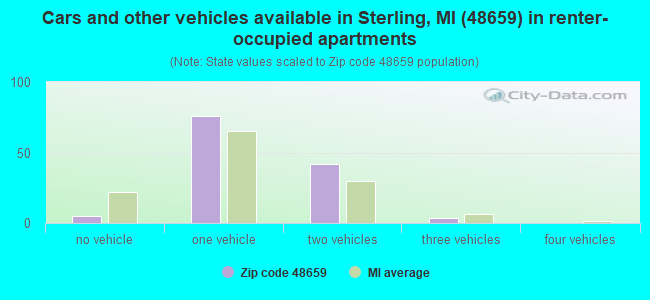
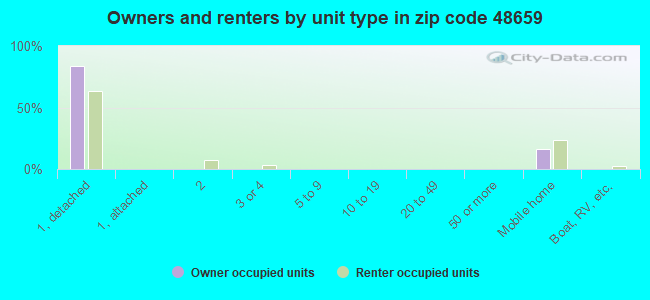
Houses and condos: 1,259 Renter-occupied apartments: 125
% of renters here:
13%
State:
27%
March 2022 cost of living index in zip code 48659: 80.5 (low, U.S. average is 100)
Land area: 79.7 sq. mi. Water area: 0.3 sq. mi.
Population density: 33 people per square mile
(very low).
OSM Map
General Map
Google Map
MSN Map
OSM Map
General Map
Google Map
MSN Map
OSM Map
General Map
Google Map
MSN Map
OSM Map
General Map
Google Map
MSN Map
Please wait while loading the map...
Real estate property taxes paid for housing units in 2022:
This zip code:
1.2% ($1,524)
Michigan:
1.2% ($2,746)
Median real estate property taxes paid for housing units with mortgages in 2022: $1,739 (1.2%) Median real estate property taxes paid for housing units with no mortgage in 2022: $1,147 (1.2%)
Business Search- 14 Million verified businesses
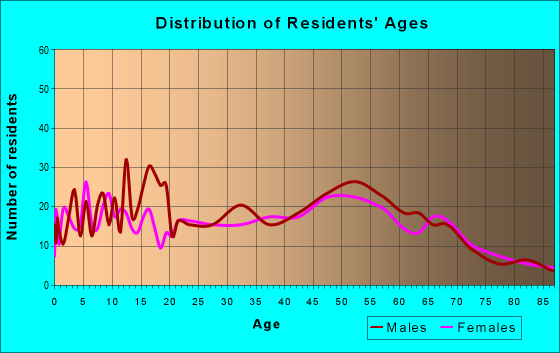
Males: 1,371
(52.0%)
Females: 1,264
(48.0%)
For population 25 years and over in 48659:
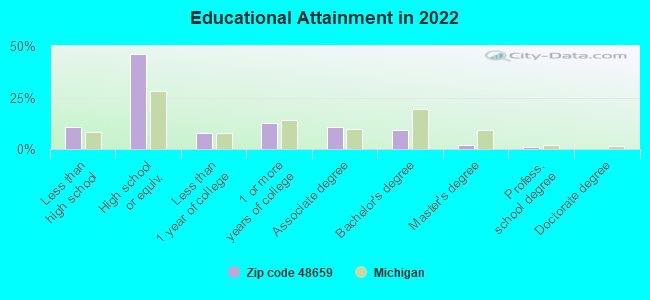
High school or higher: 88.3%
Bachelor's degree or higher: 12.1%
Graduate or professional degree: 3.0%
Unemployed: 4.4%
Mean travel time to work (commute): 25.1 minutes
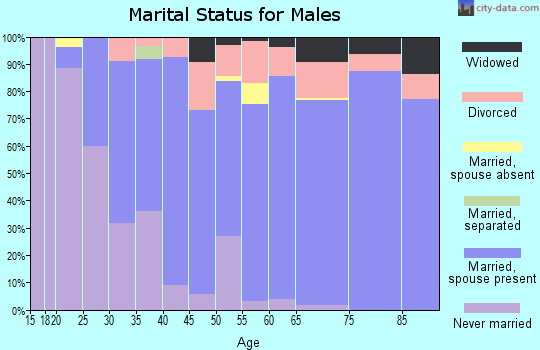
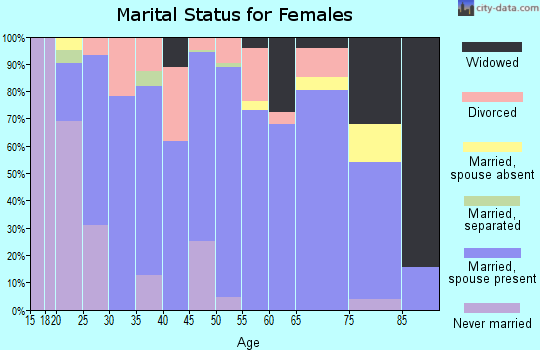
For population 15 years and over in 48659:
Never married: 25.9%
Now married: 56.9%
Separated: 0.4%
Widowed: 5.5%
Divorced: 11.4%
Zip code 48659 compared to state average:
Median house value below state average.
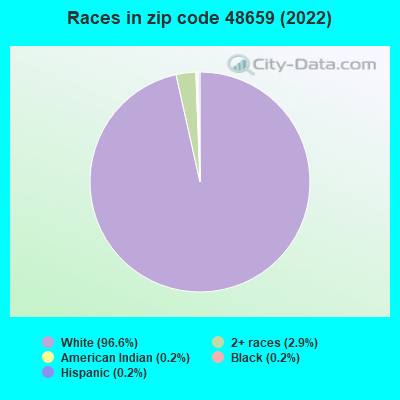
Black race population percentage significantly below state average.
Hispanic race population percentage significantly below state average.
Foreign-born population percentage significantly below state average.
Renting percentage below state average.
Length of stay since moving in significantly above state average.
Number of college students below state average.
Percentage of population with a bachelor's degree or higher significantly below state average.
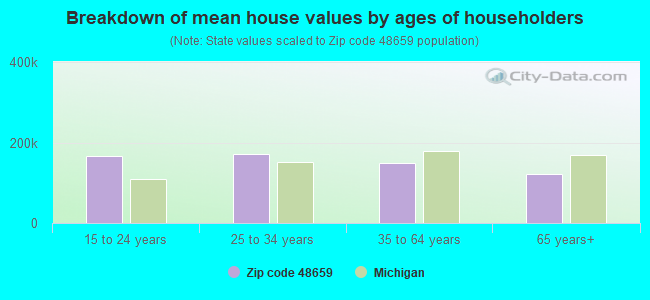
Estimated median house/condo value in 2022: $123,526
48659:
$123,526
Michigan:
$224,400
According to our research of Michigan and other state lists, there were 9 registered sex offenders living in 48659 zip code as of April 28, 2024. The ratio of all residents to sex offenders in zip code 48659 is 324 to 1. The ratio of registered sex offenders to all residents in this zip code is near the state average.
Median resident age:
This zip code:
41.0 years
Michigan median age:
40.3 years
Average household size:
This zip code:
2.7 people
Michigan:
2.4 people
Averages for the 2020 tax year for zip code 48659, filed in 2021:
Average Adjusted Gross Income (AGI) in 2020: $49,086 (Individual Income Tax Returns)
Here:
$49,086
State:
$68,945
Salary/wage: $42,719 (reported on 80.0% of returns)
Here:
$42,719
State:
$57,142
(% of AGI for various income ranges: 1026.5% for AGIs below $25k, 3134.6% for AGIs $25k-50k, 6197.1% for AGIs $50k-75k, 8221.0% for AGIs $75k-100k, 19080.0% for AGIs $100k-200k)
Taxable interest for individuals: $679 (reported on 25.4% of returns)
This zip code:
$679
Michigan:
$1,630
(% of AGI for various income ranges: 16.5% for AGIs below $25k, 12.9% for AGIs $25k-50k, 42.1% for AGIs $50k-75k, 10.0% for AGIs $75k-100k, 78.8% for AGIs $100k-200k)
Ordinary dividends: $1,836 (reported on 10.8% of returns)
Here:
$1,836
State:
$6,972
(% of AGI for various income ranges: 10.0% for AGIs below $25k, 8.2% for AGIs $25k-50k, 22.9% for AGIs $50k-75k, 35.0% for AGIs $75k-100k, 166.2% for AGIs $100k-200k)
Net capital gain/loss in AGI: +$9,692 (reported on 9.2% of returns)
Here:
+$9,692
State:
+$20,064
(% of AGI for various income ranges: 0.9% for AGIs below $25k, 76.4% for AGIs $50k-75k, 1316.2% for AGIs $100k-200k)
Profit/loss from business: +$12,638 (reported on 12.3% of returns)
Here:
+$12,638
State:
+$11,172
(% of AGI for various income ranges: 109.7% for AGIs below $25k, 146.8% for AGIs $25k-50k, 264.3% for AGIs $50k-75k, 1085.0% for AGIs $100k-200k)
Taxable individual retirement arrangement distribution: $10,383 (reported on 9.2% of returns)
48659:
$10,383
Michigan:
$19,803
(% of AGI for various income ranges: 90.9% for AGIs below $25k, 57.9% for AGIs $25k-50k, 180.7% for AGIs $50k-75k, 522.0% for AGIs $75k-100k)
Total itemized deductions: $32,800 (reported on 1.5% of returns)
Here:
$32,800
State:
$34,117
(% of AGI for various income ranges: 468.6% for AGIs $50k-75k)
Taxes paid: $6,400 (reported on 1.5% of returns)
48659:
$6,400
State:
$7,972
(% of AGI for various income ranges: 91.4% for AGIs $50k-75k)
Earned income credit: $2,261 (reported on 13.8% of returns)
Here:
$2,261
State:
$2,251
(% of AGI for various income ranges: 66.2% for AGIs below $25k, 65.0% for AGIs $25k-50k)
Percentage of individuals using paid preparers for their 2020 taxes: 96.2%
Here:
96%
State:
93%
(% for various income ranges: 95.7% for AGIs below $25k, 97.1% for AGIs $25k-50k, 100.0% for AGIs $50k-75k, 92.3% for AGIs $75k-100k, 93.3% for AGIs $100k-200k)
Averages for the 2012 tax year for zip code 48659, filed in 2013:
Average Adjusted Gross Income (AGI) in 2012: $38,462 (Individual Income Tax Returns)
Here:
$38,462
State:
$55,609
Salary/wage: $32,602 (reported on 83.1% of returns)
Here:
$32,602
State:
$46,782
(% of AGI for various income ranges: 67.5% for AGIs below $25k, 71.7% for AGIs $25k-50k, 69.2% for AGIs $50k-75k, 77.2% for AGIs $75k-100k, 67.2% for AGIs $100k-200k)
Taxable interest for individuals: $584 (reported on 29.8% of returns)
This zip code:
$584
Michigan:
$1,491
(% of AGI for various income ranges: 1.0% for AGIs below $25k, 0.3% for AGIs $25k-50k, 0.5% for AGIs $50k-75k, 0.2% for AGIs $75k-100k, 0.4% for AGIs $100k-200k)
Ordinary dividends: $1,764 (reported on 11.3% of returns)
Here:
$1,764
State:
$6,225
(% of AGI for various income ranges: 0.8% for AGIs below $25k, 0.5% for AGIs $25k-50k, 0.2% for AGIs $50k-75k, 1.0% for AGIs $100k-200k)
Net capital gain/loss in AGI: +$4,870 (reported on 8.1% of returns)
Here:
+$4,870
State:
+$9,326
(% of AGI for various income ranges: 0.8% for AGIs $50k-75k, 4.0% for AGIs $100k-200k)
Profit/loss from business: +$6,563 (reported on 15.3% of returns)
Here:
+$6,563
State:
+$11,523
(% of AGI for various income ranges: 6.2% for AGIs below $25k, 3.3% for AGIs $25k-50k, 3.3% for AGIs $50k-75k, 1.3% for AGIs $75k-100k)
Taxable individual retirement arrangement distribution: $9,670 (reported on 8.1% of returns)
48659:
$9,670
Michigan:
$15,298
(% of AGI for various income ranges: 2.0% for AGIs below $25k, 4.0% for AGIs $25k-50k, 4.7% for AGIs $75k-100k)
Total itemized deductions: $17,857 (22% of AGI, reported on 16.9% of returns)
Here:
$17,857
State:
$21,628
Here:
22.0% of AGI
State:
18.4% of AGI
(% of AGI for various income ranges: 3.6% for AGIs below $25k, 7.8% for AGIs $25k-50k, 9.1% for AGIs $50k-75k, 7.3% for AGIs $75k-100k, 9.8% for AGIs $100k-200k)
Charity contributions: $2,079 (reported on 11.3% of returns)
Here:
$2,079
State:
$4,225
(% of AGI for various income ranges: 0.5% for AGIs $25k-50k, 0.6% for AGIs $50k-75k, 0.4% for AGIs $75k-100k, 1.3% for AGIs $100k-200k)
Taxes paid: $5,381 (reported on 16.9% of returns)
48659:
$5,381
State:
$8,327
(% of AGI for various income ranges: 0.6% for AGIs below $25k, 1.4% for AGIs $25k-50k, 2.3% for AGIs $50k-75k, 2.4% for AGIs $75k-100k, 4.5% for AGIs $100k-200k)
Earned income credit: $2,222 (reported on 21.8% of returns)
Here:
$2,222
State:
$2,306
(% of AGI for various income ranges: 6.1% for AGIs below $25k, 1.6% for AGIs $25k-50k)
Percentage of individuals using paid preparers for their 2012 taxes: 66.1%
Here:
66%
State:
57%
(% for various income ranges: 59.6% for AGIs below $25k, 66.7% for AGIs $25k-50k, 82.4% for AGIs $50k-75k, 66.7% for AGIs $75k-100k, 75.0% for AGIs $100k-200k)
Averages for the 2004 tax year for zip code 48659, filed in 2005:
Average Adjusted Gross Income (AGI) in 2004: $31,283 (Individual Income Tax Returns)
Here:
$31,283
State:
$48,204
Salary/wage: $28,416 (reported on 86.8% of returns)
Here:
$28,416
State:
$42,791
(% of AGI for various income ranges: 94.3% for AGIs below $10k, 65.6% for AGIs $10k-25k, 78.5% for AGIs $25k-50k, 85.7% for AGIs $50k-75k, 81.0% for AGIs $75k-100k, 74.7% for AGIs over 100k)
Taxable interest for individuals: $893 (reported on 40.7% of returns)
This zip code:
$893
Michigan:
$1,725
(% of AGI for various income ranges: 3.3% for AGIs below $10k, 2.6% for AGIs $10k-25k, 0.7% for AGIs $25k-50k, 1.1% for AGIs $50k-75k, 0.3% for AGIs $75k-100k, 1.2% for AGIs over 100k)
Taxable dividends: $822 (reported on 12.9% of returns)
Here:
$822
State:
$3,420
(% of AGI for various income ranges: 0.8% for AGIs below $10k, 0.6% for AGIs $10k-25k, 0.5% for AGIs $25k-50k, 0.2% for AGIs $50k-75k, 0.2% for AGIs $75k-100k)
Net capital gain/loss: +$1,103 (reported on 9.6% of returns)
Here:
+$1,103
State:
+$8,532
(% of AGI for various income ranges: 0.3% for AGIs below $10k, 0.2% for AGIs $10k-25k, 0.3% for AGIs $25k-50k, -0.2% for AGIs $50k-75k, 1.6% for AGIs $75k-100k)
Profit/loss from business: +$3,276 (reported on 16.1% of returns)
Here:
+$3,276
State:
+$9,547
(% of AGI for various income ranges: 3.2% for AGIs below $10k, 5.7% for AGIs $10k-25k, 1.1% for AGIs $25k-50k, 1.4% for AGIs $50k-75k)
IRA payment deduction: $2,568 (reported on 2.8% of returns)
48659:
$2,568
Michigan:
$2,875
Total itemized deductions: $14,552 (26% of AGI, reported on 24.2% of returns)
Here:
$14,552
State:
$18,509
Here:
25.7% of AGI
State:
20.7% of AGI
(% of AGI for various income ranges: 9.0% for AGIs $10k-25k, 12.6% for AGIs $25k-50k, 11.9% for AGIs $50k-75k, 13.0% for AGIs $75k-100k, 10.2% for AGIs over 100k)
Charity contributions deductions: $1,529 (3% of AGI, reported on 21.1% of returns)
Here:
$1,529
State:
$3,365
Here:
2.6% of AGI
State:
3.6% of AGI
(% of AGI for various income ranges: 0.7% for AGIs $10k-25k, 1.0% for AGIs $25k-50k, 1.2% for AGIs $50k-75k, 1.2% for AGIs $75k-100k, 1.1% for AGIs over 100k)
Total tax: $3,504 (reported on 68.3% of returns)
48659:
$3,504
State:
$7,691
(% of AGI for various income ranges: 2.3% for AGIs below $10k, 3.9% for AGIs $10k-25k, 5.4% for AGIs $25k-50k, 7.8% for AGIs $50k-75k, 10.0% for AGIs $75k-100k, 17.0% for AGIs over 100k)
Earned income credit: $1,815 (reported on 20.3% of returns)
Here:
$1,815
State:
$1,737
Percentage of individuals using paid preparers for their 2004 taxes: 70.3%
Here:
70%
State:
60%
(% for various income ranges: 58.8% for AGIs below $10k, 73.2% for AGIs $10k-25k, 75.1% for AGIs $25k-50k, 76.6% for AGIs $50k-75k, 65.0% for AGIs $75k-100k, 82.8% for AGIs over 100k)
Household received Food Stamps/SNAP in the past 12 months: 182 Household did not receive Food Stamps/SNAP in the past 12 months: 792
Women who had a birth in the past 12 months: 32 (24 now married, 8 unmarried) Women who did not have a birth in the past 12 months: 505 (246 now married, 258 unmarried)
Housing units in zip code 48659 with a mortgage: 443 (21 second mortgage, 20 both second mortgage and home equity loan) Houses without a mortgage: 6
Median monthly owner costs for units with a mortgage: $1,106 Median monthly owner costs for units without a mortgage: $435
Residents with income below the poverty level in 2022:
This zip code:
11.2%
Whole state:
13.4%
Residents with income below 50% of the poverty level in 2022:
This zip code:
8.3%
Whole state:
6.9%
Median number of rooms in houses and condos:
Here:
6.3
State:
6.5
Median number of rooms in apartments:
Here:
4.8
State:
4.3
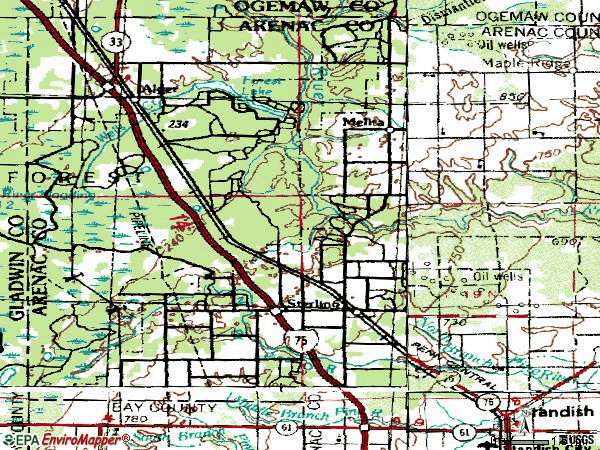
Notable locations in this zip code not listed on our city pages
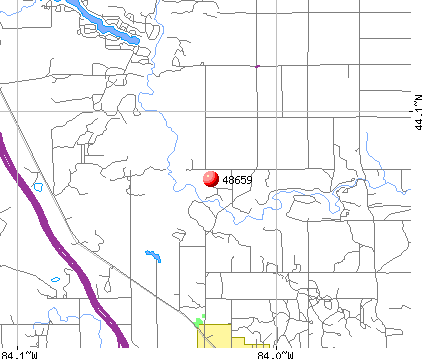
Notable locations in zip code 48659: Sterling Station (A), River View Campgrounds and Canoe Livery (B), Rifle River Golf Course (C), Sterling Area Fire Department (D), Deep River Township Hall (E). Display/hide their locations on the map
Churches in zip code 48659 include: Kingdom Hall of Jehovah's Witnesses (A), Sterling Wesleyan Church (B), Sterling United Methodist Church (C), Melita Church (D). Display/hide their locations on the map
Creeks: Wells Creek (A), Fritz Creek (B), Parmalee Creek (C), Mansfield Creek (D), Richter Creek (E), North Branch Townline Creek (F). Display/hide their locations on the map
In group quarters: 55 (-1 institutionalized population)
Size of family households: 339 2-persons, 141 3-persons, 127 4-persons, 65 5-persons, 12 7-or-more-persons
Size of nonfamily households: 215 1-person, 65 2-persons
353 married couples with children.
164 single-parent households (28 men, 136 women).
99.4% of residents of 48659 zip code speak English at home.
0.2% of residents speak other Indo-European language at home (100% very well).
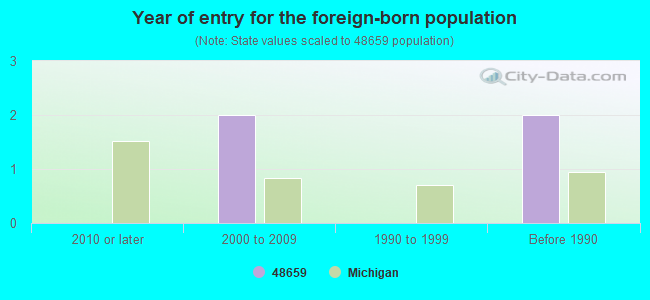
Foreign born population: 3 (0.1%) (100.0% of them are naturalized citizens)
This zip code:
0.1%
Whole state:
6.9%
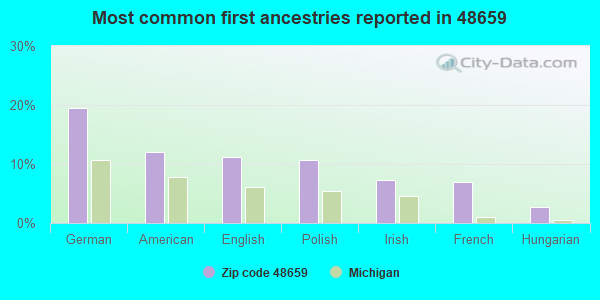
19%German
12%American
11%English
11%Polish
7%Irish
7%French
3%Hungarian
Year of entry for the foreign-born population
02010 or later
22000 to 2009
01990 to 1999
2Before 1990
Facilities with environmental interests located in this zip code:
EIFEL ENERGY LLC (ELLISON & ADAMS RDS in STERLING, MI)
(Resource Conservation and Recovery Act (tracking hazardous waste)) Business NAICS classification: CRUDE PETROLEUM AND NATURAL GAS EXTRACTION.
DUNCAN OIL CO (113 ALMY in STERLING, MI)
(Resource Conservation and Recovery Act (tracking hazardous waste))
Housing units lacking complete plumbing facilities: 1.8% Housing units lacking complete kitchen facilities: 2.0%
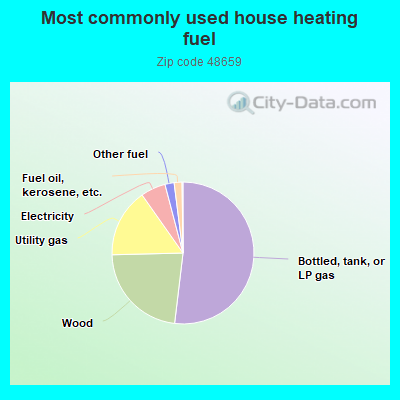
52.1%Bottled, tank, or LP gas
22.8%Wood
15.7%Utility gas
5.7%Electricity
2.1%Other fuel
1.8%Fuel oil, kerosene, etc.
Population in 1990: 2,855.
Place of birth for U.S.-born residents:
This state: 2,368
Northeast: 21
Midwest: 109
South: 89
West: 35
70% of the 48659 zip code residents lived in the same house 5 years ago. Out of people who lived in different houses, 48% lived in this county. Out of people who lived in different counties, 50% lived in Michigan.
93% of the 48659 zip code residents lived in the same house 1 year ago. Out of people who lived in different houses, 32% moved from this county. Out of people who lived in different houses, 55% moved from different county within same state. Out of people who lived in different houses, 13% moved from different state.
Private vs. public school enrollment:
Students in private schools in grades 1 to 8 (elementary and middle school): 10
Here:
3.5%
Michigan:
12.4%
Students in private schools in grades 9 to 12 (high school): 7
Here:
5.8%
Michigan:
9.8%
Students in private undergraduate colleges:
Here:
1.4%
Michigan:
14.9%
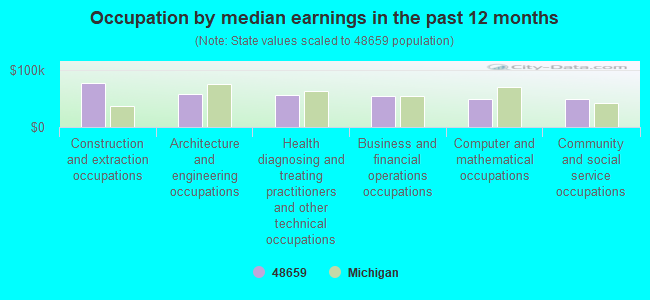
Occupation by median earnings in the past 12 months ($)
77,825Construction and extraction occupations
57,617Architecture and engineering occupations
57,363Health diagnosing and treating practitioners and other technical occupations
55,048Business and financial operations occupations
49,517Computer and mathematical occupations
49,204Community and social service occupations
Top industries in this zip code by the number of employees in 2005:
Health Care and Social Assistance: Nursing Care Facilities (100-249 employees: 1 establishment)
Accommodation and Food Services: Full-Service Restaurants (50-99: 1, 10-19: 1)
Health Care and Social Assistance: All Other Outpatient Care Centers (20-49: 1)
Health Care and Social Assistance: Child Day Care Services (5-9: 1, 1-4: 5)
Construction: Other Foundation, Structure, and Building Exterior Contractors (10-19: 1)
Real Estate and Rental and Leasing: Recreational Goods Rental (5-9: 1, 1-4: 1)
Wholesale Trade: Petroleum and Petroleum Products Merchant Wholesalers (except Bulk Stations and Terminals) (5-9: 1)
People in group quarters in 2010:
73 people in nursing facilities/skilled-nursing facilities
People in group quarters in 2000:
70 people in nursing homes
12 people in other group homes
Fatal accident statistics in 2010:
Fatal accident count: 2
Vehicles involved in fatal accidents: 2
Fatal accidents caused by drunken drivers: 1
Fatalities: 3
Persons involved in fatal accidents: 6
Pedestrians involved in fatal accidents: 0
2002 - 2018 National Fire Incident Reporting System (NFIRS) incidents
Based on the data from the years 2002 - 2018 the average number of fire incidents per year is 27. The highest number of reported fires - 44 took place in 2006, and the least - 6 in 2002. The data has an increasing trend.
When looking into fire subcategories, the most incidents belonged to: Outside Fires (46.8%), and Structure Fires (30.7%).
Fire incident types reported to NFIRS in Zip Code 48659
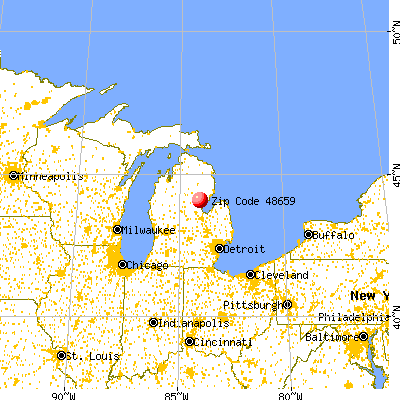


 Nearest zip codes: 48658, 48749, 48610, 48613, 48756, 48766.


 Based on the data from the years 2002 - 2018 the average number of fire incidents per year is 27. The highest number of reported fires - 44 took place in 2006, and the least - 6 in 2002. The data has an increasing trend.
 When looking into fire subcategories, the most incidents belonged to: Outside Fires (46.8%), and Structure Fires (30.7%).