Estimated zip code population in 2022: 3,583 Zip code population in 2010: 4,043 Zip code population in 2000: 4,615
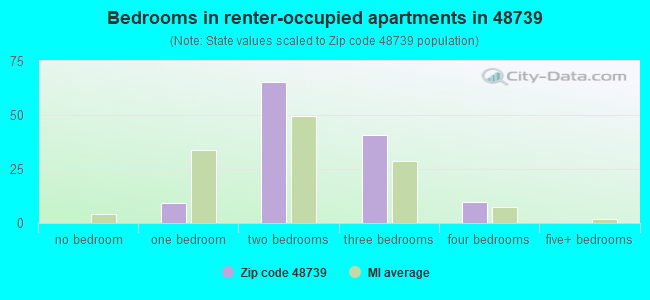
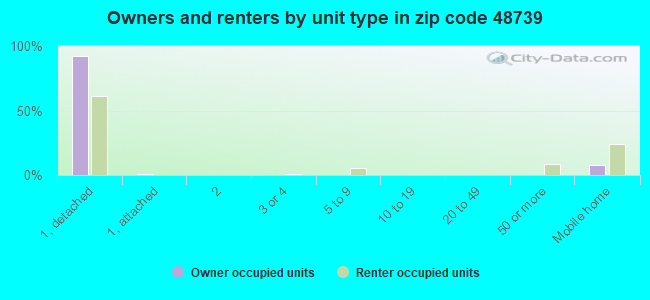
Houses and condos: 4,182 Renter-occupied apartments: 125
% of renters here:
7%
State:
27%
March 2022 cost of living index in zip code 48739: 81.8 (low, U.S. average is 100)
Land area: 93.2 sq. mi. Water area: 5.1 sq. mi.
Population density: 38 people per square mile
(very low).
OSM Map
General Map
Google Map
MSN Map
OSM Map
General Map
Google Map
MSN Map
OSM Map
General Map
Google Map
MSN Map
OSM Map
General Map
Google Map
MSN Map
Please wait while loading the map...
Real estate property taxes paid for housing units in 2022:
This zip code:
0.8% ($1,413)
Michigan:
1.2% ($2,746)
Median real estate property taxes paid for housing units with mortgages in 2022: $1,434 (0.8%) Median real estate property taxes paid for housing units with no mortgage in 2022: $1,397 (0.9%)
Business Search- 14 Million verified businesses
Males: 1,951
(54.5%)
Females: 1,632
(45.5%)
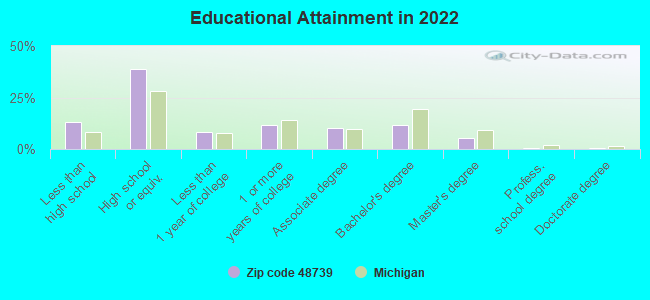
For population 25 years and over in 48739:
High school or higher: 86.5%
Bachelor's degree or higher: 18.0%
Graduate or professional degree: 6.6%
Unemployed: 4.4%
Mean travel time to work (commute): 37.4 minutes
For population 15 years and over in 48739:
Never married: 12.5%
Now married: 61.6%
Separated: 1.8%
Widowed: 10.7%
Divorced: 13.5%
Zip code 48739 compared to state average:
Median household income below state average.
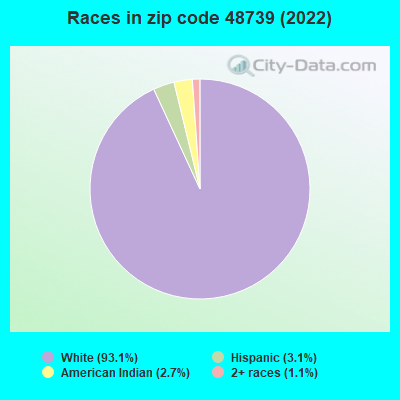
Black race population percentage significantly below state average.
Hispanic race population percentage below state average.
Median age significantly above state average.
Foreign-born population percentage significantly below state average.
Renting percentage significantly below state average.
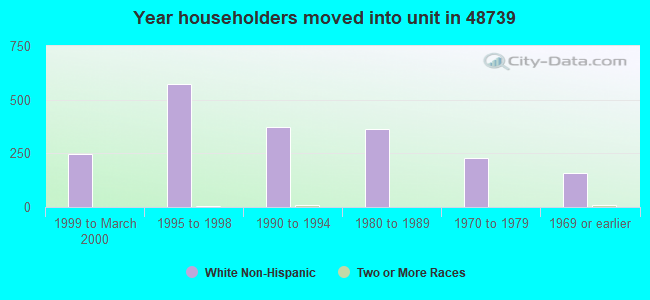
Length of stay since moving in significantly above state average.
Averages for the 2020 tax year for zip code 48739, filed in 2021:
Average Adjusted Gross Income (AGI) in 2020: $46,439 (Individual Income Tax Returns)
Here:
$46,439
State:
$68,945
Salary/wage: $37,959 (reported on 60.5% of returns)
Here:
$37,959
State:
$57,142
(% of AGI for various income ranges: 689.1% for AGIs below $25k, 2310.0% for AGIs $25k-50k, 4577.5% for AGIs $50k-75k, 7189.0% for AGIs $75k-100k, 11564.0% for AGIs $100k-200k)
Taxable interest for individuals: $1,761 (reported on 35.7% of returns)
This zip code:
$1,761
Michigan:
$1,630
(% of AGI for various income ranges: 29.3% for AGIs below $25k, 48.2% for AGIs $25k-50k, 136.9% for AGIs $50k-75k, 192.0% for AGIs $75k-100k, 346.0% for AGIs $100k-200k)
Ordinary dividends: $3,058 (reported on 19.5% of returns)
Here:
$3,058
State:
$6,972
(% of AGI for various income ranges: 32.0% for AGIs below $25k, 50.3% for AGIs $25k-50k, 116.9% for AGIs $50k-75k, 208.0% for AGIs $75k-100k, 339.0% for AGIs $100k-200k)
Net capital gain/loss in AGI: +$6,221 (reported on 18.4% of returns)
Here:
+$6,221
State:
+$20,064
(% of AGI for various income ranges: 11.3% for AGIs below $25k, 29.2% for AGIs $25k-50k, 196.2% for AGIs $50k-75k, 459.0% for AGIs $75k-100k, 1169.0% for AGIs $100k-200k)
Profit/loss from business: +$6,558 (reported on 10.3% of returns)
Here:
+$6,558
State:
+$11,172
(% of AGI for various income ranges: 51.8% for AGIs below $25k, 102.6% for AGIs $25k-50k, 233.1% for AGIs $50k-75k, 198.0% for AGIs $100k-200k)
Taxable individual retirement arrangement distribution: $16,600 (reported on 16.8% of returns)
48739:
$16,600
Michigan:
$19,803
(% of AGI for various income ranges: 118.9% for AGIs below $25k, 213.4% for AGIs $25k-50k, 468.1% for AGIs $50k-75k, 657.0% for AGIs $75k-100k, 2275.0% for AGIs $100k-200k)
Total itemized deductions: $30,514 (reported on 3.8% of returns)
Here:
$30,514
State:
$34,117
(% of AGI for various income ranges: 685.6% for AGIs $50k-75k, 1039.0% for AGIs $100k-200k)
Charity contributions: $8,475 (reported on 2.2% of returns)
Here:
$8,475
State:
$13,548
(% of AGI for various income ranges: 18.2% for AGIs $25k-50k, 270.0% for AGIs $100k-200k)
Taxes paid: $5,900 (reported on 3.8% of returns)
48739:
$5,900
State:
$7,972
(% of AGI for various income ranges: 102.5% for AGIs $50k-75k, 249.0% for AGIs $100k-200k)
Earned income credit: $1,926 (reported on 14.6% of returns)
Here:
$1,926
State:
$2,251
(% of AGI for various income ranges: 45.6% for AGIs below $25k, 70.8% for AGIs $25k-50k)
Percentage of individuals using paid preparers for their 2020 taxes: 93.5%
Here:
94%
State:
93%
(% for various income ranges: 93.6% for AGIs below $25k, 93.6% for AGIs $25k-50k, 91.7% for AGIs $50k-75k, 93.8% for AGIs $75k-100k, 94.1% for AGIs $100k-200k, 100.0% for AGIs over 200k)
Averages for the 2012 tax year for zip code 48739, filed in 2013:
Average Adjusted Gross Income (AGI) in 2012: $36,462 (Individual Income Tax Returns)
Here:
$36,462
State:
$55,609
Salary/wage: $24,049 (reported on 69.8% of returns)
Here:
$24,049
State:
$46,782
(% of AGI for various income ranges: 49.5% for AGIs below $25k, 48.2% for AGIs $25k-50k, 49.2% for AGIs $50k-75k, 44.5% for AGIs $75k-100k, 40.1% for AGIs $100k-200k)
Taxable interest for individuals: $1,178 (reported on 40.1% of returns)
This zip code:
$1,178
Michigan:
$1,491
(% of AGI for various income ranges: 2.5% for AGIs below $25k, 1.4% for AGIs $25k-50k, 0.9% for AGIs $50k-75k, 0.7% for AGIs $75k-100k, 1.0% for AGIs $100k-200k)
Ordinary dividends: $2,625 (reported on 18.6% of returns)
Here:
$2,625
State:
$6,225
(% of AGI for various income ranges: 1.7% for AGIs below $25k, 1.3% for AGIs $25k-50k, 1.6% for AGIs $50k-75k, 1.3% for AGIs $75k-100k, 1.0% for AGIs $100k-200k)
Net capital gain/loss in AGI: +$3,625 (reported on 14.0% of returns)
Here:
+$3,625
State:
+$9,326
(% of AGI for various income ranges: 0.4% for AGIs $50k-75k, 0.9% for AGIs $75k-100k, 5.2% for AGIs $100k-200k)
Profit/loss from business: +$6,686 (reported on 12.8% of returns)
Here:
+$6,686
State:
+$11,523
(% of AGI for various income ranges: 4.5% for AGIs below $25k, 2.0% for AGIs $25k-50k, 1.6% for AGIs $50k-75k, 5.3% for AGIs $75k-100k)
Taxable individual retirement arrangement distribution: $13,234 (reported on 16.9% of returns)
48739:
$13,234
Michigan:
$15,298
(% of AGI for various income ranges: 4.1% for AGIs below $25k, 4.5% for AGIs $25k-50k, 5.5% for AGIs $50k-75k, 7.2% for AGIs $75k-100k, 8.9% for AGIs $100k-200k)
Total itemized deductions: $17,375 (25% of AGI, reported on 18.6% of returns)
Here:
$17,375
State:
$21,628
Here:
24.5% of AGI
State:
18.4% of AGI
(% of AGI for various income ranges: 6.7% for AGIs below $25k, 8.7% for AGIs $25k-50k, 10.1% for AGIs $50k-75k, 8.0% for AGIs $75k-100k, 10.1% for AGIs $100k-200k)
Charity contributions: $2,683 (reported on 14.0% of returns)
Here:
$2,683
State:
$4,225
(% of AGI for various income ranges: 0.6% for AGIs below $25k, 0.8% for AGIs $25k-50k, 1.1% for AGIs $50k-75k, 1.3% for AGIs $75k-100k, 1.3% for AGIs $100k-200k)
Taxes paid: $5,016 (reported on 18.6% of returns)
48739:
$5,016
State:
$8,327
(% of AGI for various income ranges: 1.1% for AGIs below $25k, 1.7% for AGIs $25k-50k, 2.9% for AGIs $50k-75k, 2.1% for AGIs $75k-100k, 4.4% for AGIs $100k-200k)
Earned income credit: $2,135 (reported on 19.8% of returns)
Here:
$2,135
State:
$2,306
(% of AGI for various income ranges: 5.3% for AGIs below $25k, 1.0% for AGIs $25k-50k)
Percentage of individuals using paid preparers for their 2012 taxes: 61.6%
Here:
62%
State:
57%
(% for various income ranges: 56.0% for AGIs below $25k, 63.4% for AGIs $25k-50k, 68.4% for AGIs $50k-75k, 72.7% for AGIs $75k-100k, 80.0% for AGIs $100k-200k)
Averages for the 2004 tax year for zip code 48739, filed in 2005:
Average Adjusted Gross Income (AGI) in 2004: $29,092 (Individual Income Tax Returns)
Here:
$29,092
State:
$48,204
Salary/wage: $21,542 (reported on 76.0% of returns)
Here:
$21,542
State:
$42,791
(% of AGI for various income ranges: 72.1% for AGIs below $10k, 50.2% for AGIs $10k-25k, 56.5% for AGIs $25k-50k, 58.1% for AGIs $50k-75k, 58.5% for AGIs $75k-100k, 55.0% for AGIs over 100k)
Taxable interest for individuals: $1,656 (reported on 53.9% of returns)
This zip code:
$1,656
Michigan:
$1,725
(% of AGI for various income ranges: 8.9% for AGIs below $10k, 4.7% for AGIs $10k-25k, 2.8% for AGIs $25k-50k, 2.2% for AGIs $50k-75k, 1.2% for AGIs $75k-100k, 2.8% for AGIs over 100k)
Taxable dividends: $1,726 (reported on 21.6% of returns)
Here:
$1,726
State:
$3,420
(% of AGI for various income ranges: 2.5% for AGIs below $10k, 1.2% for AGIs $10k-25k, 1.2% for AGIs $25k-50k, 1.2% for AGIs $50k-75k, 0.9% for AGIs $75k-100k, 1.7% for AGIs over 100k)
Net capital gain/loss: +$2,429 (reported on 18.2% of returns)
Here:
+$2,429
State:
+$8,532
(% of AGI for various income ranges: -1.1% for AGIs below $10k, 1.0% for AGIs $10k-25k, 1.5% for AGIs $25k-50k, 1.6% for AGIs $50k-75k, 0.2% for AGIs $75k-100k, 4.1% for AGIs over 100k)
Profit/loss from business: +$4,764 (reported on 13.1% of returns)
Here:
+$4,764
State:
+$9,547
(% of AGI for various income ranges: 5.3% for AGIs below $10k, 2.8% for AGIs $10k-25k, 1.7% for AGIs $25k-50k, 1.7% for AGIs $50k-75k, 4.4% for AGIs $75k-100k)
IRA payment deduction: $2,379 (reported on 1.6% of returns)
48739:
$2,379
Michigan:
$2,875
Total itemized deductions: $15,040 (26% of AGI, reported on 17.7% of returns)
Here:
$15,040
State:
$18,509
Here:
26.1% of AGI
State:
20.7% of AGI
(% of AGI for various income ranges: 8.7% for AGIs below $10k, 5.6% for AGIs $10k-25k, 8.5% for AGIs $25k-50k, 10.4% for AGIs $50k-75k, 12.7% for AGIs $75k-100k, 10.4% for AGIs over 100k)
Charity contributions deductions: $2,283 (4% of AGI, reported on 14.8% of returns)
Here:
$2,283
State:
$3,365
Here:
3.8% of AGI
State:
3.6% of AGI
(% of AGI for various income ranges: 0.5% for AGIs $10k-25k, 1.0% for AGIs $25k-50k, 1.4% for AGIs $50k-75k, 1.6% for AGIs $75k-100k, 1.9% for AGIs over 100k)
Total tax: $3,367 (reported on 68.7% of returns)
48739:
$3,367
State:
$7,691
(% of AGI for various income ranges: 2.1% for AGIs below $10k, 3.1% for AGIs $10k-25k, 5.9% for AGIs $25k-50k, 8.9% for AGIs $50k-75k, 10.7% for AGIs $75k-100k, 16.8% for AGIs over 100k)
Earned income credit: $1,658 (reported on 19.4% of returns)
Here:
$1,658
State:
$1,737
Percentage of individuals using paid preparers for their 2004 taxes: 69.3%
Here:
69%
State:
60%
(% for various income ranges: 60.7% for AGIs below $10k, 73.4% for AGIs $10k-25k, 69.0% for AGIs $25k-50k, 72.6% for AGIs $50k-75k, 77.9% for AGIs $75k-100k, 80.0% for AGIs over 100k)
Likely homosexual households (counted as self-reported same-sex unmarried-partner households)
Lesbian couples: 0.3% of all households
Gay men: 0.0% of all households
Household received Food Stamps/SNAP in the past 12 months: 207 Household did not receive Food Stamps/SNAP in the past 12 months: 1,588
Women who had a birth in the past 12 months: 17 (9 now married, 7 unmarried) Women who did not have a birth in the past 12 months: 361 (221 now married, 138 unmarried)
Housing units in zip code 48739 with a mortgage: 697 (45 second mortgage, 3 home equity loan, 41 both second mortgage and home equity loan) Houses without a mortgage: 114
Median monthly owner costs for units with a mortgage: $1,098 Median monthly owner costs for units without a mortgage: $425
Residents with income below the poverty level in 2022:
This zip code:
12.7%
Whole state:
13.4%
Residents with income below 50% of the poverty level in 2022:
This zip code:
6.6%
Whole state:
6.9%
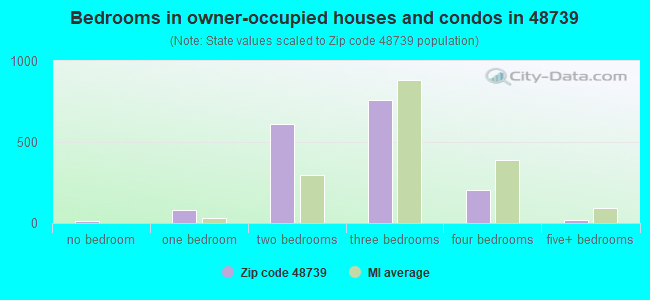
Median number of rooms in houses and condos:
Here:
5.9
State:
6.5
Median number of rooms in apartments:
Here:
4.7
State:
4.3
Notable locations in this zip code not listed on our city pages
Notable locations in zip code 48739: Camp Mahn-Go-Tah-See (A), Iosco County Fairgrounds (B), Wicker Hills Golf Club (C), Camp Maqua (D), Hale Plainfield Township park Campground and Picnic Area (E), Iosco County Emergency Medical Services Station 2 (F), Plainfield Township Hall (G), Plainfield Library (H), Plainfield Township Fire Department (I). Display/hide their locations on the map
Churches in zip code 48739 include: Kingdom Hall of Jehovah's Witnesses (A), Hale Baptist Church (B), Harvest Tabernacle Assembly Church (C), Hale United Methodist Church (D), Saint Paul's Lutheran Church (E), Roadside Chapel (F), Prescott Church (G), Saint Pius X Church (H). Display/hide their locations on the map
Lakes: Vaughn Lake (A), Little Stylus Lake (B), Little Long Lake (C), Au Sable Lake (D), Lake Augustina (E), Little Cranberry Lake (F), Dollar Lake (G), Esmond Lake (H). Display/hide their locations on the map
Streams, rivers, and creeks: Addy Drain (A), Hale Creek (B), Maggie Creek (C), Mitchell Creek (D), Nester Creek (E). Display/hide their locations on the map
In group quarters: 2 (-1 institutionalized population)
Size of family households: 773 2-persons, 153 3-persons, 108 4-persons, 52 5-persons, 4 6-persons
Size of nonfamily households: 624 1-person, 94 2-persons
324 married couples with children.
168 single-parent households (113 men, 55 women).
98.9% of residents of 48739 zip code speak English at home.
0.4% of residents speak Spanish at home (100% very well).
0.5% of residents speak other Indo-European language at home (88% very well, 12% well).
1.4% of residents speak other language at home (100% very well).
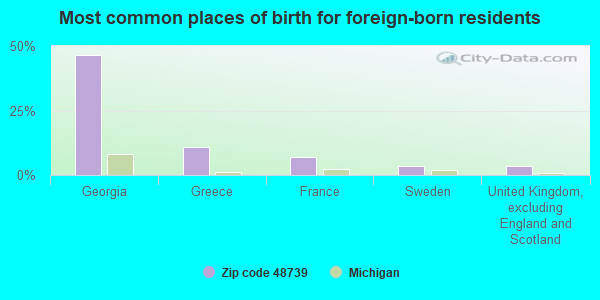
Foreign born population: 28 (0.8%) (72.5% of them are naturalized citizens)
This zip code:
0.8%
Whole state:
6.9%
46%Georgia
11%Greece
7%France
4%Sweden
4%United Kingdom, excluding England and Scotland
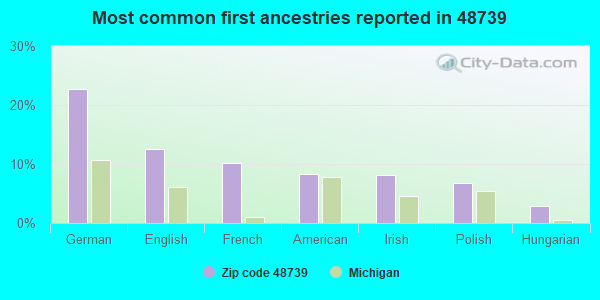
23%German
12%English
10%French
8%American
8%Irish
7%Polish
3%Hungarian
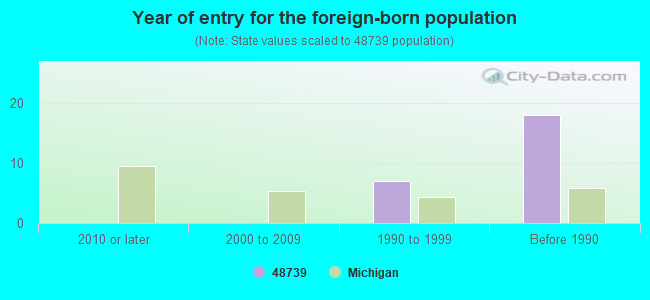
Year of entry for the foreign-born population
02010 or later
02000 to 2009
71990 to 1999
18Before 1990
Facilities with environmental interests located in this zip code:
MI DEPT/MILITARY & VETERANS AFFAIRS (MILITARY RD AND MI RTE 93 in HALE, MI)
(Resource Conservation and Recovery Act (tracking hazardous waste)) Organizations: MICHIGAN STATE OF (CONTACT/OWNER)
Alternative names: GRAYLING ARMORY
MI DEPT/TRANSPORTATION BRIDGE B02-35012 (M-65 OVER AU SABLE RIVER in HALE, MI)
(Resource Conservation and Recovery Act (tracking hazardous waste)) Organizations: MICH DEPT OF TRANSPORTATION (CONTACT/OPERATOR)
Alternative names: MIDOT BRIDGE M-65 OVER AUSABLE RIVER
MI DEPT/STATE POLICE (6675 ESMOND in HALE, MI)
(Resource Conservation and Recovery Act (tracking hazardous waste))
Housing units lacking complete plumbing facilities: 3.8% Housing units lacking complete kitchen facilities: 2.8%
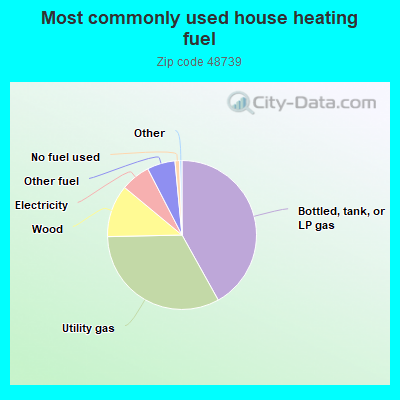
42.0%Bottled, tank, or LP gas
32.8%Utility gas
11.4%Wood
6.4%Electricity
6.1%Other fuel
1.0%No fuel used
Population in 1990: 3,317. Population change in the 1990s: +1,298 (+39.1%).
Place of birth for U.S.-born residents:
This state: 3,088
Northeast: 33
Midwest: 231
South: 131
West: 67
61% of the 48739 zip code residents lived in the same house 5 years ago. Out of people who lived in different houses, 32% lived in this county. Out of people who lived in different counties, 50% lived in Michigan.
92% of the 48739 zip code residents lived in the same house 1 year ago. Out of people who lived in different houses, 21% moved from this county. Out of people who lived in different houses, 58% moved from different county within same state. Out of people who lived in different houses, 24% moved from different state.
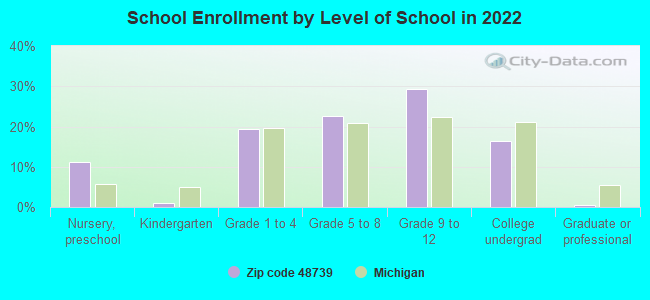
Private vs. public school enrollment:
Students in private schools in grades 1 to 8 (elementary and middle school):
Here:
0.0%
Michigan:
12.4%
Students in private schools in grades 9 to 12 (high school):
Here:
0.0%
Michigan:
9.8%
Students in private undergraduate colleges:
Here:
0.0%
Michigan:
14.9%
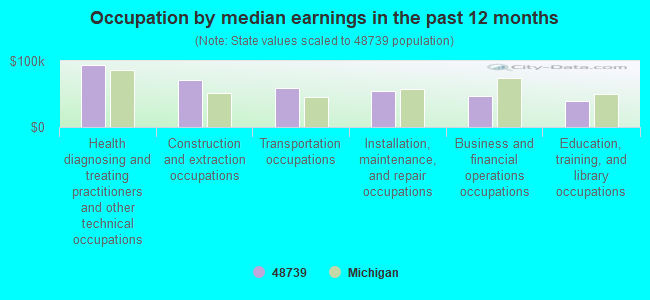
Occupation by median earnings in the past 12 months ($)
93,726Health diagnosing and treating practitioners and other technical occupations
70,948Construction and extraction occupations
58,369Transportation occupations
54,193Installation, maintenance, and repair occupations
46,942Business and financial operations occupations
40,106Education, training, and library occupations
Top industries in this zip code by the number of employees in 2005:
Construction: Water and Sewer Line and Related Structures Construction (20-49: 1, 1-4: 2)
Other Services (except Public Administration): Religious Organizations (5-9: 2, 1-4: 2)
Mining: Crude Petroleum and Natural Gas Extraction (10-19: 1, 1-4: 1)
Accommodation and Food Services: Limited-Service Restaurants (10-19: 1)
People in group quarters in 2000:
16 people in other group homes
8 people in other noninstitutional group quarters
Fatal accident statistics in 2010:
Fatal accident count: 3
Vehicles involved in fatal accidents: 4
Fatal accidents caused by drunken drivers: 3
Fatalities: 3
Persons involved in fatal accidents: 4
Pedestrians involved in fatal accidents: 0
2002 - 2018 National Fire Incident Reporting System (NFIRS) incidents
According to the data from the years 2002 - 2018 the average number of fire incidents per year is 17. The highest number of fires - 37 took place in 2005, and the least - 4 in 2009. The data has an increasing trend.
When looking into fire subcategories, the most incidents belonged to: Structure Fires (54.2%), and Outside Fires (29.5%).
Fire incident types reported to NFIRS in Zip Code 48739

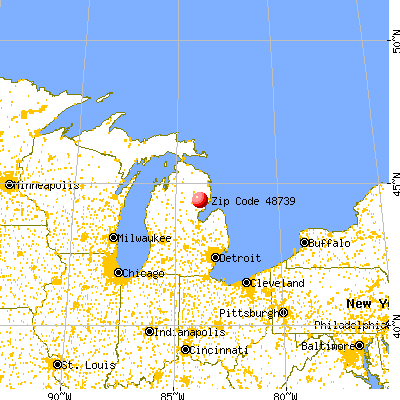


 Nearest zip codes: 48743, 48770, 48761, 48635, 48756, 48737.


 According to the data from the years 2002 - 2018 the average number of fire incidents per year is 17. The highest number of fires - 37 took place in 2005, and the least - 4 in 2009. The data has an increasing trend.
 When looking into fire subcategories, the most incidents belonged to: Structure Fires (54.2%), and Outside Fires (29.5%).