Estimated zip code population in 2022: 3,497 Zip code population in 2010: 3,293 Zip code population in 2000: 3,625
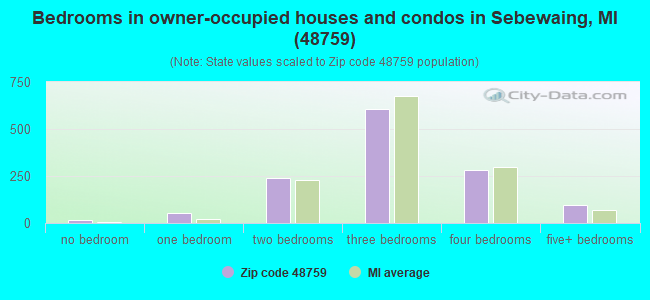
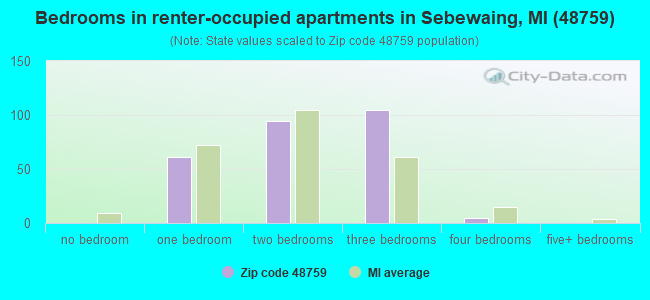
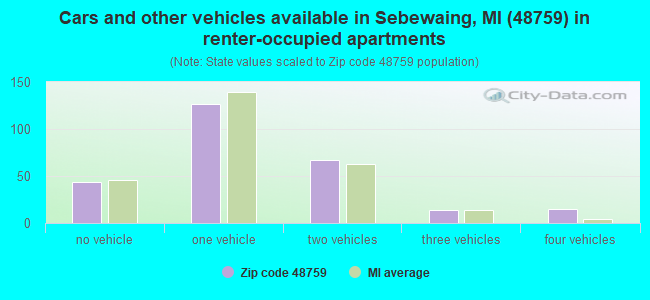
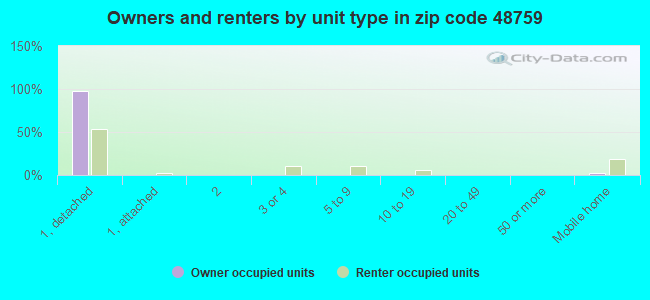
Houses and condos: 1,861 Renter-occupied apartments: 267
% of renters here:
17%
State:
27%
March 2022 cost of living index in zip code 48759: 80.7 (low, U.S. average is 100)
Land area: 49.7 sq. mi. Water area: 1.7 sq. mi.
Population density: 70 people per square mile
(very low).
OSM Map
General Map
Google Map
MSN Map
OSM Map
General Map
Google Map
MSN Map
OSM Map
General Map
Google Map
MSN Map
OSM Map
General Map
Google Map
MSN Map
Please wait while loading the map...
Real estate property taxes paid for housing units in 2022:
This zip code:
1.5% ($1,670)
Michigan:
1.2% ($2,746)
Median real estate property taxes paid for housing units with mortgages in 2022: $2,003 (1.5%) Median real estate property taxes paid for housing units with no mortgage in 2022: $1,537 (1.5%)
Business Search- 14 Million verified businesses
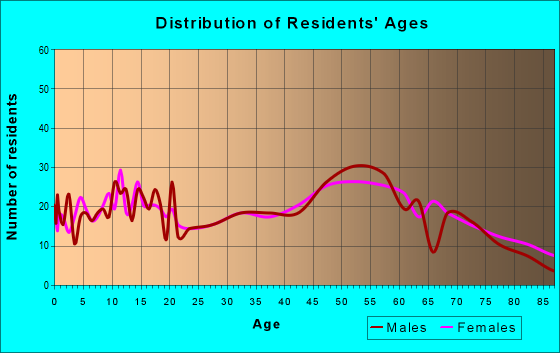
Males: 1,717
(49.1%)
Females: 1,779
(50.9%)
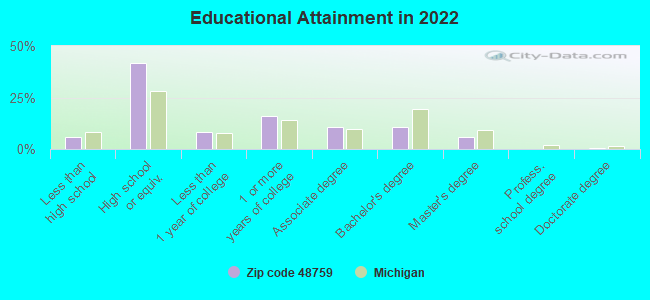
For population 25 years and over in 48759:
High school or higher: 92.9%
Bachelor's degree or higher: 17.1%
Graduate or professional degree: 6.5%
Unemployed: 3.6%
Mean travel time to work (commute): 21.2 minutes
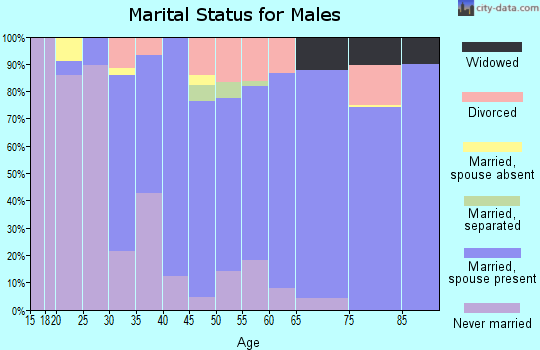
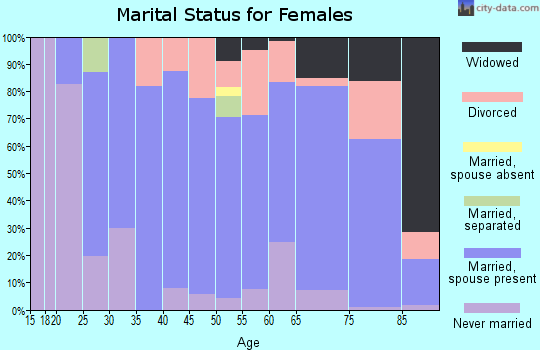
For population 15 years and over in 48759:
Never married: 21.9%
Now married: 54.6%
Separated: 3.5%
Widowed: 9.9%
Divorced: 10.1%
Zip code 48759 compared to state average:
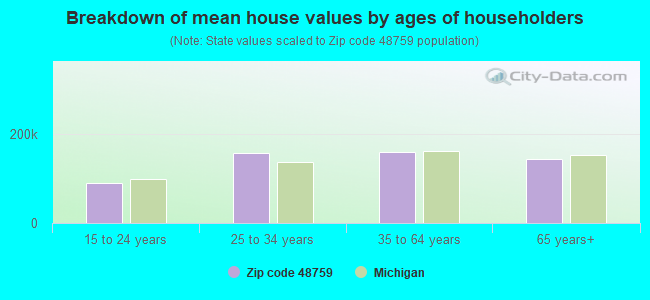
Median house value below state average.
Black race population percentage significantly below state average.
Hispanic race population percentage below state average.
Median age above state average.
Foreign-born population percentage significantly below state average.
Renting percentage below state average.
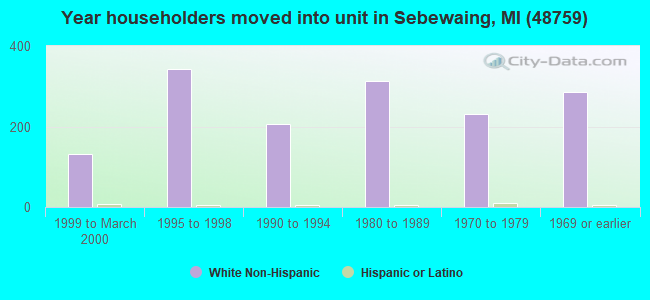
Length of stay since moving in significantly above state average.
House age above state average.
Percentage of population with a bachelor's degree or higher below state average.
Averages for the 2020 tax year for zip code 48759, filed in 2021:
Average Adjusted Gross Income (AGI) in 2020: $53,725 (Individual Income Tax Returns)
Here:
$53,725
State:
$68,945
Salary/wage: $45,622 (reported on 76.5% of returns)
Here:
$45,622
State:
$57,142
(% of AGI for various income ranges: 1018.6% for AGIs below $25k, 3399.7% for AGIs $25k-50k, 7053.5% for AGIs $50k-75k, 9069.1% for AGIs $75k-100k, 12901.7% for AGIs $100k-200k)
Taxable interest for individuals: $1,104 (reported on 33.3% of returns)
This zip code:
$1,104
Michigan:
$1,630
(% of AGI for various income ranges: 27.7% for AGIs below $25k, 27.7% for AGIs $25k-50k, 42.9% for AGIs $50k-75k, 46.4% for AGIs $75k-100k, 215.0% for AGIs $100k-200k)
Ordinary dividends: $3,013 (reported on 19.1% of returns)
Here:
$3,013
State:
$6,972
(% of AGI for various income ranges: 16.6% for AGIs below $25k, 38.0% for AGIs $25k-50k, 83.5% for AGIs $50k-75k, 146.4% for AGIs $75k-100k, 382.5% for AGIs $100k-200k)
Net capital gain/loss in AGI: +$5,962 (reported on 16.0% of returns)
Here:
+$5,962
State:
+$20,064
(% of AGI for various income ranges: 12.3% for AGIs below $25k, 17.0% for AGIs $25k-50k, 95.3% for AGIs $50k-75k, 76.4% for AGIs $75k-100k, 294.2% for AGIs $100k-200k)
Profit/loss from business: +$5,337 (reported on 11.7% of returns)
Here:
+$5,337
State:
+$11,172
(% of AGI for various income ranges: 32.3% for AGIs below $25k, 103.3% for AGIs $25k-50k, 84.7% for AGIs $50k-75k, 158.2% for AGIs $75k-100k, 227.5% for AGIs $100k-200k)
Taxable individual retirement arrangement distribution: $10,384 (reported on 11.7% of returns)
48759:
$10,384
Michigan:
$19,803
(% of AGI for various income ranges: 101.1% for AGIs below $25k, 119.7% for AGIs $25k-50k, 136.5% for AGIs $50k-75k, 423.6% for AGIs $75k-100k, 468.3% for AGIs $100k-200k)
Total itemized deductions: $30,325 (reported on 2.5% of returns)
Here:
$30,325
State:
$34,117
(% of AGI for various income ranges: 1010.8% for AGIs $100k-200k)
Charity contributions: $9,750 (reported on 2.5% of returns)
Here:
$9,750
State:
$13,548
(% of AGI for various income ranges: 325.0% for AGIs $100k-200k)
Taxes paid: $7,825 (reported on 2.5% of returns)
48759:
$7,825
State:
$7,972
(% of AGI for various income ranges: 260.8% for AGIs $100k-200k)
Earned income credit: $2,068 (reported on 11.7% of returns)
Here:
$2,068
State:
$2,251
(% of AGI for various income ranges: 67.1% for AGIs below $25k, 52.7% for AGIs $25k-50k)
Percentage of individuals using paid preparers for their 2020 taxes: 95.1%
Here:
95%
State:
93%
(% for various income ranges: 92.7% for AGIs below $25k, 95.2% for AGIs $25k-50k, 96.3% for AGIs $50k-75k, 93.8% for AGIs $75k-100k, 100.0% for AGIs $100k-200k, 100.0% for AGIs over 200k)
Averages for the 2012 tax year for zip code 48759, filed in 2013:
Average Adjusted Gross Income (AGI) in 2012: $46,081 (Individual Income Tax Returns)
Here:
$46,081
State:
$55,609
Salary/wage: $37,208 (reported on 78.6% of returns)
Here:
$37,208
State:
$46,782
(% of AGI for various income ranges: 64.4% for AGIs below $25k, 70.8% for AGIs $25k-50k, 77.6% for AGIs $50k-75k, 70.3% for AGIs $75k-100k, 63.6% for AGIs $100k-200k, 27.2% for AGIs over 200k)
Taxable interest for individuals: $1,216 (reported on 39.9% of returns)
This zip code:
$1,216
Michigan:
$1,491
(% of AGI for various income ranges: 2.0% for AGIs below $25k, 1.4% for AGIs $25k-50k, 1.0% for AGIs $50k-75k, 0.8% for AGIs $75k-100k, 0.7% for AGIs $100k-200k, 0.6% for AGIs over 200k)
Ordinary dividends: $3,126 (reported on 20.2% of returns)
Here:
$3,126
State:
$6,225
(% of AGI for various income ranges: 1.6% for AGIs below $25k, 1.2% for AGIs $25k-50k, 0.8% for AGIs $50k-75k, 0.4% for AGIs $75k-100k, 4.3% for AGIs $100k-200k)
Net capital gain/loss in AGI: +$4,539 (reported on 16.7% of returns)
Here:
+$4,539
State:
+$9,326
(% of AGI for various income ranges: 0.7% for AGIs $25k-50k, 0.8% for AGIs $50k-75k, 3.0% for AGIs $75k-100k, 5.6% for AGIs $100k-200k)
Profit/loss from business: +$6,471 (reported on 10.1% of returns)
Here:
+$6,471
State:
+$11,523
(% of AGI for various income ranges: 3.5% for AGIs below $25k, 0.7% for AGIs $25k-50k, 0.7% for AGIs $50k-75k, 5.1% for AGIs $75k-100k)
Taxable individual retirement arrangement distribution: $8,284 (reported on 11.3% of returns)
48759:
$8,284
Michigan:
$15,298
(% of AGI for various income ranges: 4.4% for AGIs below $25k, 2.1% for AGIs $25k-50k, 2.2% for AGIs $50k-75k, 4.4% for AGIs $75k-100k)
Total itemized deductions: $17,081 (17% of AGI, reported on 16.1% of returns)
Here:
$17,081
State:
$21,628
Here:
16.6% of AGI
State:
18.4% of AGI
(% of AGI for various income ranges: 5.1% for AGIs below $25k, 6.1% for AGIs $25k-50k, 5.4% for AGIs $50k-75k, 5.4% for AGIs $75k-100k, 8.2% for AGIs $100k-200k, 5.2% for AGIs over 200k)
Charity contributions: $4,742 (reported on 14.3% of returns)
Here:
$4,742
State:
$4,225
(% of AGI for various income ranges: 1.1% for AGIs below $25k, 0.9% for AGIs $25k-50k, 1.0% for AGIs $50k-75k, 1.6% for AGIs $75k-100k, 4.1% for AGIs $100k-200k)
Taxes paid: $5,815 (reported on 15.5% of returns)
48759:
$5,815
State:
$8,327
(% of AGI for various income ranges: 0.9% for AGIs below $25k, 1.2% for AGIs $25k-50k, 1.4% for AGIs $50k-75k, 1.9% for AGIs $75k-100k, 3.0% for AGIs $100k-200k, 3.2% for AGIs over 200k)
Earned income credit: $2,044 (reported on 14.9% of returns)
Here:
$2,044
State:
$2,306
(% of AGI for various income ranges: 4.6% for AGIs below $25k, 0.8% for AGIs $25k-50k)
Percentage of individuals using paid preparers for their 2012 taxes: 67.3%
Here:
67%
State:
57%
(% for various income ranges: 59.7% for AGIs below $25k, 66.7% for AGIs $25k-50k, 70.4% for AGIs $50k-75k, 78.6% for AGIs $75k-100k, 90.0% for AGIs $100k-200k, 100.0% for AGIs over 200k)
Averages for the 2004 tax year for zip code 48759, filed in 2005:
Average Adjusted Gross Income (AGI) in 2004: $32,342 (Individual Income Tax Returns)
Here:
$32,342
State:
$48,204
Salary/wage: $30,184 (reported on 78.4% of returns)
Here:
$30,184
State:
$42,791
(% of AGI for various income ranges: 140.0% for AGIs below $10k, 59.9% for AGIs $10k-25k, 76.2% for AGIs $25k-50k, 75.6% for AGIs $50k-75k, 81.1% for AGIs $75k-100k, 59.8% for AGIs over 100k)
Taxable interest for individuals: $1,622 (reported on 55.1% of returns)
This zip code:
$1,622
Michigan:
$1,725
(% of AGI for various income ranges: 16.9% for AGIs below $10k, 4.9% for AGIs $10k-25k, 2.9% for AGIs $25k-50k, 1.8% for AGIs $50k-75k, 0.5% for AGIs $75k-100k, 2.8% for AGIs over 100k)
Taxable dividends: $1,670 (reported on 25.2% of returns)
Here:
$1,670
State:
$3,420
(% of AGI for various income ranges: 8.5% for AGIs below $10k, 1.9% for AGIs $10k-25k, 1.1% for AGIs $25k-50k, 0.5% for AGIs $50k-75k, 0.6% for AGIs $75k-100k, 2.5% for AGIs over 100k)
Net capital gain/loss: +$3,870 (reported on 19.3% of returns)
Here:
+$3,870
State:
+$8,532
(% of AGI for various income ranges: 0.4% for AGIs below $10k, 1.3% for AGIs $10k-25k, 1.1% for AGIs $25k-50k, 1.9% for AGIs $50k-75k, 1.9% for AGIs $75k-100k, 7.3% for AGIs over 100k)
Profit/loss from business: +$4,851 (reported on 11.3% of returns)
Here:
+$4,851
State:
+$9,547
(% of AGI for various income ranges: 0.8% for AGIs below $10k, 2.8% for AGIs $10k-25k, 1.2% for AGIs $25k-50k, 3.6% for AGIs $50k-75k, -0.4% for AGIs $75k-100k)
Profit/loss from farming: +$2,790 (reported on 4.5% of returns)
Here:
+$2,790
State:
-$4,492
(% of AGI for various income ranges: -3.7% for AGIs below $10k, 1.2% for AGIs $10k-25k, 1.0% for AGIs $25k-50k, 0.3% for AGIs $50k-75k, -0.6% for AGIs $75k-100k)
IRA payment deduction: $2,618 (reported on 3.1% of returns)
48759:
$2,618
Michigan:
$2,875
Total itemized deductions: $14,332 (24% of AGI, reported on 18.2% of returns)
Here:
$14,332
State:
$18,509
Here:
23.9% of AGI
State:
20.7% of AGI
(% of AGI for various income ranges: 35.3% for AGIs below $10k, 8.5% for AGIs $10k-25k, 6.4% for AGIs $25k-50k, 6.1% for AGIs $50k-75k, 9.3% for AGIs $75k-100k, 10.2% for AGIs over 100k)
Charity contributions deductions: $3,258 (5% of AGI, reported on 16.8% of returns)
Here:
$3,258
State:
$3,365
Here:
5.3% of AGI
State:
3.6% of AGI
(% of AGI for various income ranges: 2.1% for AGIs below $10k, 1.6% for AGIs $10k-25k, 1.0% for AGIs $25k-50k, 1.5% for AGIs $50k-75k, 1.8% for AGIs $75k-100k, 3.3% for AGIs over 100k)
Total tax: $4,078 (reported on 72.2% of returns)
48759:
$4,078
State:
$7,691
(% of AGI for various income ranges: 9.0% for AGIs below $10k, 4.1% for AGIs $10k-25k, 6.7% for AGIs $25k-50k, 9.0% for AGIs $50k-75k, 10.1% for AGIs $75k-100k, 17.9% for AGIs over 100k)
Earned income credit: $1,518 (reported on 12.8% of returns)
Here:
$1,518
State:
$1,737
Percentage of individuals using paid preparers for their 2004 taxes: 65.6%
Here:
66%
State:
60%
(% for various income ranges: 59.5% for AGIs below $10k, 65.7% for AGIs $10k-25k, 67.1% for AGIs $25k-50k, 70.0% for AGIs $50k-75k, 64.4% for AGIs $75k-100k, 83.3% for AGIs over 100k)
Household received Food Stamps/SNAP in the past 12 months: 124 Household did not receive Food Stamps/SNAP in the past 12 months: 1,424
Women who had a birth in the past 12 months: 39 (40 now married, 0 unmarried) Women who did not have a birth in the past 12 months: 579 (280 now married, 297 unmarried)
Housing units in zip code 48759 with a mortgage: 449 (23 second mortgage, 8 home equity loan, 16 both second mortgage and home equity loan) Houses without a mortgage: 11
Median monthly owner costs for units with a mortgage: $1,003 Median monthly owner costs for units without a mortgage: $456
Residents with income below the poverty level in 2022:
This zip code:
10.9%
Whole state:
13.4%
Residents with income below 50% of the poverty level in 2022:
This zip code:
7.4%
Whole state:
6.9%
Median number of rooms in houses and condos:
Here:
6.8
State:
6.5
Median number of rooms in apartments:
Here:
5.1
State:
4.3
Notable locations in this zip code not listed on our city pages
Notable locations in zip code 48759: Sebewaing Station (A), Michigan Sugar Company (B), Sebewaing Elevator Company (C), Evangelical United Brethren Campground (D), Michigan Producers Dairy Company (E), Luckhard Museum (F), Sebewaing Library (G), Sebewaing Township Fire Department (H). Display/hide their locations on the map
Churches in zip code 48759 include: Saint Peter Lutheran Church (A), Saint John Lutheran Church (B), Trinity United Methodist Church (C), New Salem Lutheran Church (D), Immanuel Lutheran Church (E), Faith Bible Baptist Church (F), Sebewaing Assembly of God Church (G), Holy Family Church (H), Kilmanagh Church (I). Display/hide their locations on the map
Parks in zip code 48759 include: South Main Park (1), Sebewaing County Park (2), Pitcher Memorial Park (3), North Side Neighborhood Park (4), Muellerweis Park (5), Indian Mission Historical Marker (6), John C Liken/John C Martini House Historical Marker (7). Display/hide their locations on the map
In group quarters: 33 (-1 institutionalized population)
Size of family households: 477 2-persons, 153 3-persons, 138 4-persons, 129 5-persons, 15 6-persons
Size of nonfamily households: 592 1-person, 49 2-persons
663 married couples with children.
130 single-parent households (27 men, 103 women).
96.9% of residents of 48759 zip code speak English at home.
2.1% of residents speak Spanish at home (80% very well, 20% well).
0.9% of residents speak other Indo-European language at home (100% very well).
0.2% of residents speak Asian or Pacific Island language at home (100% very well).
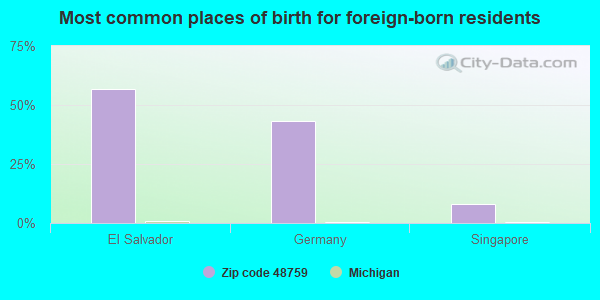
Foreign born population: 36 (1.0%) (33.6% of them are naturalized citizens)
This zip code:
1.0%
Whole state:
6.9%
57%El Salvador
43%Germany
8%Singapore
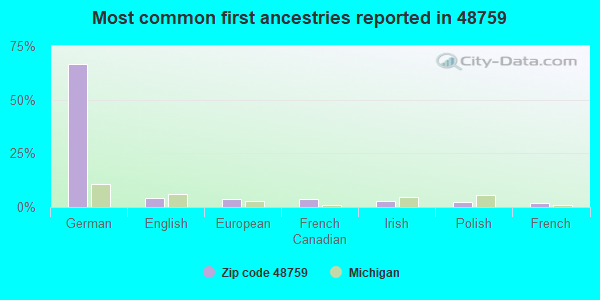
67%German
4%English
4%European
4%French Canadian
3%Irish
2%Polish
2%French
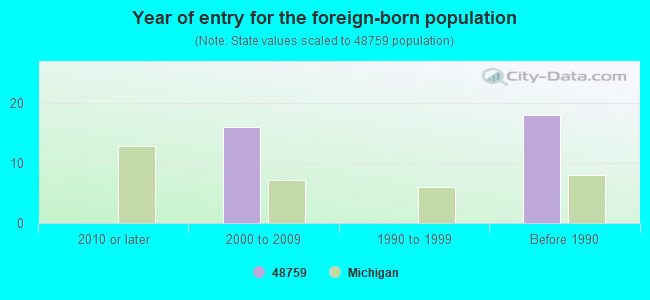
Year of entry for the foreign-born population
02010 or later
162000 to 2009
01990 to 1999
18Before 1990
Facilities with environmental interests located in this zip code:
BAYSIDE BEST BEANS (418 UNION STREET in SEBEWAING, MI)
(Resource Conservation and Recovery Act (tracking hazardous waste)) Organizations: BRAD D WITEK (CONTACT/OWNER)
BAYSIDE MANUF HOME ESTATES (2420 PINETREE DR in SEBEWAING, MI)
National Pollutant Discharge Elimination System NON-MAJOR (Tracking pollutant discharge elimination systems) - permit Business SIC classification: OPERATORS OF RESIDENTIAL MOBILE HOME SITES Alternative names: BAYSIDE MANUF HOME EST WWSL
CHIPPI ENTERPIRISES INC (582 S UNIONVILLE RD in SEBEWAING, MI)
EILER DRYCLEANING (115 E MAIN ST in SEBEWAING, MI)
(Resource Conservation and Recovery Act (tracking hazardous waste)) Organizations: EULER ROBERT (CONTACT/OPERATOR)
MI DEPT/ENVIRONMENTAL QUALITY (106 EAST MAIN in SEBEWAING, MI)
(Resource Conservation and Recovery Act (tracking hazardous waste)) Alternative names: MDEQ
MI DEPT/NATURAL RESOURCES (GETTEL RD in SEBEWAING, MI)
(Resource Conservation and Recovery Act (tracking hazardous waste)) Alternative names: MI DEPT/DNR
MI DEPT/TRANSPORTATION BRIDGE B01-32011 (M25 OVER SEBEWAING RIVER in SEBEWAING, MI)
Conditionally Exempt Small Quantity Generators, less than 100 kg/month of hazardous waste (Resource Conservation and Recovery Act (tracking hazardous waste)) Organizations: MICH DEPT OF TRANSPORTATION (CONTACT/OPERATOR)
GETTEL MOTORS CO (649 S UNIONVILLE RD in SEBEWAING, MI)
Conditionally Exempt Small Quantity Generators, less than 100 kg/month of hazardous waste (Resource Conservation and Recovery Act (tracking hazardous waste)) Organizations: GETTEL MOTORS CO (JIM GETTEL) (CONTACT/OPERATOR)
Alternative names: GETTEL BIG 3 AUTO MALL
DONS BODY SHOP (1043 CANBORO RD in SEBEWAING, MI)
Conditionally Exempt Small Quantity Generators, less than 100 kg/month of hazardous waste (Resource Conservation and Recovery Act (tracking hazardous waste)) - notification Organizations: BEERS DON (CONTACT/OWNER)
Housing units lacking complete plumbing facilities: 0.8% Housing units lacking complete kitchen facilities: 0.4%
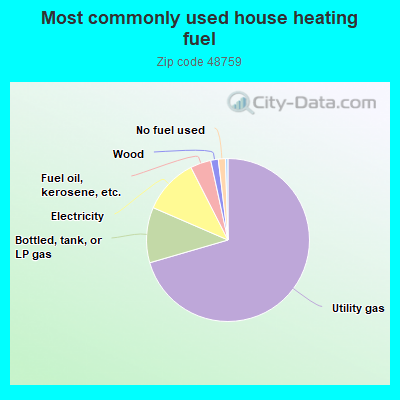
70.5%Utility gas
11.0%Bottled, tank, or LP gas
11.0%Electricity
4.1%Fuel oil, kerosene, etc.
1.5%Wood
1.4%No fuel used
0.5%Other fuel
Population in 1990: 3,203. Population change in the 1990s: +422 (+13.2%).
Place of birth for U.S.-born residents:
This state: 3,040
Northeast: 41
Midwest: 139
South: 176
West: 56
69% of the 48759 zip code residents lived in the same house 5 years ago. Out of people who lived in different houses, 54% lived in this county. Out of people who lived in different counties, 50% lived in Michigan.
94% of the 48759 zip code residents lived in the same house 1 year ago. Out of people who lived in different houses, 36% moved from this county. Out of people who lived in different houses, 54% moved from different county within same state. Out of people who lived in different houses, 12% moved from different state.
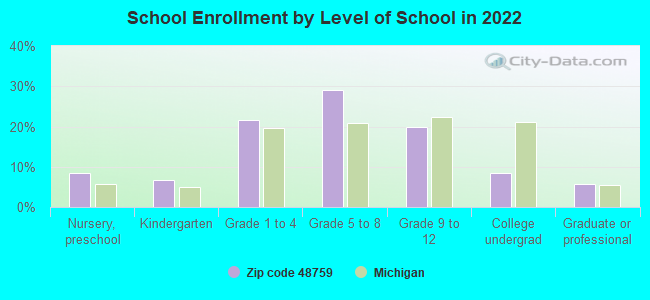
Private vs. public school enrollment:
Students in private schools in grades 1 to 8 (elementary and middle school): 114
Here:
28.8%
Michigan:
12.4%
Students in private schools in grades 9 to 12 (high school): 2
Here:
1.8%
Michigan:
9.8%
Students in private undergraduate colleges:
Here:
0.0%
Michigan:
14.9%
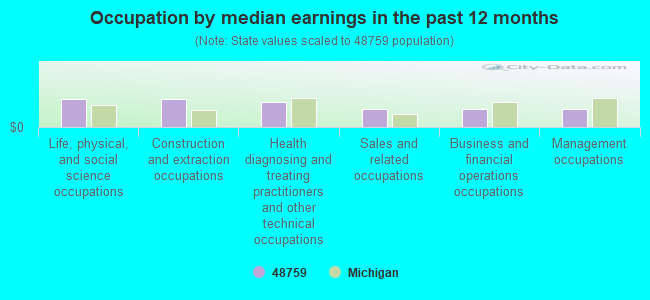
Occupation by median earnings in the past 12 months ($)
78,214Life, physical, and social science occupations
76,914Construction and extraction occupations
70,748Health diagnosing and treating practitioners and other technical occupations
51,342Sales and related occupations
51,015Business and financial operations occupations
48,896Management occupations
Companies with federal contracts located in this zip code:
KEMP TILING COMPANY, INC (8125 LIKEN RD in SEBEWAING, MI; small business) : $0 in 4 contractsin 2005
$3,123 with U.S. Army Corps of Engineers - civil program financing only for Construction of Structures and Facilities -- Other Non-Building Facilities. Signed on 2005-04-22. Completion date: 2005-04-20.
$3,123 with Army for Construction of Structures and Facilities -- Other Non-Building Facilities. Signed on 2005-04-22. Completion date: 2005-04-20.
-$3,123 with U.S. Army Corps of Engineers - civil program financing only for Construction of Structures and Facilities -- Other Non-Building Facilities. Signed on 2005-04-25. Completion date: 2005-04-20.
-$3,123 with Army for Construction of Structures and Facilities -- Other Non-Building Facilities. Signed on 2005-04-25. Completion date: 2005-04-20.
Top industries in this zip code by the number of employees in 2005:
Health Care and Social Assistance: Offices of Chiropractors (50-99 employees: 1 establishment)
Administrative and Support and Waste Management and Remediation Services: Professional Employer Organizations (20-49: 1, 10-19: 1, 1-4: 1)
Accommodation and Food Services: Full-Service Restaurants (20-49: 1, 5-9: 2)
Accommodation and Food Services: Limited-Service Restaurants (20-49: 1, 5-9: 2)
Educational Services: Elementary and Secondary Schools (20-49: 1, 1-4: 1)
Construction: Commercial and Institutional Building Construction (20-49: 1)
People in group quarters in 2010:
3 people in workers' group living quarters and job corps centers
People in group quarters in 2000:
6 people in other group homes
Fatal accident statistics in 2014:
Fatal accident count: 1
Vehicles involved in fatal accidents: 2
Fatal accidents caused by drunken drivers: 0
Fatalities: 1
Persons involved in fatal accidents: 2
Pedestrians involved in fatal accidents: 0
Fatal accident statistics in 2011:
Fatal accident count: 1
Vehicles involved in fatal accidents: 2
Fatal accidents caused by drunken drivers: 0
Fatalities: 2
Persons involved in fatal accidents: 2
Pedestrians involved in fatal accidents: 0
2002 - 2018 National Fire Incident Reporting System (NFIRS) incidents
According to the data from the years 2002 - 2018 the average number of fire incidents per year is 11. The highest number of fires - 18 took place in 2012, and the least - 5 in 2005. The data has a constant trend.
When looking into fire subcategories, the most incidents belonged to: Structure Fires (52.7%), and Outside Fires (30.6%).
Fire incident types reported to NFIRS in Zip Code 48759


+$2,790
-$4,492
(% of AGI for various income ranges: -3.7% for AGIs below $10k, 1.2% for AGIs $10k-25k, 1.0% for AGIs $25k-50k, 0.3% for AGIs $50k-75k, -0.6% for AGIs $75k-100k) Nearest zip codes: 48767, 48720, 48735, 48755, 48754, 48701.
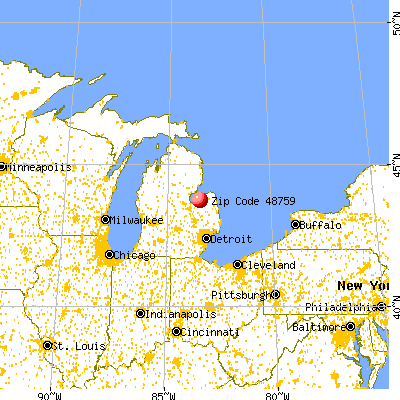
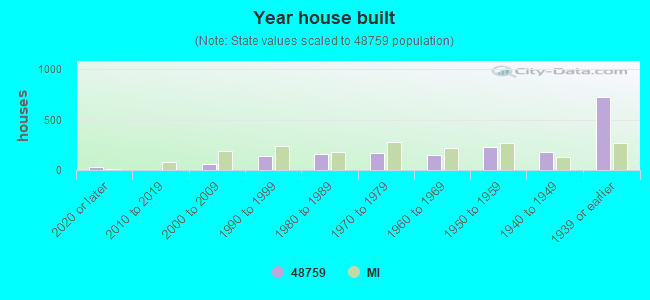


 According to the data from the years 2002 - 2018 the average number of fire incidents per year is 11. The highest number of fires - 18 took place in 2012, and the least - 5 in 2005. The data has a constant trend.
 When looking into fire subcategories, the most incidents belonged to: Structure Fires (52.7%), and Outside Fires (30.6%).