Estimated zip code population in 2022: 2,389 Zip code population in 2010: 2,407 Zip code population in 2000: 2,650
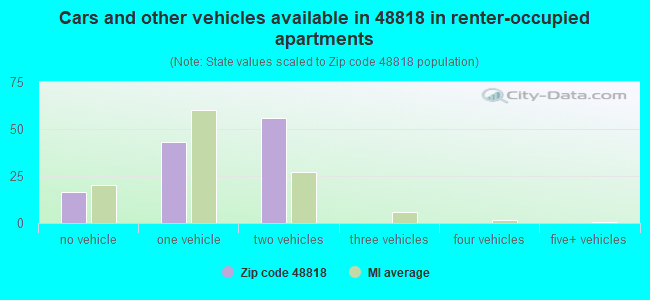
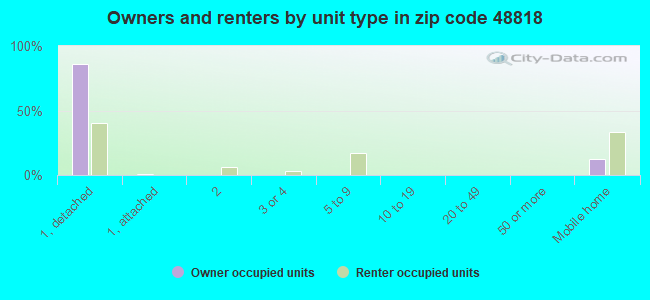
Houses and condos: 1,445 Renter-occupied apartments: 116
% of renters here:
12%
State:
27%
March 2022 cost of living index in zip code 48818: 81.0 (low, U.S. average is 100)
Land area: 25.3 sq. mi. Water area: 1.9 sq. mi.
Population density: 95 people per square mile
(very low).
OSM Map
General Map
Google Map
MSN Map
OSM Map
General Map
Google Map
MSN Map
OSM Map
General Map
Google Map
MSN Map
OSM Map
General Map
Google Map
MSN Map
Please wait while loading the map...
Real estate property taxes paid for housing units in 2022:
This zip code:
0.9% ($1,700)
Michigan:
1.2% ($2,746)
Median real estate property taxes paid for housing units with mortgages in 2022: $1,922 (1.1%) Median real estate property taxes paid for housing units with no mortgage in 2022: $1,600 (0.9%)
Business Search- 14 Million verified businesses
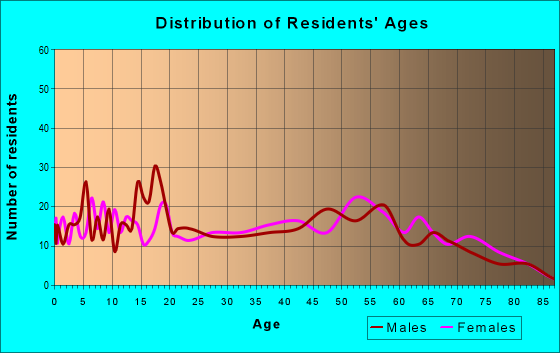
Males: 1,201
(50.3%)
Females: 1,187
(49.7%)
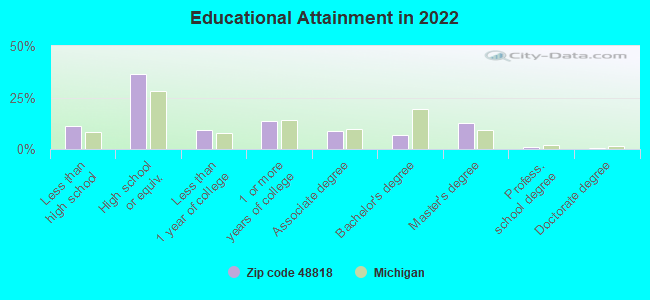
For population 25 years and over in 48818:
High school or higher: 87.5%
Bachelor's degree or higher: 20.4%
Graduate or professional degree: 13.7%
Unemployed: 1.4%
Mean travel time to work (commute): 40.1 minutes
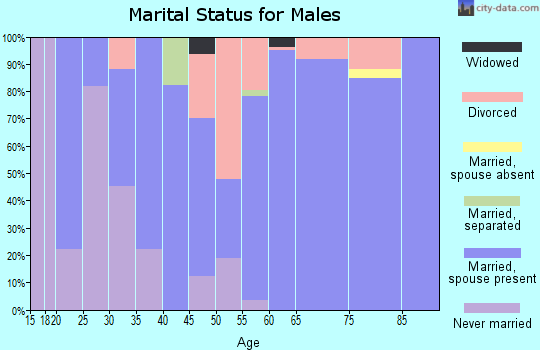
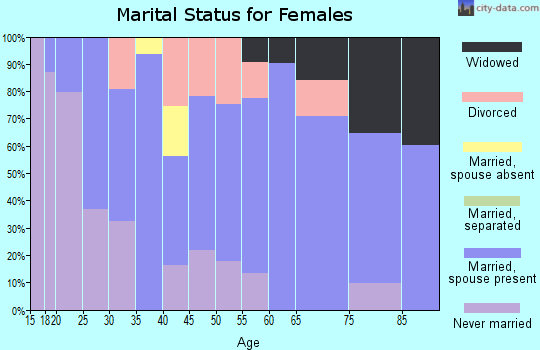
For population 15 years and over in 48818:
Never married: 17.4%
Now married: 62.3%
Separated: 5.6%
Widowed: 6.3%
Divorced: 8.4%
Zip code 48818 compared to state average:
Unemployed percentage significantly below state average.
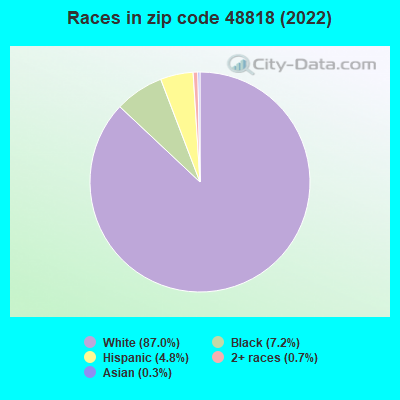
Black race population percentage below state average.
Foreign-born population percentage below state average.
Renting percentage below state average.
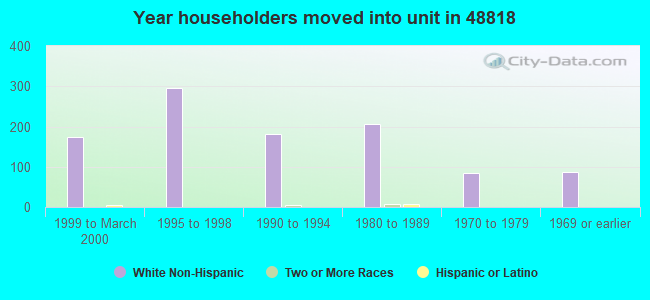
Length of stay since moving in below state average.
Number of college students significantly below state average.
Percentage of population with a bachelor's degree or higher below state average.
Averages for the 2020 tax year for zip code 48818, filed in 2021:
Average Adjusted Gross Income (AGI) in 2020: $54,316 (Individual Income Tax Returns)
Here:
$54,316
State:
$68,945
Salary/wage: $44,439 (reported on 71.4% of returns)
Here:
$44,439
State:
$57,142
(% of AGI for various income ranges: 930.9% for AGIs below $25k, 2991.7% for AGIs $25k-50k, 6139.2% for AGIs $50k-75k, 7805.0% for AGIs $75k-100k, 13403.3% for AGIs $100k-200k)
Taxable interest for individuals: $1,096 (reported on 24.8% of returns)
This zip code:
$1,096
Michigan:
$1,630
(% of AGI for various income ranges: 16.5% for AGIs below $25k, 34.3% for AGIs $25k-50k, 16.9% for AGIs $50k-75k, 108.3% for AGIs $75k-100k, 135.0% for AGIs $100k-200k)
Ordinary dividends: $3,792 (reported on 12.4% of returns)
Here:
$3,792
State:
$6,972
(% of AGI for various income ranges: 22.2% for AGIs below $25k, 8.7% for AGIs $25k-50k, 34.6% for AGIs $50k-75k, 143.3% for AGIs $75k-100k, 485.0% for AGIs $100k-200k)
Net capital gain/loss in AGI: +$27,592 (reported on 12.4% of returns)
Here:
+$27,592
State:
+$20,064
(% of AGI for various income ranges: 27.8% for AGIs $25k-50k, 75.4% for AGIs $50k-75k, 166.7% for AGIs $75k-100k, 5556.7% for AGIs $100k-200k)
Profit/loss from business: +$9,087 (reported on 14.3% of returns)
Here:
+$9,087
State:
+$11,172
(% of AGI for various income ranges: 109.1% for AGIs below $25k, 114.3% for AGIs $25k-50k, 409.2% for AGIs $50k-75k, 528.3% for AGIs $100k-200k)
Taxable individual retirement arrangement distribution: $16,825 (reported on 11.4% of returns)
48818:
$16,825
Michigan:
$19,803
(% of AGI for various income ranges: 150.4% for AGIs below $25k, 176.2% for AGIs $50k-75k, 463.3% for AGIs $75k-100k, 1943.3% for AGIs $100k-200k)
Total itemized deductions: $27,933 (reported on 2.9% of returns)
Here:
$27,933
State:
$34,117
(% of AGI for various income ranges: 1396.7% for AGIs $75k-100k)
Charity contributions: $10,350 (reported on 1.9% of returns)
Here:
$10,350
State:
$13,548
(% of AGI for various income ranges: 159.2% for AGIs $50k-75k)
Taxes paid: $7,967 (reported on 2.9% of returns)
48818:
$7,967
State:
$7,972
(% of AGI for various income ranges: 398.3% for AGIs $75k-100k)
Earned income credit: $1,883 (reported on 17.1% of returns)
Here:
$1,883
State:
$2,251
(% of AGI for various income ranges: 81.7% for AGIs below $25k, 65.7% for AGIs $25k-50k)
Percentage of individuals using paid preparers for their 2020 taxes: 96.2%
Here:
96%
State:
93%
(% for various income ranges: 94.4% for AGIs below $25k, 96.4% for AGIs $25k-50k, 94.7% for AGIs $50k-75k, 100.0% for AGIs $75k-100k, 100.0% for AGIs $100k-200k, 100.0% for AGIs over 200k)
Averages for the 2012 tax year for zip code 48818, filed in 2013:
Average Adjusted Gross Income (AGI) in 2012: $38,960 (Individual Income Tax Returns)
Here:
$38,960
State:
$55,609
Salary/wage: $32,120 (reported on 79.0% of returns)
Here:
$32,120
State:
$46,782
(% of AGI for various income ranges: 65.7% for AGIs below $25k, 74.3% for AGIs $25k-50k, 67.6% for AGIs $50k-75k, 59.4% for AGIs $75k-100k, 56.9% for AGIs $100k-200k)
Taxable interest for individuals: $1,308 (reported on 24.0% of returns)
This zip code:
$1,308
Michigan:
$1,491
(% of AGI for various income ranges: 0.9% for AGIs below $25k, 1.1% for AGIs $25k-50k, 0.9% for AGIs $50k-75k, 0.7% for AGIs $75k-100k, 0.4% for AGIs $100k-200k)
Ordinary dividends: $3,307 (reported on 14.0% of returns)
Here:
$3,307
State:
$6,225
(% of AGI for various income ranges: 0.7% for AGIs below $25k, 1.3% for AGIs $25k-50k, 2.1% for AGIs $50k-75k, 1.3% for AGIs $100k-200k)
Net capital gain/loss in AGI: +$14,133 (reported on 12.0% of returns)
Here:
+$14,133
State:
+$9,326
(% of AGI for various income ranges: 0.4% for AGIs $25k-50k, 1.7% for AGIs $50k-75k, 16.9% for AGIs $100k-200k)
Profit/loss from business: +$5,060 (reported on 15.0% of returns)
Here:
+$5,060
State:
+$11,523
(% of AGI for various income ranges: 5.4% for AGIs below $25k, 4.2% for AGIs $25k-50k, 1.1% for AGIs $75k-100k)
Taxable individual retirement arrangement distribution: $10,692 (reported on 12.0% of returns)
48818:
$10,692
Michigan:
$15,298
(% of AGI for various income ranges: 3.4% for AGIs below $25k, 3.2% for AGIs $25k-50k, 3.3% for AGIs $50k-75k, 8.1% for AGIs $75k-100k)
Total itemized deductions: $16,250 (22% of AGI, reported on 20.0% of returns)
Here:
$16,250
State:
$21,628
Here:
21.9% of AGI
State:
18.4% of AGI
(% of AGI for various income ranges: 6.6% for AGIs below $25k, 7.0% for AGIs $25k-50k, 7.4% for AGIs $50k-75k, 8.7% for AGIs $75k-100k, 11.5% for AGIs $100k-200k)
Charity contributions: $3,869 (reported on 13.0% of returns)
Here:
$3,869
State:
$4,225
(% of AGI for various income ranges: 1.3% for AGIs $25k-50k, 0.8% for AGIs $50k-75k, 1.5% for AGIs $75k-100k, 2.4% for AGIs $100k-200k)
Taxes paid: $5,345 (reported on 20.0% of returns)
48818:
$5,345
State:
$8,327
(% of AGI for various income ranges: 1.3% for AGIs below $25k, 1.8% for AGIs $25k-50k, 2.3% for AGIs $50k-75k, 2.7% for AGIs $75k-100k, 5.0% for AGIs $100k-200k)
Earned income credit: $2,419 (reported on 21.0% of returns)
Here:
$2,419
State:
$2,306
(% of AGI for various income ranges: 7.2% for AGIs below $25k, 1.1% for AGIs $25k-50k)
Percentage of individuals using paid preparers for their 2012 taxes: 60.0%
Here:
60%
State:
57%
(% for various income ranges: 51.1% for AGIs below $25k, 68.0% for AGIs $25k-50k, 66.7% for AGIs $50k-75k, 71.4% for AGIs $75k-100k, 66.7% for AGIs $100k-200k)
Averages for the 2004 tax year for zip code 48818, filed in 2005:
Average Adjusted Gross Income (AGI) in 2004: $34,729 (Individual Income Tax Returns)
Here:
$34,729
State:
$48,204
Salary/wage: $30,452 (reported on 83.6% of returns)
Here:
$30,452
State:
$42,791
(% of AGI for various income ranges: 120.2% for AGIs below $10k, 66.5% for AGIs $10k-25k, 78.9% for AGIs $25k-50k, 73.4% for AGIs $50k-75k, 76.6% for AGIs $75k-100k, 58.3% for AGIs over 100k)
Taxable interest for individuals: $1,547 (reported on 37.1% of returns)
This zip code:
$1,547
Michigan:
$1,725
(% of AGI for various income ranges: 8.5% for AGIs below $10k, 2.6% for AGIs $10k-25k, 1.5% for AGIs $25k-50k, 1.1% for AGIs $50k-75k, 1.2% for AGIs $75k-100k, 1.8% for AGIs over 100k)
Taxable dividends: $2,095 (reported on 15.9% of returns)
Here:
$2,095
State:
$3,420
(% of AGI for various income ranges: 4.2% for AGIs below $10k, 1.2% for AGIs $10k-25k, 1.0% for AGIs $25k-50k, 0.7% for AGIs $50k-75k, 0.8% for AGIs $75k-100k, 1.0% for AGIs over 100k)
Net capital gain/loss: +$1,458 (reported on 11.4% of returns)
Here:
+$1,458
State:
+$8,532
(% of AGI for various income ranges: 4.7% for AGIs below $10k, 0.5% for AGIs $10k-25k, 0.5% for AGIs $25k-50k, 0.2% for AGIs $50k-75k, 0.9% for AGIs $75k-100k)
Profit/loss from business: +$4,979 (reported on 13.3% of returns)
Here:
+$4,979
State:
+$9,547
(% of AGI for various income ranges: 6.7% for AGIs below $10k, 3.4% for AGIs $10k-25k, 2.0% for AGIs $25k-50k, 2.6% for AGIs $50k-75k, 0.5% for AGIs $75k-100k)
IRA payment deduction: $3,526 (reported on 1.8% of returns)
48818:
$3,526
Michigan:
$2,875
Total itemized deductions: $14,609 (24% of AGI, reported on 23.5% of returns)
Here:
$14,609
State:
$18,509
Here:
24.3% of AGI
State:
20.7% of AGI
(% of AGI for various income ranges: 8.9% for AGIs $10k-25k, 9.3% for AGIs $25k-50k, 10.7% for AGIs $50k-75k, 10.3% for AGIs $75k-100k, 11.4% for AGIs over 100k)
Charity contributions deductions: $2,298 (4% of AGI, reported on 17.8% of returns)
Here:
$2,298
State:
$3,365
Here:
3.5% of AGI
State:
3.6% of AGI
(% of AGI for various income ranges: 0.4% for AGIs $10k-25k, 0.8% for AGIs $25k-50k, 1.3% for AGIs $50k-75k, 1.7% for AGIs $75k-100k, 2.2% for AGIs over 100k)
Total tax: $4,134 (reported on 72.1% of returns)
48818:
$4,134
State:
$7,691
(% of AGI for various income ranges: 2.8% for AGIs below $10k, 3.5% for AGIs $10k-25k, 6.3% for AGIs $25k-50k, 8.6% for AGIs $50k-75k, 10.7% for AGIs $75k-100k, 16.5% for AGIs over 100k)
Earned income credit: $1,714 (reported on 17.3% of returns)
Here:
$1,714
State:
$1,737
Percentage of individuals using paid preparers for their 2004 taxes: 64.6%
Here:
65%
State:
60%
(% for various income ranges: 52.5% for AGIs below $10k, 68.1% for AGIs $10k-25k, 65.8% for AGIs $25k-50k, 68.9% for AGIs $50k-75k, 67.2% for AGIs $75k-100k, 73.7% for AGIs over 100k)
Likely homosexual households (counted as self-reported same-sex unmarried-partner households)
Lesbian couples: 0.0% of all households
Gay men: 0.6% of all households
Household received Food Stamps/SNAP in the past 12 months: 129 Household did not receive Food Stamps/SNAP in the past 12 months: 814
Women who had a birth in the past 12 months: 21 (22 now married, 0 unmarried) Women who did not have a birth in the past 12 months: 472 (301 now married, 168 unmarried)
Housing units in zip code 48818 with a mortgage: 362 (48 second mortgage, 47 both second mortgage and home equity loan) Houses without a mortgage: 8
Median monthly owner costs for units with a mortgage: $1,183 Median monthly owner costs for units without a mortgage: $432
Residents with income below the poverty level in 2022:
This zip code:
13.2%
Whole state:
13.4%
Residents with income below 50% of the poverty level in 2022:
This zip code:
12.1%
Whole state:
6.9%
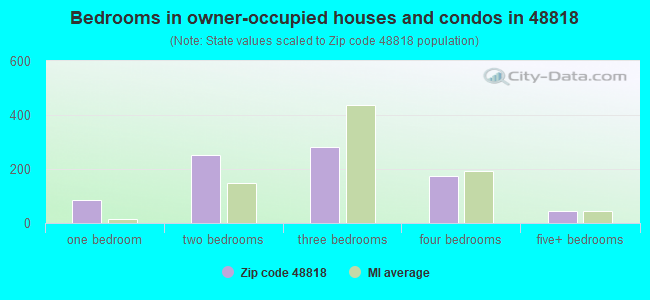
Median number of rooms in houses and condos:
Here:
5.9
State:
6.5
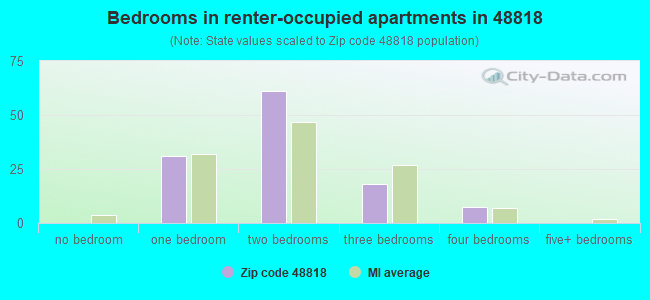
Median number of rooms in apartments:
Here:
4.7
State:
4.3
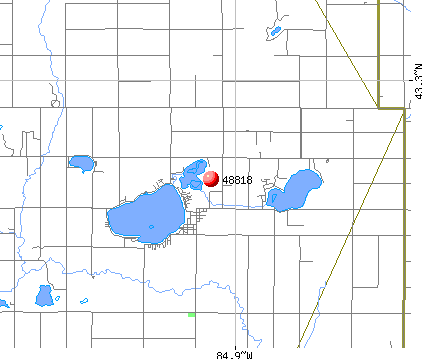
Notable locations in this zip code not listed on our city pages
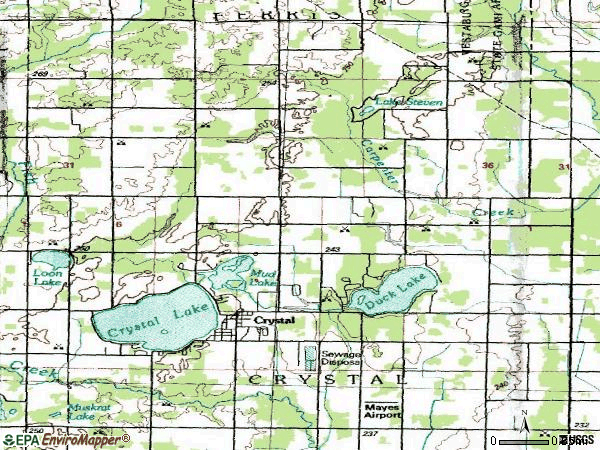
Notable locations in zip code 48818: Crystal Motor Speedway (A), South Shore Campground (B), Crystal Golf Course (C), Crystal Township Fire Department (D), Crystal Community Library (E). Display/hide their locations on the map
Churches in zip code 48818 include: Spencer Chapel (A), Community Assembly of God Church (B), Crystal Congregational Church (C), Crystal Lake Community Church (D), First Church of God (E), Freedom Way Church of God (F). Display/hide their locations on the map
Size of family households: 381 2-persons, 96 3-persons, 41 4-persons, 71 5-persons, 5 6-persons, 24 7-or-more-persons
Size of nonfamily households: 267 1-person, 60 2-persons
232 married couples with children.
124 single-parent households (43 men, 81 women).
99.3% of residents of 48818 zip code speak English at home.
0.2% of residents speak other Indo-European language at home (100% not well).
0.4% of residents speak Asian or Pacific Island language at home (100% very well).
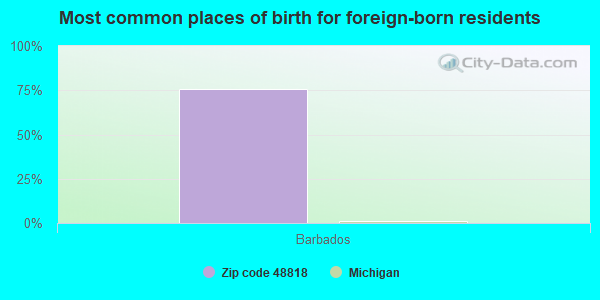
Foreign born population: 99 (4.1%) (0.0% of them are naturalized citizens)
:
4.1%
Whole state:
6.9%
75%Barbados
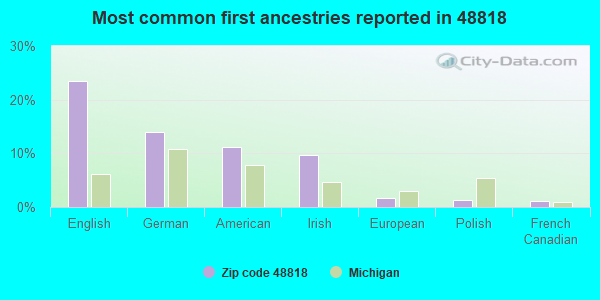
23%English
14%German
11%American
10%Irish
2%European
1%Polish
1%French Canadian
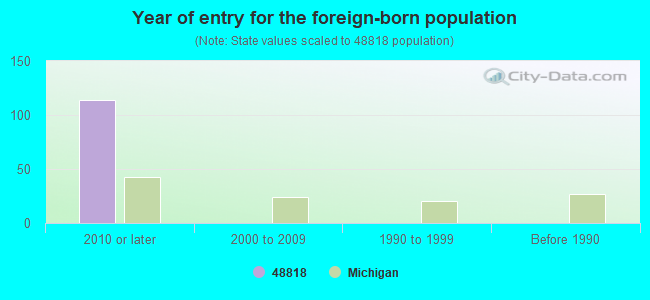
Year of entry for the foreign-born population
1142010 or later
02000 to 2009
01990 to 1999
0Before 1990
Facilities with environmental interests located in this zip code:
MI DEPT/ENVIRONMENTAL QUALITY (705 SOUTH MAIN STREET in CRYSTAL, MI)
Conditionally Exempt Small Quantity Generators, less than 100 kg/month of hazardous waste (Resource Conservation and Recovery Act (tracking hazardous waste)) Organizations: MDEQ/ESTHER BLACKRICK (CONTACT/OPERATOR)
Alternative names: MI DEPT/ENVIRONMENTAL QUALITY RRD
Housing units lacking complete kitchen facilities: 2.0%
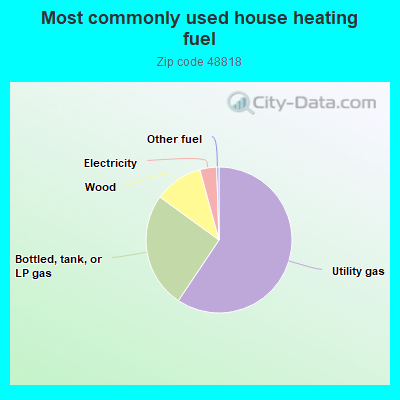
59.1%Utility gas
25.5%Bottled, tank, or LP gas
10.7%Wood
3.7%Electricity
0.5%Other fuel
Population in 1990: 2,279. Population change in the 1990s: +371 (+16.3%).
Place of birth for U.S.-born residents:
This state: 2,042
Northeast: 40
Midwest: 109
South: 59
West: 33
57% of the 48818 zip code residents lived in the same house 5 years ago. Out of people who lived in different houses, 45% lived in this county. Out of people who lived in different counties, 50% lived in Michigan.
92% of the 48818 zip code residents lived in the same house 1 year ago. Out of people who lived in different houses, 55% moved from this county. Out of people who lived in different houses, 32% moved from different county within same state. Out of people who lived in different houses, 10% moved from different state. Out of people who lived in different houses, 4% moved from abroad.
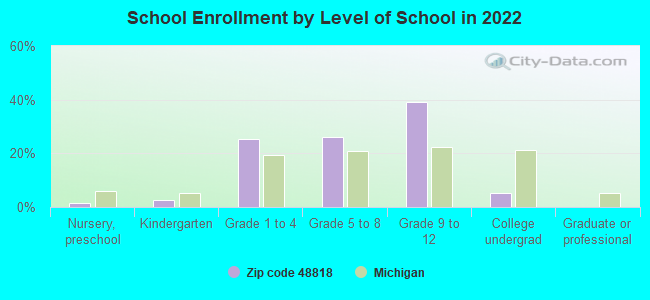
Private vs. public school enrollment:
Students in private schools in grades 1 to 8 (elementary and middle school): 62
Here:
32.2%
Michigan:
12.4%
Students in private schools in grades 9 to 12 (high school): 15
Here:
10.9%
Michigan:
9.8%
Students in private undergraduate colleges:
Here:
0.0%
Michigan:
14.9%
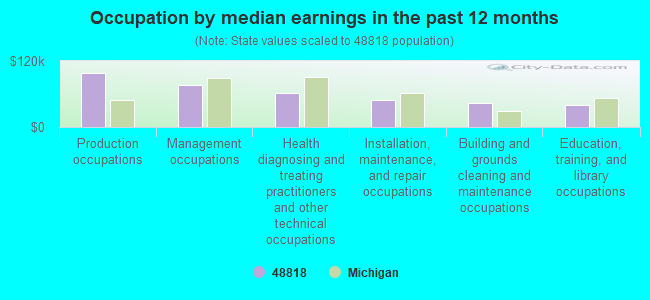
Occupation by median earnings in the past 12 months ($)
98,164Production occupations
76,461Management occupations
61,969Health diagnosing and treating practitioners and other technical occupations
49,382Installation, maintenance, and repair occupations
43,545Building and grounds cleaning and maintenance occupations
40,575Education, training, and library occupations
Top industries in this zip code by the number of employees in 2005:
Professional, Scientific, and Technical Services: Computer Systems Design Services (10-19: 1)
Wholesale Trade: Tire and Tube Merchant Wholesalers (10-19: 1)
Accommodation and Food Services: Full-Service Restaurants (5-9: 1, 1-4: 1)
Other Services (except Public Administration): Religious Organizations (1-4: 2)
People in group quarters in 2000:
6 people in other noninstitutional group quarters
5 people in homes for the mentally retarded
4 people in other group homes
Fatal accident statistics in 2011:
Fatal accident count: 1
Vehicles involved in fatal accidents: 1
Fatal accidents caused by drunken drivers: 1
Fatalities: 1
Persons involved in fatal accidents: 1
Pedestrians involved in fatal accidents: 0
Fatal accident statistics in 2010:
Fatal accident count: 1
Vehicles involved in fatal accidents: 1
Fatal accidents caused by drunken drivers: 0
Fatalities: 1
Persons involved in fatal accidents: 3
Pedestrians involved in fatal accidents: 1
2002 - 2018 National Fire Incident Reporting System (NFIRS) incidents
According to the data from the years 2002 - 2018 the average number of fire incidents per year is 31. The highest number of fires - 57 took place in 2003, and the least - 14 in 2011. The data has an increasing trend.
When looking into fire subcategories, the most incidents belonged to: Structure Fires (47.4%), and Outside Fires (41.7%).
Fire incident types reported to NFIRS in Zip Code 48818
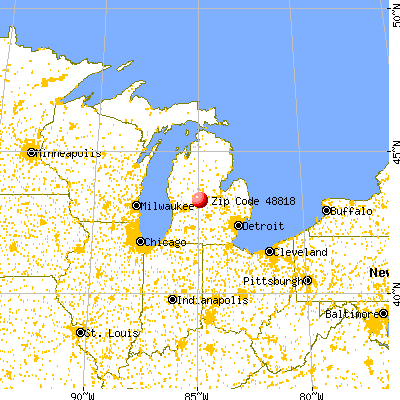


 Nearest zip codes: 48889, 48811, 48891, 48877, 48856, 48884.
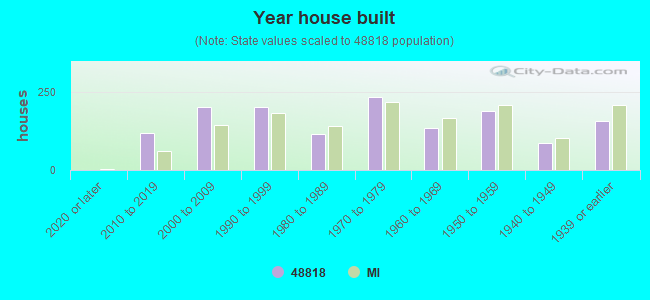


 According to the data from the years 2002 - 2018 the average number of fire incidents per year is 31. The highest number of fires - 57 took place in 2003, and the least - 14 in 2011. The data has an increasing trend.
 When looking into fire subcategories, the most incidents belonged to: Structure Fires (47.4%), and Outside Fires (41.7%).