Estimated zip code population in 2022: 7,407 Zip code population in 2010: 5,641 Zip code population in 2000: 5,049
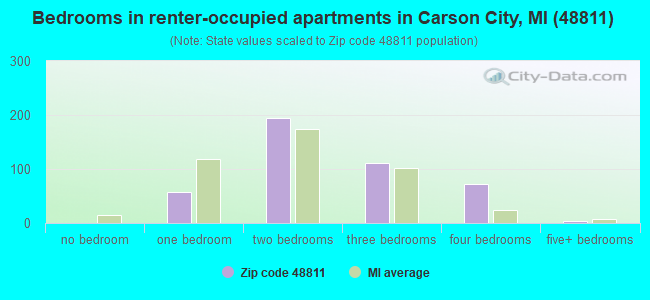
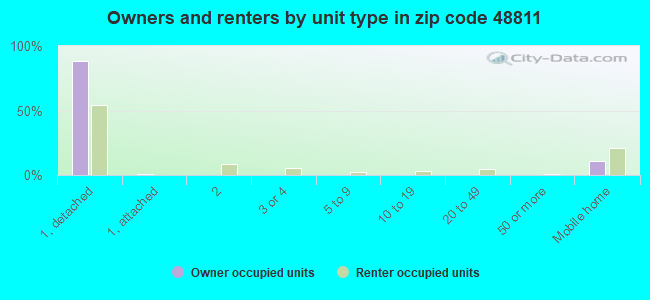
Houses and condos: 1,931 Renter-occupied apartments: 436
% of renters here:
24%
State:
27%
March 2022 cost of living index in zip code 48811: 80.5 (low, U.S. average is 100)
Land area: 62.8 sq. mi. Water area: 0.2 sq. mi.
Population density: 118 people per square mile
(very low).
OSM Map
General Map
Google Map
MSN Map
OSM Map
General Map
Google Map
MSN Map
OSM Map
General Map
Google Map
MSN Map
OSM Map
General Map
Google Map
MSN Map
Please wait while loading the map...
Real estate property taxes paid for housing units in 2022:
This zip code:
0.9% ($1,494)
Michigan:
1.2% ($2,746)
Median real estate property taxes paid for housing units with mortgages in 2022: $1,468 (0.9%) Median real estate property taxes paid for housing units with no mortgage in 2022: $1,546 (1.0%)
Business Search- 14 Million verified businesses
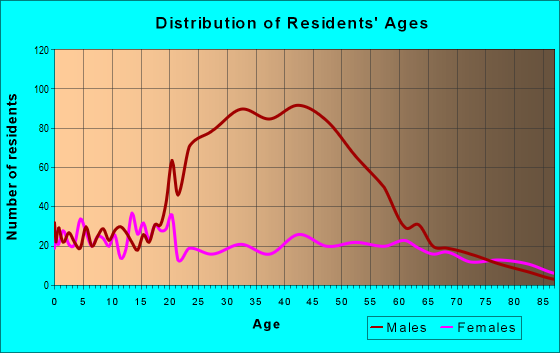
Males: 4,838
(65.3%)
Females: 2,567
(34.7%)
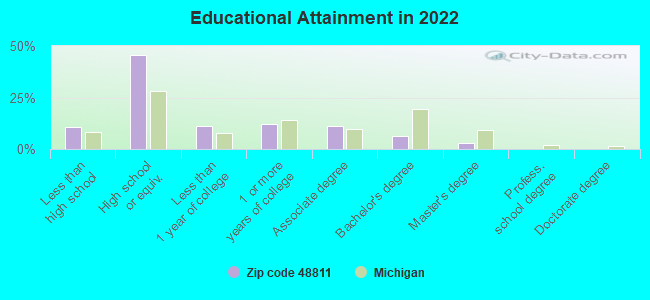
For population 25 years and over in 48811:
High school or higher: 88.7%
Bachelor's degree or higher: 9.5%
Graduate or professional degree: 3.2%
Unemployed: 3.2%
Mean travel time to work (commute): 23.1 minutes
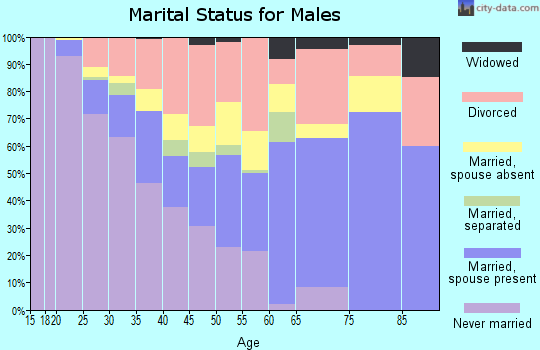
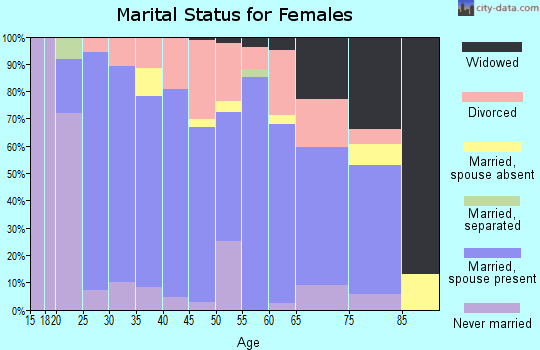
For population 15 years and over in 48811:
Never married: 40.6%
Now married: 36.7%
Separated: 1.7%
Widowed: 5.7%
Divorced: 15.3%
Zip code 48811 compared to state average:
Hispanic race population percentage below state average.
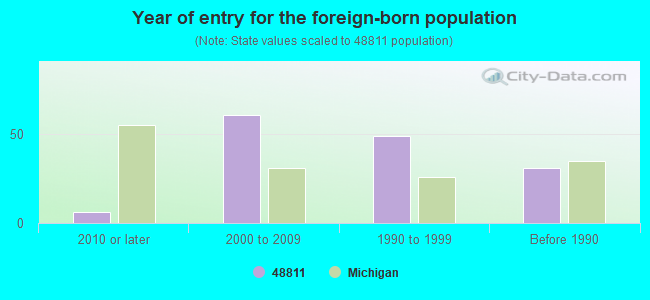
Foreign-born population percentage significantly below state average.
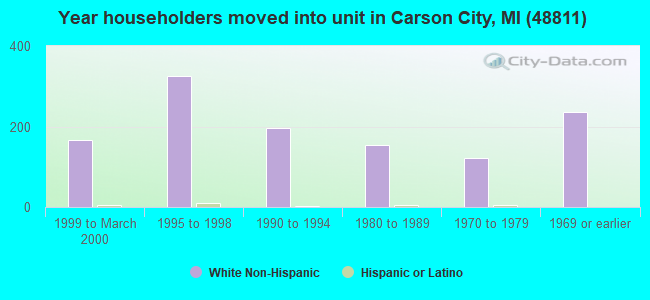
Length of stay since moving in above state average.
Percentage of population with a bachelor's degree or higher significantly below state average.
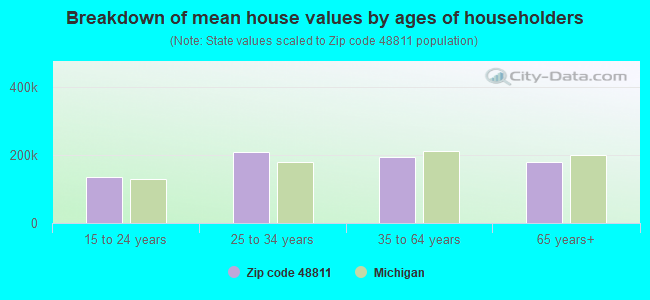
Estimated median house/condo value in 2022: $161,689
48811:
$161,689
Michigan:
$224,400
According to our research of Michigan and other state lists, there were 14 registered sex offenders living in 48811 zip code as of April 27, 2024. The ratio of all residents to sex offenders in zip code 48811 is 390 to 1. The ratio of registered sex offenders to all residents in this zip code is lower than the state average.
Median resident age:
This zip code:
40.4 years
Michigan median age:
40.3 years
Average household size:
This zip code:
2.8 people
Michigan:
2.4 people
Averages for the 2020 tax year for zip code 48811, filed in 2021:
Average Adjusted Gross Income (AGI) in 2020: $38,018 (Individual Income Tax Returns)
Here:
$38,018
State:
$68,945
Salary/wage: $39,119 (reported on 63.8% of returns)
Here:
$39,119
State:
$57,142
(% of AGI for various income ranges: 1056.4% for AGIs below $25k, 3363.9% for AGIs $25k-50k, 6251.2% for AGIs $50k-75k, 9616.7% for AGIs $75k-100k, 20401.4% for AGIs $100k-200k)
Taxable interest for individuals: $379 (reported on 35.7% of returns)
This zip code:
$379
Michigan:
$1,630
(% of AGI for various income ranges: 19.2% for AGIs below $25k, 25.0% for AGIs $25k-50k, 14.4% for AGIs $50k-75k, 24.4% for AGIs $75k-100k, 94.3% for AGIs $100k-200k)
Ordinary dividends: $1,387 (reported on 8.1% of returns)
Here:
$1,387
State:
$6,972
(% of AGI for various income ranges: 8.3% for AGIs below $25k, 15.0% for AGIs $25k-50k, 50.0% for AGIs $50k-75k, 80.0% for AGIs $100k-200k)
Net capital gain/loss in AGI: +$8,913 (reported on 8.1% of returns)
Here:
+$8,913
State:
+$20,064
(% of AGI for various income ranges: 1.4% for AGIs below $25k, 61.1% for AGIs $25k-50k, 107.5% for AGIs $50k-75k, 290.0% for AGIs $75k-100k, 1040.0% for AGIs $100k-200k)
Profit/loss from business: +$7,790 (reported on 10.8% of returns)
Here:
+$7,790
State:
+$11,172
(% of AGI for various income ranges: 94.7% for AGIs below $25k, 212.5% for AGIs $25k-50k, 170.6% for AGIs $50k-75k, 123.3% for AGIs $75k-100k, 340.0% for AGIs $100k-200k)
Taxable individual retirement arrangement distribution: $10,515 (reported on 7.0% of returns)
48811:
$10,515
Michigan:
$19,803
(% of AGI for various income ranges: 46.4% for AGIs below $25k, 102.5% for AGIs $25k-50k, 236.9% for AGIs $50k-75k, 593.3% for AGIs $75k-100k)
Total itemized deductions: $32,433 (reported on 1.6% of returns)
Here:
$32,433
State:
$34,117
(% of AGI for various income ranges: 1081.1% for AGIs $75k-100k)
Charity contributions: $18,650 (reported on 1.1% of returns)
Here:
$18,650
State:
$13,548
(% of AGI for various income ranges: 133.2% for AGIs $25k-50k)
Taxes paid: $5,233 (reported on 1.6% of returns)
48811:
$5,233
State:
$7,972
(% of AGI for various income ranges: 174.4% for AGIs $75k-100k)
Earned income credit: $2,074 (reported on 12.4% of returns)
Here:
$2,074
State:
$2,251
(% of AGI for various income ranges: 70.3% for AGIs below $25k, 80.0% for AGIs $25k-50k)
Percentage of individuals using paid preparers for their 2020 taxes: 74.6%
Here:
75%
State:
93%
(% for various income ranges: 54.3% for AGIs below $25k, 94.9% for AGIs $25k-50k, 95.5% for AGIs $50k-75k, 100.0% for AGIs $75k-100k, 93.8% for AGIs $100k-200k)
Averages for the 2012 tax year for zip code 48811, filed in 2013:
Average Adjusted Gross Income (AGI) in 2012: $42,572 (Individual Income Tax Returns)
Here:
$42,572
State:
$55,609
Salary/wage: $35,717 (reported on 79.7% of returns)
Here:
$35,717
State:
$46,782
(% of AGI for various income ranges: 66.8% for AGIs below $25k, 70.2% for AGIs $25k-50k, 77.7% for AGIs $50k-75k, 71.5% for AGIs $75k-100k, 54.0% for AGIs $100k-200k)
Taxable interest for individuals: $874 (reported on 29.3% of returns)
This zip code:
$874
Michigan:
$1,491
(% of AGI for various income ranges: 1.4% for AGIs below $25k, 0.7% for AGIs $25k-50k, 0.5% for AGIs $50k-75k, 0.5% for AGIs $75k-100k, 0.4% for AGIs $100k-200k)
Ordinary dividends: $1,643 (reported on 10.5% of returns)
Here:
$1,643
State:
$6,225
(% of AGI for various income ranges: 0.6% for AGIs below $25k, 1.0% for AGIs $25k-50k, 0.2% for AGIs $50k-75k, 0.2% for AGIs $75k-100k, 0.2% for AGIs $100k-200k)
Net capital gain/loss in AGI: +$5,708 (reported on 9.0% of returns)
Here:
+$5,708
State:
+$9,326
(% of AGI for various income ranges: 0.2% for AGIs below $25k, 0.2% for AGIs $25k-50k, 3.9% for AGIs $100k-200k)
Profit/loss from business: +$6,820 (reported on 15.0% of returns)
Here:
+$6,820
State:
+$11,523
(% of AGI for various income ranges: 5.6% for AGIs below $25k, 5.0% for AGIs $25k-50k, 1.2% for AGIs $50k-75k, 1.6% for AGIs $75k-100k, 0.7% for AGIs $100k-200k)
Taxable individual retirement arrangement distribution: $8,309 (reported on 8.3% of returns)
48811:
$8,309
Michigan:
$15,298
(% of AGI for various income ranges: 2.9% for AGIs below $25k, 3.3% for AGIs $25k-50k, 3.7% for AGIs $75k-100k)
Total itemized deductions: $16,317 (19% of AGI, reported on 17.3% of returns)
Here:
$16,317
State:
$21,628
Here:
19.0% of AGI
State:
18.4% of AGI
(% of AGI for various income ranges: 7.6% for AGIs $25k-50k, 4.8% for AGIs $50k-75k, 9.3% for AGIs $75k-100k, 8.4% for AGIs $100k-200k)
Charity contributions: $4,900 (reported on 12.8% of returns)
Here:
$4,900
State:
$4,225
(% of AGI for various income ranges: 1.6% for AGIs $25k-50k, 0.8% for AGIs $50k-75k, 2.0% for AGIs $75k-100k, 2.1% for AGIs $100k-200k)
Taxes paid: $4,826 (reported on 17.3% of returns)
48811:
$4,826
State:
$8,327
(% of AGI for various income ranges: 1.4% for AGIs $25k-50k, 1.6% for AGIs $50k-75k, 2.6% for AGIs $75k-100k, 3.1% for AGIs $100k-200k)
Earned income credit: $2,268 (reported on 18.8% of returns)
Here:
$2,268
State:
$2,306
(% of AGI for various income ranges: 6.4% for AGIs below $25k, 1.3% for AGIs $25k-50k)
Percentage of individuals using paid preparers for their 2012 taxes: 66.9%
Here:
67%
State:
57%
(% for various income ranges: 62.1% for AGIs below $25k, 69.7% for AGIs $25k-50k, 66.7% for AGIs $50k-75k, 70.0% for AGIs $75k-100k, 81.8% for AGIs $100k-200k)
Averages for the 2004 tax year for zip code 48811, filed in 2005:
Average Adjusted Gross Income (AGI) in 2004: $35,142 (Individual Income Tax Returns)
Here:
$35,142
State:
$48,204
Salary/wage: $33,868 (reported on 85.3% of returns)
Here:
$33,868
State:
$42,791
(% of AGI for various income ranges: 112.3% for AGIs below $10k, 68.0% for AGIs $10k-25k, 81.1% for AGIs $25k-50k, 83.9% for AGIs $50k-75k, 89.5% for AGIs $75k-100k, 79.4% for AGIs over 100k)
Taxable interest for individuals: $967 (reported on 39.2% of returns)
This zip code:
$967
Michigan:
$1,725
(% of AGI for various income ranges: 3.8% for AGIs below $10k, 3.0% for AGIs $10k-25k, 0.9% for AGIs $25k-50k, 1.3% for AGIs $50k-75k, 0.2% for AGIs $75k-100k, 0.3% for AGIs over 100k)
Taxable dividends: $989 (reported on 13.0% of returns)
Here:
$989
State:
$3,420
(% of AGI for various income ranges: 1.5% for AGIs below $10k, 1.0% for AGIs $10k-25k, 0.2% for AGIs $25k-50k, 0.5% for AGIs $50k-75k, 0.1% for AGIs $75k-100k, 0.2% for AGIs over 100k)
Net capital gain/loss: +$2,929 (reported on 10.0% of returns)
Here:
+$2,929
State:
+$8,532
(% of AGI for various income ranges: -0.4% for AGIs below $10k, 1.3% for AGIs $10k-25k, 0.5% for AGIs $25k-50k, 1.6% for AGIs $50k-75k, 0.1% for AGIs $75k-100k, 1.1% for AGIs over 100k)
Profit/loss from business: +$4,642 (reported on 14.5% of returns)
Here:
+$4,642
State:
+$9,547
(% of AGI for various income ranges: 9.8% for AGIs below $10k, 1.6% for AGIs $10k-25k, 3.1% for AGIs $25k-50k, 1.9% for AGIs $50k-75k, 0.7% for AGIs $75k-100k)
IRA payment deduction: $2,562 (reported on 1.1% of returns)
48811:
$2,562
Michigan:
$2,875
Total itemized deductions: $13,628 (21% of AGI, reported on 22.0% of returns)
Here:
$13,628
State:
$18,509
Here:
20.9% of AGI
State:
20.7% of AGI
(% of AGI for various income ranges: 5.4% for AGIs $10k-25k, 7.1% for AGIs $25k-50k, 9.8% for AGIs $50k-75k, 10.6% for AGIs $75k-100k, 11.1% for AGIs over 100k)
Charity contributions deductions: $3,333 (5% of AGI, reported on 17.1% of returns)
Here:
$3,333
State:
$3,365
Here:
4.9% of AGI
State:
3.6% of AGI
(% of AGI for various income ranges: 1.0% for AGIs $10k-25k, 1.3% for AGIs $25k-50k, 1.6% for AGIs $50k-75k, 2.1% for AGIs $75k-100k, 2.7% for AGIs over 100k)
Total tax: $4,131 (reported on 72.2% of returns)
48811:
$4,131
State:
$7,691
(% of AGI for various income ranges: 2.7% for AGIs below $10k, 4.2% for AGIs $10k-25k, 6.7% for AGIs $25k-50k, 8.0% for AGIs $50k-75k, 9.6% for AGIs $75k-100k, 17.1% for AGIs over 100k)
Earned income credit: $1,736 (reported on 15.1% of returns)
Here:
$1,736
State:
$1,737
Percentage of individuals using paid preparers for their 2004 taxes: 68.2%
Here:
68%
State:
60%
(% for various income ranges: 61.1% for AGIs below $10k, 67.8% for AGIs $10k-25k, 68.1% for AGIs $25k-50k, 76.2% for AGIs $50k-75k, 72.5% for AGIs $75k-100k, 73.8% for AGIs over 100k)
Household received Food Stamps/SNAP in the past 12 months: 202 Household did not receive Food Stamps/SNAP in the past 12 months: 1,640
Women who had a birth in the past 12 months: 73 (46 now married, 27 unmarried) Women who did not have a birth in the past 12 months: 989 (426 now married, 561 unmarried)
Housing units in zip code 48811 with a mortgage: 749 (7 second mortgage, 8 both second mortgage and home equity loan) Houses without a mortgage: 1
Median monthly owner costs for units with a mortgage: $1,129 Median monthly owner costs for units without a mortgage: $470
Residents with income below the poverty level in 2022:
This zip code:
12.2%
Whole state:
13.4%
Residents with income below 50% of the poverty level in 2022:
This zip code:
10.2%
Whole state:
6.9%
Median number of rooms in houses and condos:
Here:
7.0
State:
6.5
Median number of rooms in apartments:
Here:
5.1
State:
4.3
Notable locations in this zip code not listed on our city pages
Notable locations in zip code 48811: United Brethren Church Camp (A), Red Pines Campground (B), Carson City Fire Department (C), Carson City City Hall (D), Carson City Public Library (E). Display/hide their locations on the map
Churches in zip code 48811 include: Church of Brethren (A), Mount Hope Church (B), Church at Carson City (C), First Baptist Church (D), Montcalm Mennonite Church (E), Saint Mary's Church (F), Christian Full Gospel Church (G), United Methodist Church (H), First Congregational Church (I). Display/hide their locations on the map
Cemeteries: Burke Cemetery (1), Crystal Cemetery (2), Dalton Cemetery (3), Carson City Cemetery (4), Saint Marys Cemetery (5), Bloomer Cemetery (6). Display/hide their locations on the map
In group quarters: 2,173 (-1 institutionalized population)
Size of family households: 560 2-persons, 302 3-persons, 194 4-persons, 115 5-persons, 60 6-persons, 59 7-or-more-persons
Size of nonfamily households: 470 1-person, 77 2-persons
1,004 married couples with children.
247 single-parent households (125 men, 122 women).
95.2% of residents of 48811 zip code speak English at home.
1.3% of residents speak Spanish at home (54% very well, 34% well, 11% not well).
2.1% of residents speak other Indo-European language at home (59% very well, 23% well, 18% not well).
0.1% of residents speak Asian or Pacific Island language at home (100% well).
0.7% of residents speak other language at home (16% very well, 71% well, 14% not well).
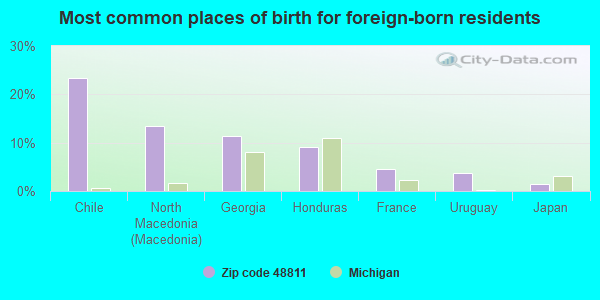
Foreign born population: 134 (1.8%) (73.2% of them are naturalized citizens)
This zip code:
1.8%
Whole state:
6.9%
23%Chile
14%North Macedonia (Macedonia)
11%Georgia
9%Honduras
5%France
4%Uruguay
2%Japan
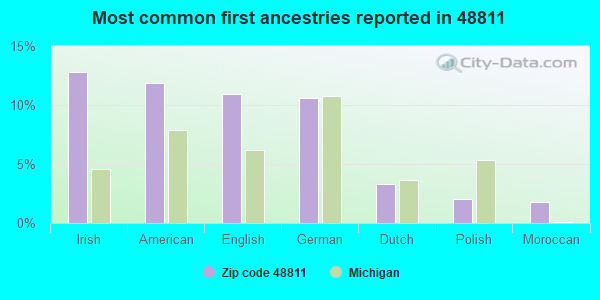
13%Irish
12%American
11%English
11%German
3%Dutch
2%Polish
2%Moroccan
Year of entry for the foreign-born population
62010 or later
612000 to 2009
491990 to 1999
31Before 1990
Facilities with environmental interests located in this zip code:
FARMERS OIL & GAS CO (684 W MAIN ST in CARSON CITY, MI)
(Resource Conservation and Recovery Act (tracking hazardous waste))
FRONTIER EXPRESS CAR WASH LLC (400 W MAIN ST in CARSON CITY, MI)
(Resource Conservation and Recovery Act (tracking hazardous waste)) Business NAICS classification: CAR WASHES. Organizations: BILL HUBLER (CONTACT/OPERATOR)
MI DEPT/ENVIRONMENTAL QUALITY (10010 CARSON CITY RD in CARSON CITY, MI)
(Resource Conservation and Recovery Act (tracking hazardous waste)) Business NAICS classification: NEW MULTIFAMILY HOUSING CONSTRUCTION (EXCEPT OPERATIVE BUILDERS). Alternative names: MILLS BROTHERS CONSTRUCTION
MI DEPT/CORRECTIONS (10274 BOYER RD in CARSON CITY, MI)
Conditionally Exempt Small Quantity Generators, less than 100 kg/month of hazardous waste (Resource Conservation and Recovery Act (tracking hazardous waste)) Alternative names: CARSON CITY CORRECTIONS
MI DEPT/ENVIRONMENTAL QUALITY (122 E MAIN ST (M-57) in CARSON CITY, MI)
Conditionally Exempt Small Quantity Generators, less than 100 kg/month of hazardous waste (Resource Conservation and Recovery Act (tracking hazardous waste)) Organizations: MI DEPT/ENVIRONMENTAL QUALITY STD (CONTACT/OPERATOR)
Alternative names: MI DEPT/ENVIRONMENTAL QUALITY STD
Housing units lacking complete plumbing facilities: 0.5% Housing units lacking complete kitchen facilities: 0.5%
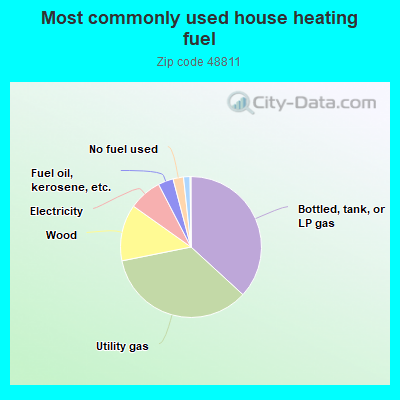
36.9%Bottled, tank, or LP gas
35.1%Utility gas
13.0%Wood
7.6%Electricity
3.5%Fuel oil, kerosene, etc.
2.4%No fuel used
1.5%Other fuel
Population in 1990: 4,190. Population change in the 1990s: +859 (+20.5%).
Place of birth for U.S.-born residents:
This state: 6,467
Northeast: 51
Midwest: 314
South: 290
West: 111
57% of the 48811 zip code residents lived in the same house 5 years ago. Out of people who lived in different houses, 33% lived in this county. Out of people who lived in different counties, 50% lived in Michigan.
87% of the 48811 zip code residents lived in the same house 1 year ago. Out of people who lived in different houses, 17% moved from this county. Out of people who lived in different houses, 73% moved from different county within same state. Out of people who lived in different houses, 8% moved from different state. Out of people who lived in different houses, 1% moved from abroad.
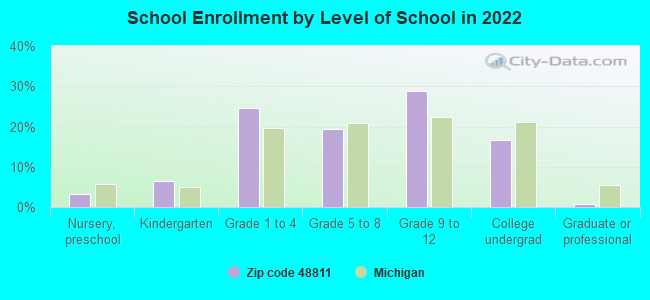
Private vs. public school enrollment:
Students in private schools in grades 1 to 8 (elementary and middle school): 327
Here:
52.1%
Michigan:
12.4%
Students in private schools in grades 9 to 12 (high school): 44
Here:
11.0%
Michigan:
9.8%
Students in private undergraduate colleges: 40
Here:
17.3%
Michigan:
14.9%
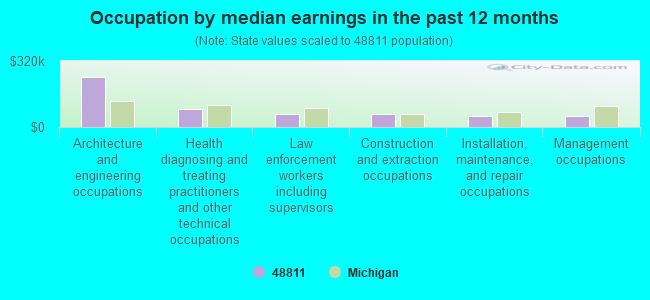
Occupation by median earnings in the past 12 months ($)
240,071Architecture and engineering occupations
85,776Health diagnosing and treating practitioners and other technical occupations
63,624Law enforcement workers including supervisors
63,454Construction and extraction occupations
53,923Installation, maintenance, and repair occupations
53,901Management occupations
Top industries in this zip code by the number of employees in 2005:
Health Care and Social Assistance: General Medical and Surgical Hospitals (250-499 employees: 1 establishment)
Other Services (except Public Administration): Religious Organizations (10-19: 2, 5-9: 3, 1-4: 1)
69 people in nursing facilities/skilled-nursing facilities
People in group quarters in 2000:
1,597 people in state prisons
10 people in other group homes
4 people in other noninstitutional group quarters
Fatal accident statistics in 2010:
Fatal accident count: 1
Vehicles involved in fatal accidents: 2
Fatal accidents caused by drunken drivers: 0
Fatalities: 1
Persons involved in fatal accidents: 4
Pedestrians involved in fatal accidents: 0
2002 - 2018 National Fire Incident Reporting System (NFIRS) incidents
Based on the data from the years 2002 - 2018 the average number of fire incidents per year is 17. The highest number of fires - 28 took place in 2008, and the least - 7 in 2011. The data has an increasing trend.
When looking into fire subcategories, the most reports belonged to: Structure Fires (50.9%), and Outside Fires (32.2%).
Fire incident types reported to NFIRS in Zip Code 48811


 Nearest zip codes: 48845, 48818, 48889, 48856, 48860, 48870.


 Based on the data from the years 2002 - 2018 the average number of fire incidents per year is 17. The highest number of fires - 28 took place in 2008, and the least - 7 in 2011. The data has an increasing trend.
 When looking into fire subcategories, the most reports belonged to: Structure Fires (50.9%), and Outside Fires (32.2%).