Estimated zip code population in 2022: 1,597 Zip code population in 2010: 1,334 Zip code population in 2000: 1,398
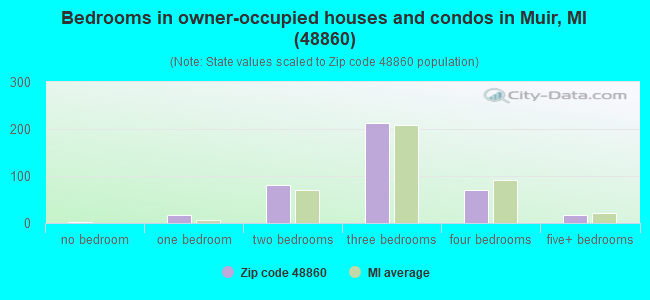
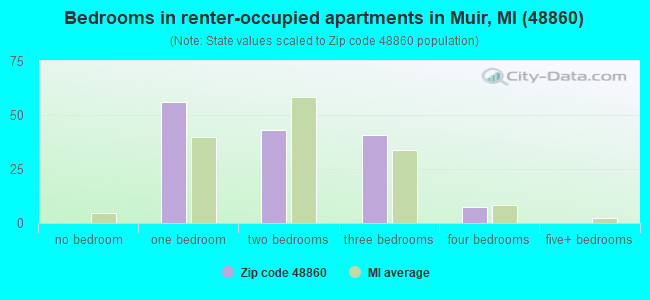
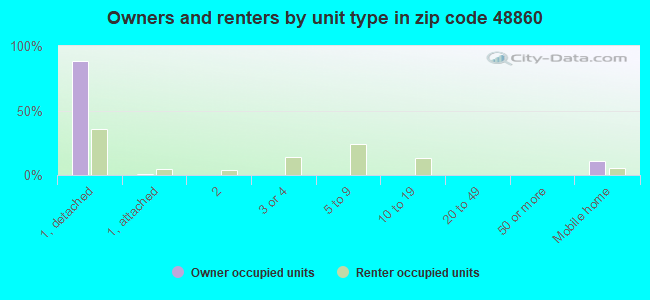
Houses and condos: 560 Renter-occupied apartments: 146
% of renters here:
27%
State:
27%
March 2022 cost of living index in zip code 48860: 80.4 (low, U.S. average is 100)
Land area: 29.6 sq. mi. Water area: 0.1 sq. mi.
Population density: 54 people per square mile
(very low).
OSM Map
General Map
Google Map
MSN Map
OSM Map
General Map
Google Map
MSN Map
OSM Map
General Map
Google Map
MSN Map
OSM Map
General Map
Google Map
MSN Map
Please wait while loading the map...
Real estate property taxes paid for housing units in 2022:
This zip code:
1.1% ($2,056)
Michigan:
1.2% ($2,746)
Median real estate property taxes paid for housing units with mortgages in 2022: $2,248 (1.1%) Median real estate property taxes paid for housing units with no mortgage in 2022: $1,597 (1.0%)
Business Search- 14 Million verified businesses
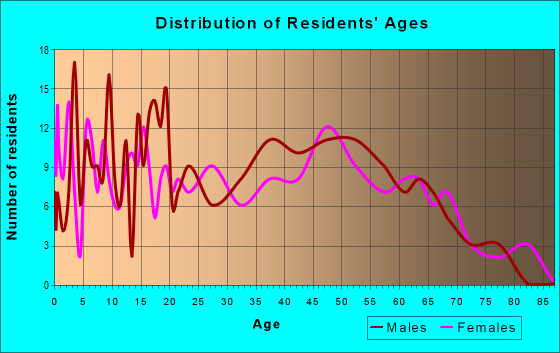
Males: 968
(60.6%)
Females: 628
(39.4%)
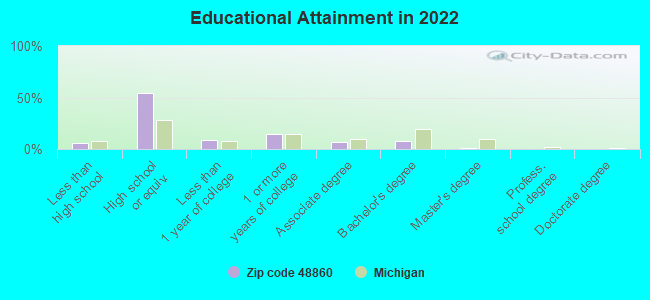
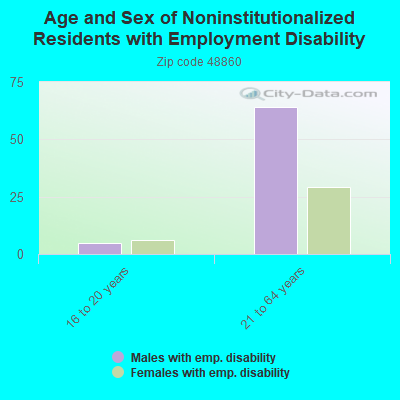
For population 25 years and over in 48860:
High school or higher: 92.5%
Bachelor's degree or higher: 9.7%
Graduate or professional degree: 1.9%
Unemployed: 4.4%
Mean travel time to work (commute): 29.5 minutes
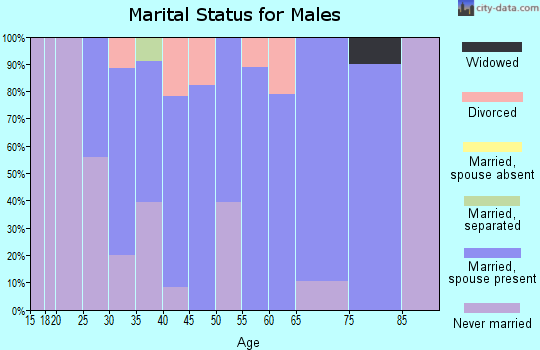
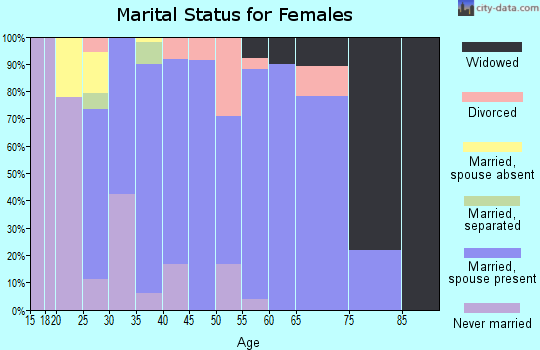
For population 15 years and over in 48860:
Never married: 31.5%
Now married: 48.6%
Separated: 7.2%
Widowed: 1.4%
Divorced: 11.3%
Zip code 48860 compared to state average:
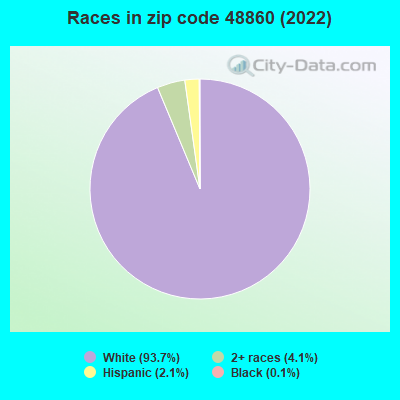
Black race population percentage significantly below state average.
Hispanic race population percentage below state average.
Foreign-born population percentage significantly below state average.
Length of stay since moving in significantly above state average.
Number of college students significantly below state average.
Percentage of population with a bachelor's degree or higher significantly below state average.
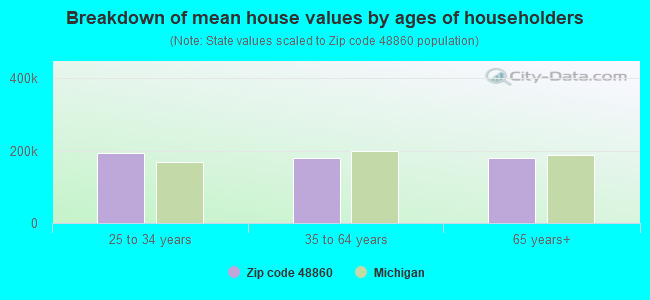
Estimated median house/condo value in 2022: $189,808
48860:
$189,808
Michigan:
$224,400
According to our research of Michigan and other state lists, there were 4 registered sex offenders living in 48860 zip code as of April 27, 2024. The ratio of all residents to sex offenders in zip code 48860 is 382 to 1. The ratio of registered sex offenders to all residents in this zip code is lower than the state average.
Median resident age:
This zip code:
41.1 years
Michigan median age:
40.3 years
Average household size:
This zip code:
2.9 people
Michigan:
2.4 people
Averages for the 2020 tax year for zip code 48860, filed in 2021:
Average Adjusted Gross Income (AGI) in 2020: $48,629 (Individual Income Tax Returns)
Here:
$48,629
State:
$68,945
Salary/wage: $42,980 (reported on 79.4% of returns)
Here:
$42,980
State:
$57,142
(% of AGI for various income ranges: 1025.7% for AGIs below $25k, 3197.3% for AGIs $25k-50k, 7542.9% for AGIs $50k-75k, 9340.0% for AGIs $75k-100k, 15605.0% for AGIs $100k-200k)
Taxable interest for individuals: $793 (reported on 23.8% of returns)
This zip code:
$793
Michigan:
$1,630
(% of AGI for various income ranges: 33.6% for AGIs below $25k, 33.3% for AGIs $25k-50k, 12.9% for AGIs $50k-75k, 32.5% for AGIs $100k-200k)
Ordinary dividends: $1,280 (reported on 7.9% of returns)
Here:
$1,280
State:
$6,972
(% of AGI for various income ranges: 18.6% for AGIs below $25k, 95.0% for AGIs $75k-100k)
Net capital gain/loss in AGI: +$4,940 (reported on 7.9% of returns)
Here:
+$4,940
State:
+$20,064
(% of AGI for various income ranges: 38.7% for AGIs $25k-50k, 472.5% for AGIs $75k-100k)
Profit/loss from business: +$4,483 (reported on 9.5% of returns)
Here:
+$4,483
State:
+$11,172
(% of AGI for various income ranges: 45.0% for AGIs below $25k, 137.3% for AGIs $25k-50k)
Taxable individual retirement arrangement distribution: $9,840 (reported on 7.9% of returns)
48860:
$9,840
Michigan:
$19,803
(% of AGI for various income ranges: 328.0% for AGIs $25k-50k)
Earned income credit: $2,140 (reported on 15.9% of returns)
Here:
$2,140
State:
$2,251
(% of AGI for various income ranges: 97.1% for AGIs below $25k, 52.0% for AGIs $25k-50k)
Percentage of individuals using paid preparers for their 2020 taxes: 93.7%
Here:
94%
State:
93%
(% for various income ranges: 95.0% for AGIs below $25k, 94.7% for AGIs $25k-50k, 100.0% for AGIs $50k-75k, 83.3% for AGIs $75k-100k, 85.7% for AGIs $100k-200k)
Averages for the 2012 tax year for zip code 48860, filed in 2013:
Average Adjusted Gross Income (AGI) in 2012: $37,459 (Individual Income Tax Returns)
Here:
$37,459
State:
$55,609
Salary/wage: $31,676 (reported on 83.6% of returns)
Here:
$31,676
State:
$46,782
(% of AGI for various income ranges: 64.7% for AGIs below $25k, 70.7% for AGIs $25k-50k, 79.2% for AGIs $50k-75k, 84.0% for AGIs $75k-100k, 55.2% for AGIs $100k-200k)
Taxable interest for individuals: $824 (reported on 27.9% of returns)
This zip code:
$824
Michigan:
$1,491
(% of AGI for various income ranges: 1.5% for AGIs below $25k, 0.6% for AGIs $25k-50k, 0.6% for AGIs $50k-75k, 0.6% for AGIs $75k-100k)
Ordinary dividends: $800 (reported on 11.5% of returns)
Here:
$800
State:
$6,225
Net capital gain/loss in AGI: +$1,900 (reported on 6.6% of returns)
Here:
+$1,900
State:
+$9,326
Profit/loss from business: +$4,680 (reported on 8.2% of returns)
Here:
+$4,680
State:
+$11,523
(% of AGI for various income ranges: 4.7% for AGIs below $25k, 1.2% for AGIs $25k-50k)
Taxable individual retirement arrangement distribution: $9,960 (reported on 8.2% of returns)
48860:
$9,960
Michigan:
$15,298
Total itemized deductions: $16,030 (21% of AGI, reported on 16.4% of returns)
Here:
$16,030
State:
$21,628
Here:
21.4% of AGI
State:
18.4% of AGI
(% of AGI for various income ranges: 7.8% for AGIs $25k-50k, 14.5% for AGIs $50k-75k, 9.5% for AGIs $100k-200k)
Charity contributions: $2,186 (reported on 11.5% of returns)
Here:
$2,186
State:
$4,225
Taxes paid: $4,590 (reported on 16.4% of returns)
48860:
$4,590
State:
$8,327
(% of AGI for various income ranges: 1.8% for AGIs $25k-50k, 4.0% for AGIs $50k-75k, 3.3% for AGIs $100k-200k)
Earned income credit: $2,093 (reported on 23.0% of returns)
Here:
$2,093
State:
$2,306
(% of AGI for various income ranges: 6.4% for AGIs below $25k, 1.0% for AGIs $25k-50k)
Percentage of individuals using paid preparers for their 2012 taxes: 57.4%
Here:
57%
State:
57%
(% for various income ranges: 50.0% for AGIs below $25k, 57.1% for AGIs $25k-50k, 66.7% for AGIs $50k-75k, 60.0% for AGIs $75k-100k, 100.0% for AGIs $100k-200k)
Averages for the 2004 tax year for zip code 48860, filed in 2005:
Average Adjusted Gross Income (AGI) in 2004: $33,415 (Individual Income Tax Returns)
Here:
$33,415
State:
$48,204
Salary/wage: $30,690 (reported on 87.8% of returns)
Here:
$30,690
State:
$42,791
(% of AGI for various income ranges: 107.3% for AGIs below $10k, 73.4% for AGIs $10k-25k, 77.5% for AGIs $25k-50k, 86.7% for AGIs $50k-75k, 85.3% for AGIs $75k-100k, 69.1% for AGIs over 100k)
Taxable interest for individuals: $1,050 (reported on 37.7% of returns)
This zip code:
$1,050
Michigan:
$1,725
(% of AGI for various income ranges: 4.1% for AGIs below $10k, 3.8% for AGIs $10k-25k, 1.6% for AGIs $25k-50k, 0.3% for AGIs $50k-75k, 0.2% for AGIs $75k-100k, 0.3% for AGIs over 100k)
Taxable dividends: $734 (reported on 10.0% of returns)
Here:
$734
State:
$3,420
Net capital gain/loss: +$2,942 (reported on 8.1% of returns)
Here:
+$2,942
State:
+$8,532
Profit/loss from business: +$268 (reported on 8.8% of returns)
Here:
+$268
State:
+$9,547
(% of AGI for various income ranges: 6.6% for AGIs below $10k, -0.7% for AGIs $10k-25k, -0.4% for AGIs $25k-50k, 0.4% for AGIs $50k-75k)
Total itemized deductions: $13,000 (22% of AGI, reported on 24.1% of returns)
Here:
$13,000
State:
$18,509
Here:
22.1% of AGI
State:
20.7% of AGI
(% of AGI for various income ranges: 7.2% for AGIs $10k-25k, 10.0% for AGIs $25k-50k, 8.7% for AGIs $50k-75k, 11.5% for AGIs $75k-100k, 11.0% for AGIs over 100k)
Charity contributions deductions: $1,857 (3% of AGI, reported on 18.6% of returns)
Here:
$1,857
State:
$3,365
Here:
2.9% of AGI
State:
3.6% of AGI
(% of AGI for various income ranges: 1.0% for AGIs $10k-25k, 0.6% for AGIs $25k-50k, 1.1% for AGIs $50k-75k, 1.6% for AGIs $75k-100k, 1.7% for AGIs over 100k)
Total tax: $3,656 (reported on 70.1% of returns)
48860:
$3,656
State:
$7,691
(% of AGI for various income ranges: 1.8% for AGIs below $10k, 3.7% for AGIs $10k-25k, 6.2% for AGIs $25k-50k, 7.8% for AGIs $50k-75k, 9.6% for AGIs $75k-100k, 14.6% for AGIs over 100k)
Earned income credit: $1,683 (reported on 15.8% of returns)
Here:
$1,683
State:
$1,737
Percentage of individuals using paid preparers for their 2004 taxes: 61.2%
Here:
61%
State:
60%
(% for various income ranges: 53.7% for AGIs below $10k, 54.4% for AGIs $10k-25k, 62.9% for AGIs $25k-50k, 76.3% for AGIs $50k-75k, 65.0% for AGIs $75k-100k, 72.2% for AGIs over 100k)
Household received Food Stamps/SNAP in the past 12 months: 119 Household did not receive Food Stamps/SNAP in the past 12 months: 427
Women who had a birth in the past 12 months: 2 (2 now married, 0 unmarried) Women who did not have a birth in the past 12 months: 304 (102 now married, 202 unmarried)
Housing units in zip code 48860 with a mortgage: 255 (12 second mortgage, 10 home equity loan, 2 both second mortgage and home equity loan) Median monthly owner costs for units with a mortgage: $1,451 Median monthly owner costs for units without a mortgage: $566
Residents with income below the poverty level in 2022:
This zip code:
9.4%
Whole state:
13.4%
Residents with income below 50% of the poverty level in 2022:
This zip code:
2.8%
Whole state:
6.9%
Median number of rooms in houses and condos:
Here:
7.0
State:
6.5
Median number of rooms in apartments:
Here:
4.4
State:
4.3
Notable locations in this zip code not listed on our city pages
Size of family households: 133 2-persons, 102 3-persons, 46 4-persons, 29 5-persons, 3 6-persons, 45 7-or-more-persons
Size of nonfamily households: 141 1-person, 39 2-persons, 2 3-persons
304 married couples with children.
76 single-parent households (14 men, 62 women).
97.7% of residents of 48860 zip code speak English at home.
0.3% of residents speak Spanish at home (60% very well, 40% well).
1.2% of residents speak other Indo-European language at home (100% very well).
0.2% of residents speak Asian or Pacific Island language at home (100% very well).
Foreign born population: 0 (0.0%)
:
0.0%
Whole state:
6.9%
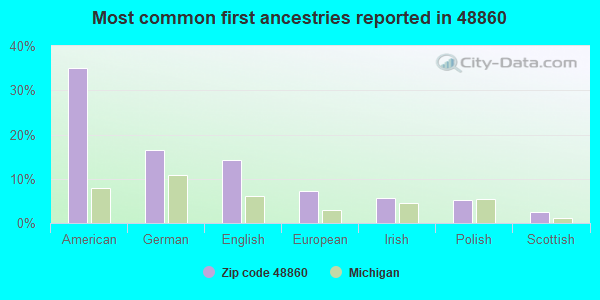
35%American
17%German
14%English
7%European
6%Irish
5%Polish
3%Scottish
Facilities with environmental interests located in this zip code:
MI DEPT/TRANSPORTATION BRIDGE B03-34062 (M-21 OVER MAPLE RIVER in MUIR, MI)
Conditionally Exempt Small Quantity Generators, less than 100 kg/month of hazardous waste (Resource Conservation and Recovery Act (tracking hazardous waste)) Organizations: MICH DEPT OF TRANSPORTATION (CONTACT/OPERATOR)
Alternative names: MIDOT BRIDGE B03-34062
MI DEPT/TRANSPORTATION BRIDGE B04-34062 (M-21 OVER STONEY CREEK in MUIR, MI)
Conditionally Exempt Small Quantity Generators, less than 100 kg/month of hazardous waste (Resource Conservation and Recovery Act (tracking hazardous waste)) Organizations: MICH DEPT OF TRANSPORTATION (CONTACT/OPERATOR)
Alternative names: MI DEPT/TRANS BRIDGE B04-34062
Housing units lacking complete plumbing facilities: 1.2% Housing units lacking complete kitchen facilities: 1.2%
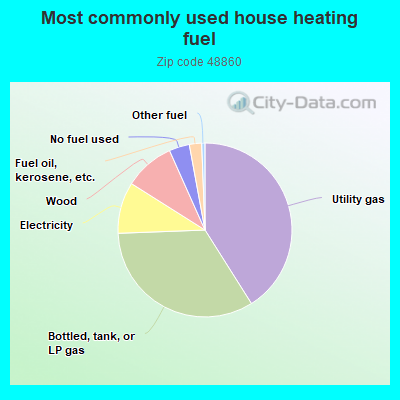
41.2%Utility gas
33.5%Bottled, tank, or LP gas
9.6%Electricity
9.4%Wood
3.8%No fuel used
2.3%Fuel oil, kerosene, etc.
0.6%Other fuel
Population in 1990: 1,885.
Place of birth for U.S.-born residents:
This state: 1,386
Northeast: 11
Midwest: 67
South: 117
West: 9
63% of the 48860 zip code residents lived in the same house 5 years ago. Out of people who lived in different houses, 66% lived in this county. Out of people who lived in different counties, 50% lived in Michigan.
94% of the 48860 zip code residents lived in the same house 1 year ago. Out of people who lived in different houses, 71% moved from this county. Out of people who lived in different houses, 27% moved from different county within same state.
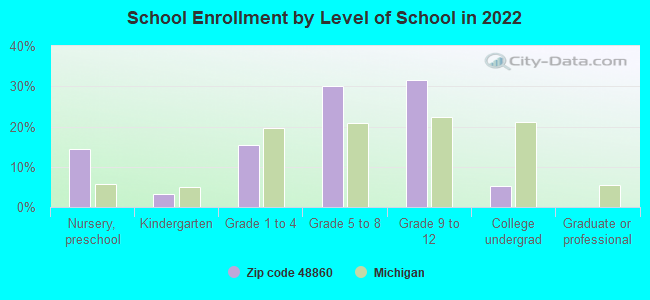
Private vs. public school enrollment:
Students in private schools in grades 1 to 8 (elementary and middle school): 8
Here:
4.8%
Michigan:
12.4%
Students in private schools in grades 9 to 12 (high school): 3
Here:
3.3%
Michigan:
9.8%
Students in private undergraduate colleges:
Here:
0.0%
Michigan:
14.9%
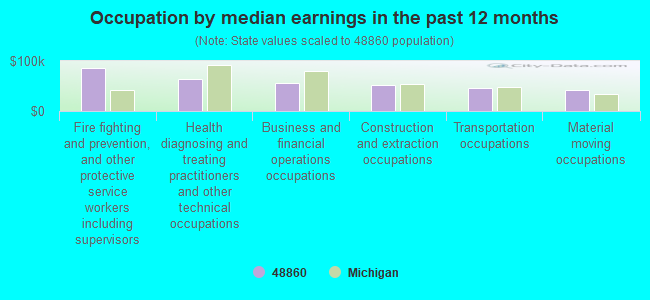
Occupation by median earnings in the past 12 months ($)
86,358Fire fighting and prevention, and other protective service workers including supervisors
64,063Health diagnosing and treating practitioners and other technical occupations
56,728Business and financial operations occupations
52,491Construction and extraction occupations
45,551Transportation occupations
41,577Material moving occupations
Top industries in this zip code by the number of employees in 2005:
Accommodation and Food Services: Full-Service Restaurants (5-9 employees: 1 establishment)
Finance and Insurance: Insurance Agencies and Brokerages (5-9: 1)
Accommodation and Food Services: Snack and Nonalcoholic Beverage Bars (1-4: 1)
Construction: Poured Concrete Foundation and Structure Contractors (1-4: 1)
People in group quarters in 2000:
6 people in other group homes
Fatal accident statistics in 2013:
Fatal accident count: 2
Vehicles involved in fatal accidents: 2
Fatal accidents caused by drunken drivers: 1
Fatalities: 2
Persons involved in fatal accidents: 4
Pedestrians involved in fatal accidents: 1
Fatal accident statistics in 2012:
Fatal accident count: 1
Vehicles involved in fatal accidents: 2
Fatal accidents caused by drunken drivers: 0
Fatalities: 1
Persons involved in fatal accidents: 2
Pedestrians involved in fatal accidents: 0
Home Mortgage Disclosure Act Aggregated Statistics For Year 2009 (Based on 2 partial tracts)
A) FHA, FSA/RHS & VA Home Purchase Loans
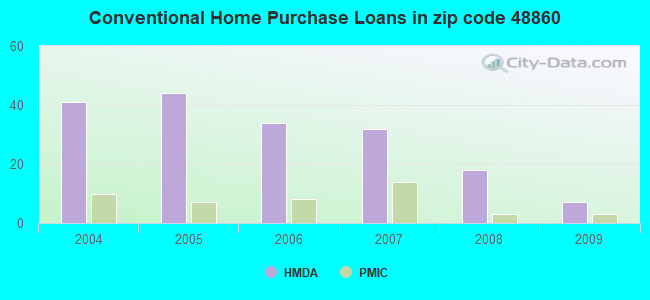
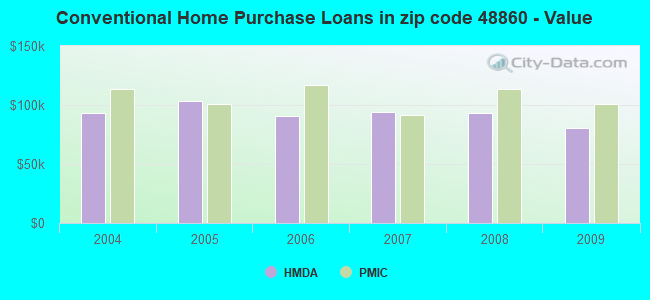
B) Conventional Home Purchase Loans
C) Refinancings
D) Home Improvement Loans
F) Non-occupant Loans on < 5 Family Dwellings (A B C & D)
G) Loans On Manufactured Home Dwelling (A B C & D)
Number
Average Value
Number
Average Value
Number
Average Value
Number
Average Value
Number
Average Value
Number
Average Value
LOANS ORIGINATED
8
$86,762
7
$80,413
77
$106,164
7
$19,311
3
$54,907
10
$74,635
APPLICATIONS APPROVED, NOT ACCEPTED
1
$78,380
2
$18,745
7
$96,641
0
$0
1
$18,180
1
$19,310
APPLICATIONS DENIED
3
$64,563
3
$59,640
24
$122,475
3
$20,827
2
$46,860
4
$76,112
APPLICATIONS WITHDRAWN
2
$64,470
3
$70,433
19
$106,276
1
$3,410
2
$83,780
1
$58,500
FILES CLOSED FOR INCOMPLETENESS
0
$0
1
$17,040
3
$64,563
0
$0
0
$0
0
$0
Aggregated Statistics For Year 2008 (Based on 2 partial tracts)
A) FHA, FSA/RHS & VA Home Purchase Loans
B) Conventional Home Purchase Loans
C) Refinancings
D) Home Improvement Loans
F) Non-occupant Loans on < 5 Family Dwellings (A B C & D)
G) Loans On Manufactured Home Dwelling (A B C & D)
Number
Average Value
Number
Average Value
Number
Average Value
Number
Average Value
Number
Average Value
Number
Average Value
LOANS ORIGINATED
10
$80,656
18
$93,183
56
$94,450
11
$23,546
6
$46,103
15
$71,681
APPLICATIONS APPROVED, NOT ACCEPTED
3
$81,793
2
$55,950
13
$109,362
1
$10,220
2
$42,600
4
$75,685
APPLICATIONS DENIED
3
$45,250
7
$52,500
35
$102,922
7
$45,764
4
$40,755
12
$84,206
APPLICATIONS WITHDRAWN
1
$31,810
3
$76,113
19
$117,367
0
$0
1
$86,900
2
$103,660
FILES CLOSED FOR INCOMPLETENESS
1
$53,390
0
$0
3
$136,320
0
$0
0
$0
1
$12,500
Aggregated Statistics For Year 2007 (Based on 2 partial tracts)
A) FHA, FSA/RHS & VA Home Purchase Loans
B) Conventional Home Purchase Loans
C) Refinancings
D) Home Improvement Loans
F) Non-occupant Loans on < 5 Family Dwellings (A B C & D)
G) Loans On Manufactured Home Dwelling (A B C & D)
Number
Average Value
Number
Average Value
Number
Average Value
Number
Average Value
Number
Average Value
Number
Average Value
LOANS ORIGINATED
5
$109,852
32
$93,915
73
$91,059
20
$44,503
7
$64,427
18
$58,851
APPLICATIONS APPROVED, NOT ACCEPTED
0
$0
5
$173,580
11
$106,629
1
$26,700
1
$73,270
2
$45,155
APPLICATIONS DENIED
2
$98,265
16
$68,906
56
$114,685
6
$46,765
4
$79,520
14
$72,339
APPLICATIONS WITHDRAWN
1
$22,150
5
$87,586
15
$161,539
2
$133,480
0
$0
2
$117,010
FILES CLOSED FOR INCOMPLETENESS
1
$34,650
4
$381,695
4
$108,488
0
$0
0
$0
0
$0
Aggregated Statistics For Year 2006 (Based on 2 partial tracts)
A) FHA, FSA/RHS & VA Home Purchase Loans
B) Conventional Home Purchase Loans
C) Refinancings
D) Home Improvement Loans
F) Non-occupant Loans on < 5 Family Dwellings (A B C & D)
G) Loans On Manufactured Home Dwelling (A B C & D)
Number
Average Value
Number
Average Value
Number
Average Value
Number
Average Value
Number
Average Value
Number
Average Value
LOANS ORIGINATED
7
$106,703
34
$90,846
89
$94,046
24
$38,766
7
$60,289
26
$53,042
APPLICATIONS APPROVED, NOT ACCEPTED
1
$138,020
7
$84,470
17
$101,572
1
$53,390
0
$0
3
$52,067
APPLICATIONS DENIED
1
$116,440
23
$68,333
87
$108,103
10
$64,468
5
$56,460
15
$48,091
APPLICATIONS WITHDRAWN
1
$65,890
9
$87,724
35
$112,399
3
$41,087
2
$71,850
3
$112,843
FILES CLOSED FOR INCOMPLETENESS
1
$101,670
3
$92,207
11
$127,800
0
$0
0
$0
0
$0
Aggregated Statistics For Year 2005 (Based on 2 partial tracts)
A) FHA, FSA/RHS & VA Home Purchase Loans
B) Conventional Home Purchase Loans
C) Refinancings
D) Home Improvement Loans
F) Non-occupant Loans on < 5 Family Dwellings (A B C & D)
G) Loans On Manufactured Home Dwelling (A B C & D)
Number
Average Value
Number
Average Value
Number
Average Value
Number
Average Value
Number
Average Value
Number
Average Value
LOANS ORIGINATED
3
$133,670
44
$103,505
123
$92,427
22
$35,242
6
$54,055
31
$61,087
APPLICATIONS APPROVED, NOT ACCEPTED
1
$82,930
7
$70,189
15
$92,735
1
$11,360
0
$0
3
$47,713
APPLICATIONS DENIED
1
$90,310
14
$83,780
90
$108,595
10
$41,180
2
$116,155
16
$80,336
APPLICATIONS WITHDRAWN
1
$92,580
9
$92,394
46
$107,957
8
$84,206
2
$85,485
3
$80,277
FILES CLOSED FOR INCOMPLETENESS
0
$0
2
$94,005
15
$135,676
1
$103,940
0
$0
1
$60,780
Aggregated Statistics For Year 2004 (Based on 2 partial tracts)
A) FHA, FSA/RHS & VA Home Purchase Loans
B) Conventional Home Purchase Loans
C) Refinancings
D) Home Improvement Loans
F) Non-occupant Loans on < 5 Family Dwellings (A B C & D)
G) Loans On Manufactured Home Dwelling (A B C & D)
Detailed PMIC statistics for the following Tracts:0301.00
2002 - 2018 National Fire Incident Reporting System (NFIRS) incidents
Based on the data from the years 2002 - 2018 the average number of fire incidents per year is 6. The highest number of fire incidents - 16 took place in 2003, and the least - 1 in 2008. The data has a rising trend.
When looking into fire subcategories, the most incidents belonged to: Structure Fires (46.3%), and Outside Fires (38.0%).
Fire incident types reported to NFIRS in Zip Code 48860
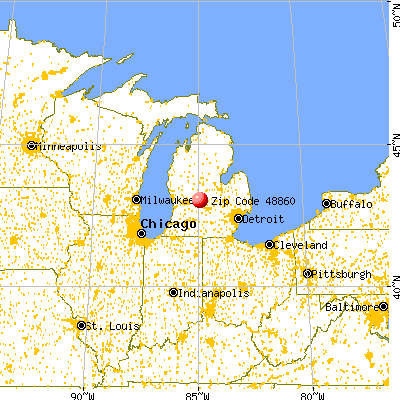


 Nearest zip codes: 48845, 48873, 48870, 48851, 48811, 48834.


 Based on the data from the years 2002 - 2018 the average number of fire incidents per year is 6. The highest number of fire incidents - 16 took place in 2003, and the least - 1 in 2008. The data has a rising trend.
 When looking into fire subcategories, the most incidents belonged to: Structure Fires (46.3%), and Outside Fires (38.0%).