Estimated zip code population in 2022: 1,913 Zip code population in 2010: 1,903 Zip code population in 2000: 1,852
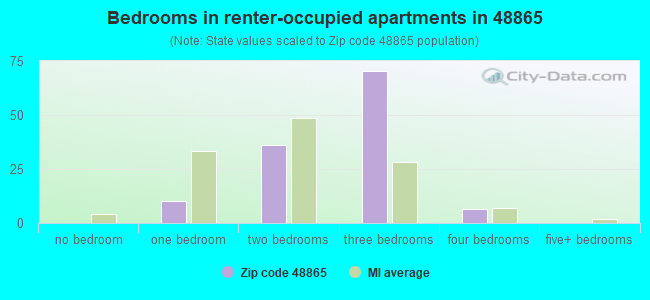
Houses and condos: 705 Renter-occupied apartments: 125
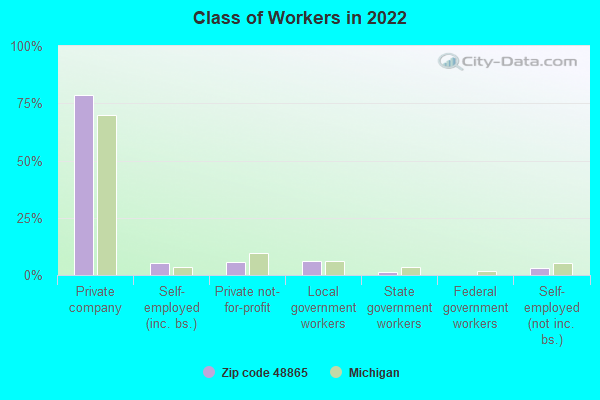
% of renters here:
20%
State:
27%
March 2022 cost of living index in zip code 48865: 79.9 (low, U.S. average is 100)
Land area: 22.4 sq. mi. Water area: 0.5 sq. mi.
Population density: 86 people per square mile
(very low).
OSM Map
General Map
Google Map
MSN Map
OSM Map
General Map
Google Map
MSN Map
OSM Map
General Map
Google Map
MSN Map
OSM Map
General Map
Google Map
MSN Map
Please wait while loading the map...
Real estate property taxes paid for housing units in 2022:
This zip code:
1.2% ($1,393)
Michigan:
1.2% ($2,746)
Median real estate property taxes paid for housing units with mortgages in 2022: $2,102 (1.3%) Median real estate property taxes paid for housing units with no mortgage in 2022: $1,255 (1.3%)
Business Search- 14 Million verified businesses
Males: 983
(51.4%)
Females: 930
(48.6%)
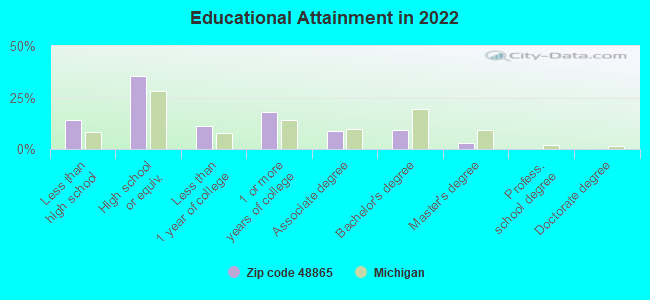
For population 25 years and over in 48865:
High school or higher: 84.8%
Bachelor's degree or higher: 12.0%
Graduate or professional degree: 3.0%
Unemployed: 1.1%
Mean travel time to work (commute): 24.4 minutes
For population 15 years and over in 48865:
Never married: 24.2%
Now married: 54.8%
Separated: 0.7%
Widowed: 4.4%
Divorced: 16.0%
Zip code 48865 compared to state average:
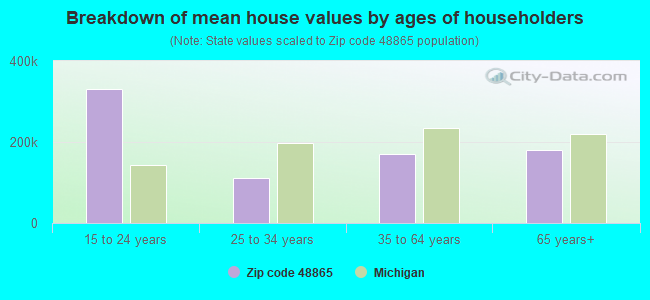
Median house value below state average.
Unemployed percentage significantly below state average.
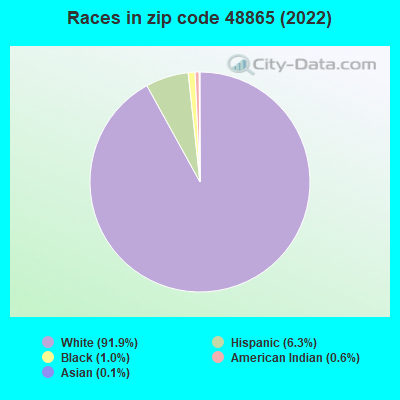
Black race population percentage significantly below state average.
Foreign-born population percentage significantly below state average.
Length of stay since moving in significantly above state average.
Number of college students significantly below state average.
Percentage of population with a bachelor's degree or higher significantly below state average.
Averages for the 2020 tax year for zip code 48865, filed in 2021:
Average Adjusted Gross Income (AGI) in 2020: $48,096 (Individual Income Tax Returns)
Here:
$48,096
State:
$68,945
Salary/wage: $42,314 (reported on 78.6% of returns)
Here:
$42,314
State:
$57,142
(% of AGI for various income ranges: 959.0% for AGIs below $25k, 3218.6% for AGIs $25k-50k, 5530.8% for AGIs $50k-75k, 8522.0% for AGIs $75k-100k, 20640.0% for AGIs $100k-200k)
Taxable interest for individuals: $353 (reported on 20.2% of returns)
This zip code:
$353
Michigan:
$1,630
(% of AGI for various income ranges: 4.3% for AGIs below $25k, 4.8% for AGIs $25k-50k, 13.3% for AGIs $50k-75k, 26.0% for AGIs $75k-100k, 30.0% for AGIs $100k-200k)
Ordinary dividends: $1,912 (reported on 9.5% of returns)
Here:
$1,912
State:
$6,972
(% of AGI for various income ranges: 29.0% for AGIs $25k-50k, 184.0% for AGIs $75k-100k)
Net capital gain/loss in AGI: +$2,025 (reported on 9.5% of returns)
Here:
+$2,025
State:
+$20,064
(% of AGI for various income ranges: 33.8% for AGIs $25k-50k, 182.0% for AGIs $75k-100k)
Profit/loss from business: +$8,400 (reported on 9.5% of returns)
Here:
+$8,400
State:
+$11,172
(% of AGI for various income ranges: 163.8% for AGIs below $25k, 273.3% for AGIs $50k-75k)
Taxable individual retirement arrangement distribution: $17,733 (reported on 7.1% of returns)
48865:
$17,733
Michigan:
$19,803
(% of AGI for various income ranges: 52.4% for AGIs below $25k, 153.3% for AGIs $25k-50k, 1264.0% for AGIs $75k-100k)
Total itemized deductions: $19,367 (reported on 3.6% of returns)
Here:
$19,367
State:
$34,117
(% of AGI for various income ranges: 484.2% for AGIs $50k-75k)
Taxes paid: $6,733 (reported on 3.6% of returns)
48865:
$6,733
State:
$7,972
(% of AGI for various income ranges: 168.3% for AGIs $50k-75k)
Earned income credit: $2,108 (reported on 15.5% of returns)
Here:
$2,108
State:
$2,251
(% of AGI for various income ranges: 71.0% for AGIs below $25k, 59.5% for AGIs $25k-50k)
Percentage of individuals using paid preparers for their 2020 taxes: 95.2%
Here:
95%
State:
93%
(% for various income ranges: 96.4% for AGIs below $25k, 96.0% for AGIs $25k-50k, 100.0% for AGIs $50k-75k, 87.5% for AGIs $75k-100k, 87.5% for AGIs $100k-200k)
Averages for the 2012 tax year for zip code 48865, filed in 2013:
Average Adjusted Gross Income (AGI) in 2012: $37,845 (Individual Income Tax Returns)
Here:
$37,845
State:
$55,609
Salary/wage: $33,969 (reported on 81.3% of returns)
Here:
$33,969
State:
$46,782
(% of AGI for various income ranges: 69.9% for AGIs below $25k, 73.7% for AGIs $25k-50k, 83.1% for AGIs $50k-75k, 73.5% for AGIs $75k-100k, 58.3% for AGIs $100k-200k)
Taxable interest for individuals: $750 (reported on 24.0% of returns)
This zip code:
$750
Michigan:
$1,491
(% of AGI for various income ranges: 0.7% for AGIs below $25k, 0.7% for AGIs $25k-50k, 0.2% for AGIs $50k-75k, 0.3% for AGIs $75k-100k, 0.6% for AGIs $100k-200k)
Ordinary dividends: $1,050 (reported on 10.7% of returns)
Here:
$1,050
State:
$6,225
(% of AGI for various income ranges: 0.7% for AGIs $25k-50k, 0.2% for AGIs $50k-75k, 0.3% for AGIs $75k-100k)
Net capital gain/loss in AGI: +$10,033 (reported on 8.0% of returns)
Here:
+$10,033
State:
+$9,326
Profit/loss from business: +$6,870 (reported on 13.3% of returns)
Here:
+$6,870
State:
+$11,523
Taxable individual retirement arrangement distribution: $10,071 (reported on 9.3% of returns)
48865:
$10,071
Michigan:
$15,298
Total itemized deductions: $15,471 (22% of AGI, reported on 18.7% of returns)
Here:
$15,471
State:
$21,628
Here:
21.9% of AGI
State:
18.4% of AGI
(% of AGI for various income ranges: 6.6% for AGIs $25k-50k, 7.8% for AGIs $50k-75k, 10.0% for AGIs $75k-100k, 12.8% for AGIs $100k-200k)
Charity contributions: $2,280 (reported on 13.3% of returns)
Here:
$2,280
State:
$4,225
(% of AGI for various income ranges: 0.6% for AGIs below $25k, 0.6% for AGIs $50k-75k, 0.7% for AGIs $75k-100k, 2.6% for AGIs $100k-200k)
Taxes paid: $5,207 (reported on 18.7% of returns)
48865:
$5,207
State:
$8,327
(% of AGI for various income ranges: 1.6% for AGIs $25k-50k, 2.5% for AGIs $50k-75k, 3.9% for AGIs $75k-100k, 4.9% for AGIs $100k-200k)
Earned income credit: $2,226 (reported on 25.3% of returns)
Here:
$2,226
State:
$2,306
(% of AGI for various income ranges: 8.4% for AGIs below $25k, 1.3% for AGIs $25k-50k)
Percentage of individuals using paid preparers for their 2012 taxes: 65.3%
Here:
65%
State:
57%
(% for various income ranges: 62.5% for AGIs below $25k, 71.4% for AGIs $25k-50k, 58.3% for AGIs $50k-75k, 66.7% for AGIs $75k-100k, 75.0% for AGIs $100k-200k)
Averages for the 2004 tax year for zip code 48865, filed in 2005:
Average Adjusted Gross Income (AGI) in 2004: $33,882 (Individual Income Tax Returns)
Here:
$33,882
State:
$48,204
Salary/wage: $31,469 (reported on 89.3% of returns)
Here:
$31,469
State:
$42,791
(% of AGI for various income ranges: 84.8% for AGIs below $10k, 74.6% for AGIs $10k-25k, 85.7% for AGIs $25k-50k, 87.6% for AGIs $50k-75k, 88.7% for AGIs $75k-100k, 66.5% for AGIs over 100k)
Taxable interest for individuals: $993 (reported on 34.8% of returns)
This zip code:
$993
Michigan:
$1,725
(% of AGI for various income ranges: 2.6% for AGIs below $10k, 2.9% for AGIs $10k-25k, 1.0% for AGIs $25k-50k, 0.7% for AGIs $50k-75k, 0.1% for AGIs $75k-100k, 0.2% for AGIs over 100k)
Taxable dividends: $793 (reported on 11.1% of returns)
Here:
$793
State:
$3,420
(% of AGI for various income ranges: 0.4% for AGIs $10k-25k, 0.4% for AGIs $25k-50k, 0.2% for AGIs $50k-75k, 0.1% for AGIs $75k-100k)
Net capital gain/loss: +$705 (reported on 7.8% of returns)
Here:
+$705
State:
+$8,532
(% of AGI for various income ranges: 0.2% for AGIs $10k-25k, -0.3% for AGIs $25k-50k, 0.0% for AGIs $50k-75k, 1.6% for AGIs $75k-100k)
Profit/loss from business: +$5,054 (reported on 11.7% of returns)
Here:
+$5,054
State:
+$9,547
(% of AGI for various income ranges: 5.6% for AGIs below $10k, 3.9% for AGIs $10k-25k, 1.8% for AGIs $25k-50k, 0.4% for AGIs $50k-75k, 2.9% for AGIs $75k-100k)
Total itemized deductions: $13,912 (22% of AGI, reported on 21.6% of returns)
Here:
$13,912
State:
$18,509
Here:
22.4% of AGI
State:
20.7% of AGI
(% of AGI for various income ranges: 4.7% for AGIs $10k-25k, 8.2% for AGIs $25k-50k, 8.6% for AGIs $50k-75k, 13.6% for AGIs $75k-100k, 12.5% for AGIs over 100k)
Charity contributions deductions: $1,953 (3% of AGI, reported on 16.3% of returns)
Here:
$1,953
State:
$3,365
Here:
2.9% of AGI
State:
3.6% of AGI
(% of AGI for various income ranges: 1.7% for AGIs below $10k, 0.8% for AGIs $25k-50k, 0.9% for AGIs $50k-75k, 2.1% for AGIs $75k-100k, 1.1% for AGIs over 100k)
Total tax: $3,684 (reported on 71.9% of returns)
48865:
$3,684
State:
$7,691
(% of AGI for various income ranges: 2.9% for AGIs below $10k, 3.9% for AGIs $10k-25k, 6.1% for AGIs $25k-50k, 7.7% for AGIs $50k-75k, 10.3% for AGIs $75k-100k, 15.9% for AGIs over 100k)
Earned income credit: $1,652 (reported on 20.5% of returns)
Here:
$1,652
State:
$1,737
Percentage of individuals using paid preparers for their 2004 taxes: 61.8%
Here:
62%
State:
60%
(% for various income ranges: 59.5% for AGIs below $10k, 59.0% for AGIs $10k-25k, 63.7% for AGIs $25k-50k, 61.3% for AGIs $50k-75k, 69.8% for AGIs $75k-100k, 68.2% for AGIs over 100k)
Household received Food Stamps/SNAP in the past 12 months: 118 Household did not receive Food Stamps/SNAP in the past 12 months: 523
Women who had a birth in the past 12 months: 12 (12 now married, 0 unmarried) Women who did not have a birth in the past 12 months: 418 (228 now married, 188 unmarried)
Housing units in zip code 48865 with a mortgage: 241 (12 second mortgage, 9 both second mortgage and home equity loan) Median monthly owner costs for units with a mortgage: $1,081 Median monthly owner costs for units without a mortgage: $391
Residents with income below the poverty level in 2022:
This zip code:
18.6%
Whole state:
13.4%
Residents with income below 50% of the poverty level in 2022:
This zip code:
9.8%
Whole state:
6.9%
Median number of rooms in houses and condos:
Here:
5.6
State:
6.5
Median number of rooms in apartments:
Here:
5.2
State:
4.3
Notable locations in this zip code not listed on our city pages
In group quarters: 1 (-1 institutionalized population)
Size of family households: 224 2-persons, 60 3-persons, 73 4-persons, 60 5-persons, 20 6-persons, 13 7-or-more-persons
Size of nonfamily households: 145 1-person, 41 2-persons
210 married couples with children.
83 single-parent households (26 men, 57 women).
92.6% of residents of 48865 zip code speak English at home.
7.1% of residents speak Spanish at home (65% very well, 21% not well, 14% not at all).
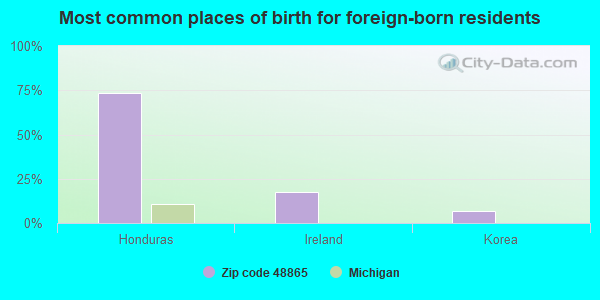
Foreign born population: 55 (2.9%) (5.5% of them are naturalized citizens)
This zip code:
2.9%
Whole state:
6.9%
74%Honduras
18%Ireland
7%Korea
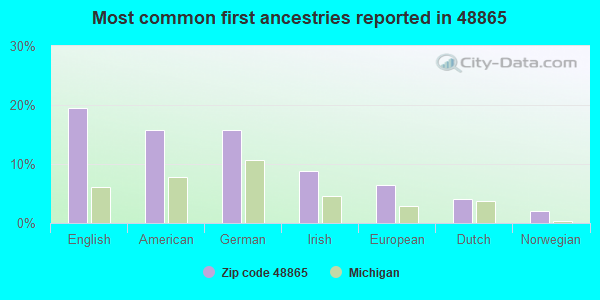
20%English
16%American
16%German
9%Irish
6%European
4%Dutch
2%Norwegian
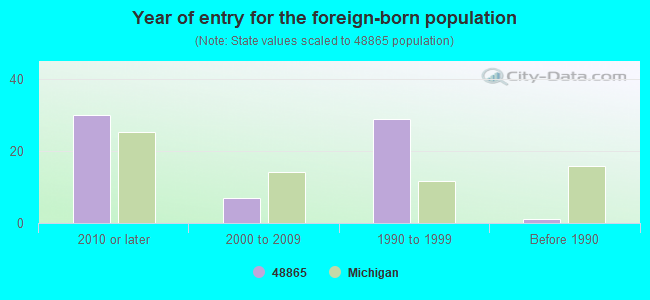
Year of entry for the foreign-born population
302010 or later
72000 to 2009
291990 to 1999
1Before 1990
Facilities with environmental interests located in this zip code:
FARMERS GAS & OIL CO (6006 N STATE ST in ORLEANS, MI)
(Resource Conservation and Recovery Act (tracking hazardous waste)) Organizations: FARMERS OIL & GAS CO (CONTACT/OWNER)
Housing units lacking complete plumbing facilities: 2.2% Housing units lacking complete kitchen facilities: 0.5%
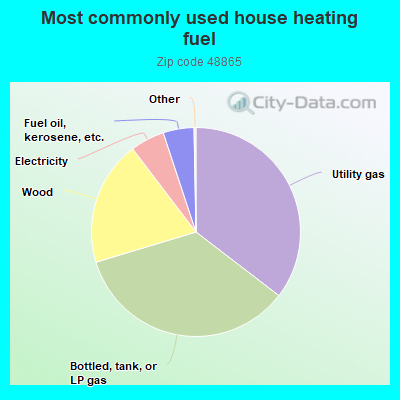
35.6%Utility gas
35.1%Bottled, tank, or LP gas
19.4%Wood
5.3%Electricity
4.8%Fuel oil, kerosene, etc.
Population in 1990: 1,678. Population change in the 1990s: +174 (+10.4%).
Place of birth for U.S.-born residents:
This state: 1,652
Northeast: 11
Midwest: 75
South: 61
West: 40
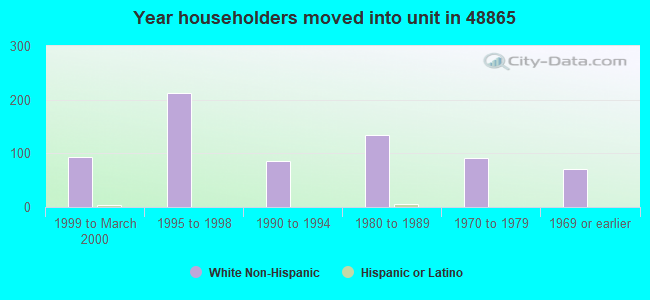
62% of the 48865 zip code residents lived in the same house 5 years ago. Out of people who lived in different houses, 52% lived in this county. Out of people who lived in different counties, 50% lived in Michigan.
96% of the 48865 zip code residents lived in the same house 1 year ago. Out of people who lived in different houses, 62% moved from this county. Out of people who lived in different houses, 40% moved from different county within same state.
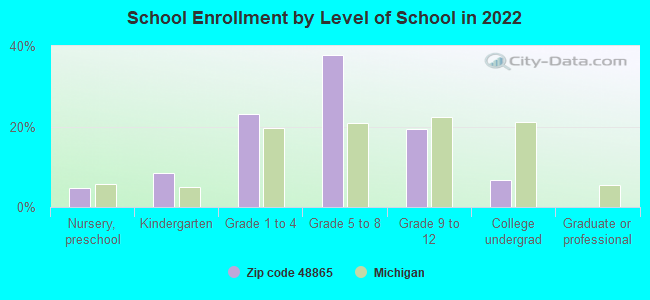
Private vs. public school enrollment:
Students in private schools in grades 1 to 8 (elementary and middle school): 18
Here:
8.5%
Michigan:
12.4%
Students in private schools in grades 9 to 12 (high school): 8
Here:
12.1%
Michigan:
9.8%
Students in private undergraduate colleges: 5
Here:
21.3%
Michigan:
14.9%
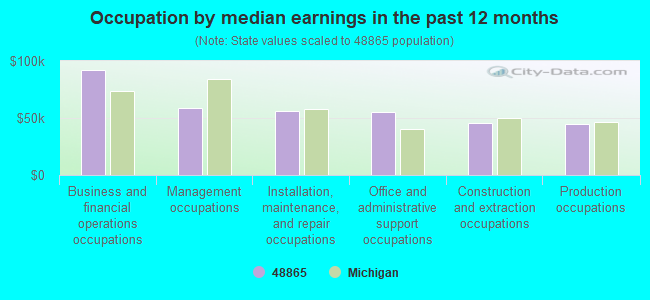
Occupation by median earnings in the past 12 months ($)
91,707Business and financial operations occupations
58,615Management occupations
56,558Installation, maintenance, and repair occupations
54,894Office and administrative support occupations
45,965Construction and extraction occupations
44,546Production occupations
Top industries in this zip code by the number of employees in 2005:
Other Services (except Public Administration): Other Social Advocacy Organizations (10-19 employees: 1 establishment)
Construction: New Single-Family Housing Construction (except Operative Builders) (1-4: 1)
Construction: Plumbing, Heating, and Air-Conditioning Contractors (1-4: 1)
Accommodation and Food Services: Snack and Nonalcoholic Beverage Bars (1-4: 1)
Wholesale Trade: Wholesale Trade Agents and Brokers (1-4: 1)
Health Care and Social Assistance: Offices of Physicians (except Mental Health Specialists) (1-4: 1)
People in group quarters in 2010:
5 people in group homes intended for adults
People in group quarters in 2000:
5 people in other group homes
Fatal accident statistics in 2012:
Fatal accident count: 1
Vehicles involved in fatal accidents: 1
Fatal accidents caused by drunken drivers: 1
Fatalities: 1
Persons involved in fatal accidents: 1
Pedestrians involved in fatal accidents: 0
Fatal accident statistics in 2011:
Fatal accident count: 2
Vehicles involved in fatal accidents: 5
Fatal accidents caused by drunken drivers: 4
Fatalities: 2
Persons involved in fatal accidents: 8
Pedestrians involved in fatal accidents: 0
Home Mortgage Disclosure Act Aggregated Statistics For Year 2009 (Based on 2 partial tracts)
A) FHA, FSA/RHS & VA Home Purchase Loans
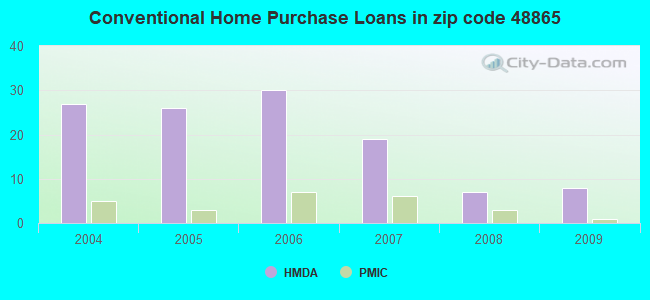
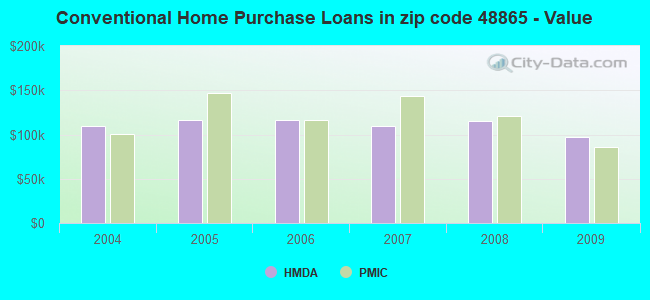
B) Conventional Home Purchase Loans
C) Refinancings
D) Home Improvement Loans
F) Non-occupant Loans on < 5 Family Dwellings (A B C & D)
G) Loans On Manufactured Home Dwelling (A B C & D)
Number
Average Value
Number
Average Value
Number
Average Value
Number
Average Value
Number
Average Value
Number
Average Value
LOANS ORIGINATED
9
$88,314
8
$96,785
49
$120,812
5
$45,498
4
$87,878
3
$74,000
APPLICATIONS APPROVED, NOT ACCEPTED
0
$0
0
$0
5
$142,042
0
$0
0
$0
0
$0
APPLICATIONS DENIED
3
$67,263
3
$45,567
28
$132,965
3
$33,460
1
$190,490
4
$67,492
APPLICATIONS WITHDRAWN
2
$61,155
1
$125,390
12
$132,243
0
$0
1
$104,150
1
$70,920
FILES CLOSED FOR INCOMPLETENESS
1
$30,830
1
$130,530
2
$111,690
0
$0
0
$0
0
$0
Aggregated Statistics For Year 2008 (Based on 2 partial tracts)
A) FHA, FSA/RHS & VA Home Purchase Loans
B) Conventional Home Purchase Loans
C) Refinancings
D) Home Improvement Loans
F) Non-occupant Loans on < 5 Family Dwellings (A B C & D)
G) Loans On Manufactured Home Dwelling (A B C & D)
Number
Average Value
Number
Average Value
Number
Average Value
Number
Average Value
Number
Average Value
Number
Average Value
LOANS ORIGINATED
4
$103,122
7
$115,211
37
$108,919
4
$26,210
5
$91,474
7
$76,106
APPLICATIONS APPROVED, NOT ACCEPTED
2
$53,275
1
$98,330
7
$143,304
1
$56,530
0
$0
2
$68,005
APPLICATIONS DENIED
3
$109,860
6
$70,462
27
$116,446
8
$55,630
1
$105,520
8
$90,618
APPLICATIONS WITHDRAWN
1
$136,700
1
$220,980
6
$118,597
1
$16,100
0
$0
1
$130,530
FILES CLOSED FOR INCOMPLETENESS
0
$0
0
$0
2
$124,020
0
$0
0
$0
0
$0
Aggregated Statistics For Year 2007 (Based on 2 partial tracts)
A) FHA, FSA/RHS & VA Home Purchase Loans
B) Conventional Home Purchase Loans
C) Refinancings
D) Home Improvement Loans
F) Non-occupant Loans on < 5 Family Dwellings (A B C & D)
G) Loans On Manufactured Home Dwelling (A B C & D)
Number
Average Value
Number
Average Value
Number
Average Value
Number
Average Value
Number
Average Value
Number
Average Value
LOANS ORIGINATED
2
$110,830
19
$109,956
53
$115,993
10
$43,373
8
$88,605
13
$79,562
APPLICATIONS APPROVED, NOT ACCEPTED
0
$0
2
$82,055
12
$134,784
1
$96,960
1
$65,440
2
$89,075
APPLICATIONS DENIED
2
$113,230
6
$99,982
46
$115,091
9
$57,442
3
$86,793
9
$77,123
APPLICATIONS WITHDRAWN
1
$109,970
3
$105,520
12
$135,812
1
$44,540
1
$168,220
1
$97,640
FILES CLOSED FOR INCOMPLETENESS
0
$0
0
$0
3
$146,977
0
$0
0
$0
0
$0
Aggregated Statistics For Year 2006 (Based on 2 partial tracts)
A) FHA, FSA/RHS & VA Home Purchase Loans
B) Conventional Home Purchase Loans
C) Refinancings
D) Home Improvement Loans
F) Non-occupant Loans on < 5 Family Dwellings (A B C & D)
G) Loans On Manufactured Home Dwelling (A B C & D)
Number
Average Value
Number
Average Value
Number
Average Value
Number
Average Value
Number
Average Value
Number
Average Value
LOANS ORIGINATED
1
$178,150
30
$116,176
61
$104,470
12
$39,742
7
$98,277
13
$68,731
APPLICATIONS APPROVED, NOT ACCEPTED
0
$0
5
$99,286
13
$108,525
2
$52,420
1
$73,320
2
$75,030
APPLICATIONS DENIED
1
$85,650
7
$92,404
40
$117,897
7
$62,206
2
$101,410
7
$81,979
APPLICATIONS WITHDRAWN
1
$100,720
5
$79,072
19
$114,446
1
$59,610
1
$89,760
2
$110,315
FILES CLOSED FOR INCOMPLETENESS
0
$0
1
$116,480
6
$113,172
1
$24,320
0
$0
0
$0
Aggregated Statistics For Year 2005 (Based on 2 partial tracts)
A) FHA, FSA/RHS & VA Home Purchase Loans
B) Conventional Home Purchase Loans
C) Refinancings
D) Home Improvement Loans
F) Non-occupant Loans on < 5 Family Dwellings (A B C & D)
G) Loans On Manufactured Home Dwelling (A B C & D)
Number
Average Value
Number
Average Value
Number
Average Value
Number
Average Value
Number
Average Value
Number
Average Value
LOANS ORIGINATED
2
$130,360
26
$116,102
76
$118,211
11
$46,718
7
$113,009
12
$73,688
APPLICATIONS APPROVED, NOT ACCEPTED
0
$0
3
$93,417
15
$142,819
2
$56,360
0
$0
3
$75,943
APPLICATIONS DENIED
1
$89,420
7
$92,844
61
$126,908
7
$68,226
1
$166,160
14
$93,799
APPLICATIONS WITHDRAWN
0
$0
6
$108,433
35
$151,547
3
$132,130
2
$127,105
2
$127,960
FILES CLOSED FOR INCOMPLETENESS
0
$0
1
$95,930
9
$121,661
0
$0
0
$0
1
$73,660
Aggregated Statistics For Year 2004 (Based on 2 partial tracts)
A) FHA, FSA/RHS & VA Home Purchase Loans
B) Conventional Home Purchase Loans
C) Refinancings
D) Home Improvement Loans
F) Non-occupant Loans on < 5 Family Dwellings (A B C & D)
G) Loans On Manufactured Home Dwelling (A B C & D)
Detailed PMIC statistics for the following Tracts:0304.00
2002 - 2018 National Fire Incident Reporting System (NFIRS) incidents
Based on the data from the years 2002 - 2018 the average number of fire incidents per year is 8. The highest number of fire incidents - 22 took place in 2018, and the least - 1 in 2002. The data has a rising trend.
When looking into fire subcategories, the most incidents belonged to: Structure Fires (51.9%), and Outside Fires (31.3%).
Fire incident types reported to NFIRS in Zip Code 48865

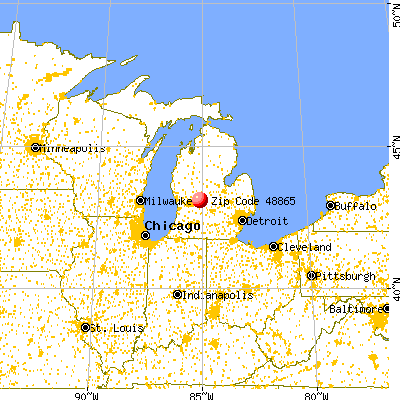


 Nearest zip codes: 48834, 48846, 48870, 48884, 48809, 48885.


 Based on the data from the years 2002 - 2018 the average number of fire incidents per year is 8. The highest number of fire incidents - 22 took place in 2018, and the least - 1 in 2002. The data has a rising trend.
 When looking into fire subcategories, the most incidents belonged to: Structure Fires (51.9%), and Outside Fires (31.3%).