Estimated zip code population in 2022: 4,591 Zip code population in 2010: 4,014 Zip code population in 2000: 3,473
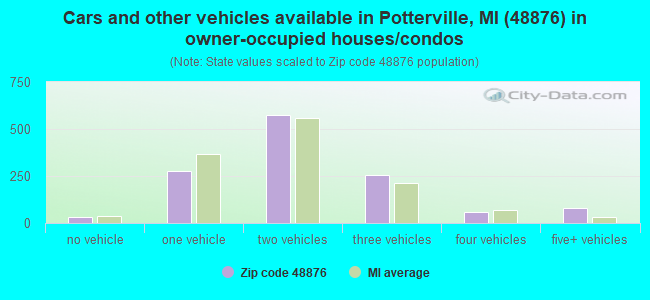
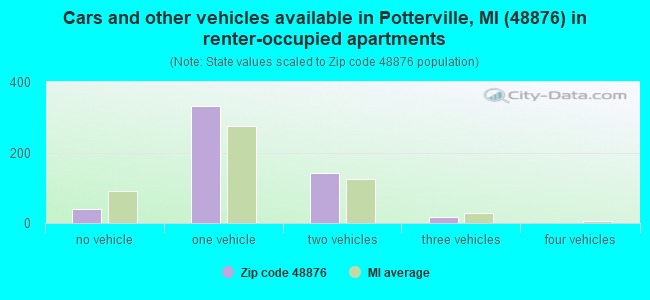
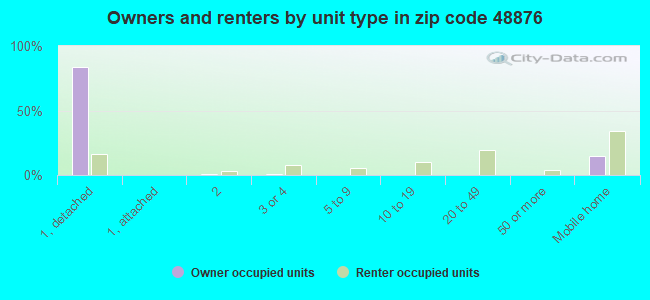
Houses and condos: 1,913 Renter-occupied apartments: 525
% of renters here:
29%
State:
27%
March 2022 cost of living index in zip code 48876: 84.0 (less than average, U.S. average is 100)
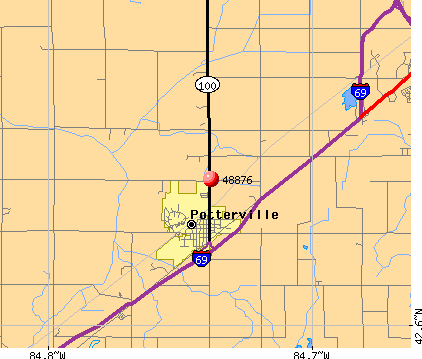
Land area: 13.8 sq. mi. Water area: 0.2 sq. mi.
Population density: 332 people per square mile
(very low).
OSM Map
General Map
Google Map
MSN Map
OSM Map
General Map
Google Map
MSN Map
OSM Map
General Map
Google Map
MSN Map
OSM Map
General Map
Google Map
MSN Map
Please wait while loading the map...
Real estate property taxes paid for housing units in 2022:
This zip code:
1.4% ($2,839)
Michigan:
1.2% ($2,746)
Median real estate property taxes paid for housing units with mortgages in 2022: $3,252 (1.6%) Median real estate property taxes paid for housing units with no mortgage in 2022: $2,386 (1.4%)
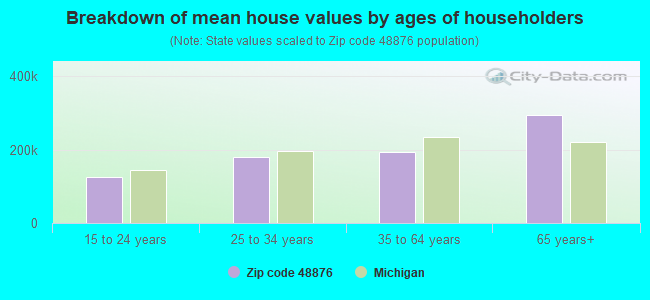
Estimated median house/condo value in 2022: $197,842
48876:
$197,842
Michigan:
$224,400
According to our research of Michigan and other state lists, there were 12 registered sex offenders living in 48876 zip code as of April 27, 2024. The ratio of all residents to sex offenders in zip code 48876 is 324 to 1. The ratio of registered sex offenders to all residents in this zip code is near the state average.
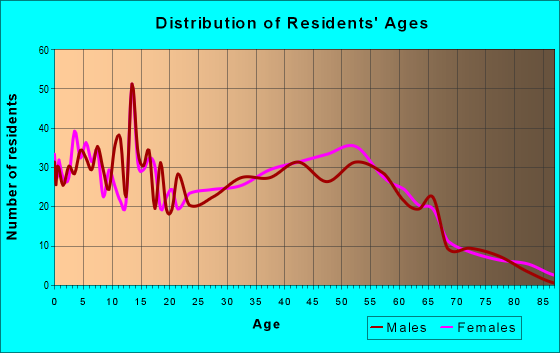
Median resident age:
This zip code:
34.8 years
Michigan median age:
40.3 years
Average household size:
This zip code:
2.5 people
Michigan:
2.4 people
Averages for the 2020 tax year for zip code 48876, filed in 2021:
Average Adjusted Gross Income (AGI) in 2020: $54,728 (Individual Income Tax Returns)
Here:
$54,728
State:
$68,945
Salary/wage: $47,714 (reported on 83.6% of returns)
Here:
$47,714
State:
$57,142
(% of AGI for various income ranges: 974.6% for AGIs below $25k, 3281.0% for AGIs $25k-50k, 6307.7% for AGIs $50k-75k, 8232.6% for AGIs $75k-100k, 16197.5% for AGIs $100k-200k)
Taxable interest for individuals: $500 (reported on 24.4% of returns)
This zip code:
$500
Michigan:
$1,630
(% of AGI for various income ranges: 7.5% for AGIs below $25k, 11.4% for AGIs $25k-50k, 14.2% for AGIs $50k-75k, 32.6% for AGIs $75k-100k, 28.1% for AGIs $100k-200k)
Ordinary dividends: $1,768 (reported on 10.3% of returns)
Here:
$1,768
State:
$6,972
(% of AGI for various income ranges: 10.8% for AGIs below $25k, 20.0% for AGIs $25k-50k, 21.9% for AGIs $50k-75k, 32.6% for AGIs $75k-100k, 73.8% for AGIs $100k-200k)
Net capital gain/loss in AGI: +$8,285 (reported on 9.4% of returns)
Here:
+$8,285
State:
+$20,064
(% of AGI for various income ranges: 3.8% for AGIs below $25k, 6.2% for AGIs $25k-50k, 35.4% for AGIs $50k-75k, 77.4% for AGIs $75k-100k, 855.6% for AGIs $100k-200k)
Profit/loss from business: +$6,500 (reported on 11.3% of returns)
Here:
+$6,500
State:
+$11,172
(% of AGI for various income ranges: 55.4% for AGIs below $25k, 75.4% for AGIs $25k-50k, 81.9% for AGIs $50k-75k, 102.1% for AGIs $75k-100k, 318.8% for AGIs $100k-200k)
Taxable individual retirement arrangement distribution: $14,880 (reported on 7.0% of returns)
48876:
$14,880
Michigan:
$19,803
(% of AGI for various income ranges: 40.8% for AGIs below $25k, 73.4% for AGIs $25k-50k, 166.2% for AGIs $50k-75k, 311.6% for AGIs $75k-100k, 403.1% for AGIs $100k-200k)
Total itemized deductions: $26,433 (reported on 2.8% of returns)
Here:
$26,433
State:
$34,117
(% of AGI for various income ranges: 283.1% for AGIs $50k-75k, 531.2% for AGIs $100k-200k)
Charity contributions: $7,475 (reported on 1.9% of returns)
Here:
$7,475
State:
$13,548
(% of AGI for various income ranges: 26.7% for AGIs below $25k, 106.9% for AGIs $100k-200k)
Taxes paid: $6,386 (reported on 3.3% of returns)
48876:
$6,386
State:
$7,972
(% of AGI for various income ranges: 82.3% for AGIs $50k-75k, 145.6% for AGIs $100k-200k)
Earned income credit: $2,237 (reported on 14.1% of returns)
Here:
$2,237
State:
$2,251
(% of AGI for various income ranges: 67.3% for AGIs below $25k, 69.6% for AGIs $25k-50k)
Percentage of individuals using paid preparers for their 2020 taxes: 95.3%
Here:
95%
State:
93%
(% for various income ranges: 93.8% for AGIs below $25k, 96.7% for AGIs $25k-50k, 97.1% for AGIs $50k-75k, 95.8% for AGIs $75k-100k, 96.0% for AGIs $100k-200k, 75.0% for AGIs over 200k)
Averages for the 2012 tax year for zip code 48876, filed in 2013:
Average Adjusted Gross Income (AGI) in 2012: $45,380 (Individual Income Tax Returns)
Here:
$45,380
State:
$55,609
Salary/wage: $40,515 (reported on 88.1% of returns)
Here:
$40,515
State:
$46,782
(% of AGI for various income ranges: 72.6% for AGIs below $25k, 74.6% for AGIs $25k-50k, 79.7% for AGIs $50k-75k, 80.5% for AGIs $75k-100k, 81.8% for AGIs $100k-200k)
Taxable interest for individuals: $628 (reported on 27.5% of returns)
This zip code:
$628
Michigan:
$1,491
(% of AGI for various income ranges: 0.7% for AGIs below $25k, 0.7% for AGIs $25k-50k, 0.3% for AGIs $50k-75k, 0.2% for AGIs $75k-100k, 0.2% for AGIs $100k-200k)
Ordinary dividends: $1,785 (reported on 10.4% of returns)
Here:
$1,785
State:
$6,225
(% of AGI for various income ranges: 0.9% for AGIs below $25k, 0.3% for AGIs $25k-50k, 0.6% for AGIs $50k-75k, 0.1% for AGIs $75k-100k, 0.3% for AGIs $100k-200k)
Net capital gain/loss in AGI: +$577 (reported on 6.7% of returns)
Here:
+$577
State:
+$9,326
(% of AGI for various income ranges: 0.5% for AGIs $100k-200k)
Profit/loss from business: +$5,586 (reported on 11.4% of returns)
Here:
+$5,586
State:
+$11,523
(% of AGI for various income ranges: 4.7% for AGIs below $25k, 1.7% for AGIs $25k-50k, 1.5% for AGIs $50k-75k, 1.2% for AGIs $75k-100k, 0.1% for AGIs $100k-200k)
Taxable individual retirement arrangement distribution: $13,964 (reported on 7.3% of returns)
48876:
$13,964
Michigan:
$15,298
(% of AGI for various income ranges: 1.6% for AGIs below $25k, 2.1% for AGIs $25k-50k, 2.4% for AGIs $50k-75k, 2.3% for AGIs $75k-100k, 2.4% for AGIs $100k-200k)
Total itemized deductions: $17,594 (21% of AGI, reported on 26.4% of returns)
Here:
$17,594
State:
$21,628
Here:
21.4% of AGI
State:
18.4% of AGI
(% of AGI for various income ranges: 5.4% for AGIs below $25k, 8.0% for AGIs $25k-50k, 9.9% for AGIs $50k-75k, 11.6% for AGIs $75k-100k, 13.0% for AGIs $100k-200k)
Charity contributions: $2,712 (reported on 20.7% of returns)
Here:
$2,712
State:
$4,225
(% of AGI for various income ranges: 0.3% for AGIs below $25k, 1.0% for AGIs $25k-50k, 1.3% for AGIs $50k-75k, 1.6% for AGIs $75k-100k, 1.5% for AGIs $100k-200k)
Taxes paid: $6,286 (reported on 26.4% of returns)
48876:
$6,286
State:
$8,327
(% of AGI for various income ranges: 1.1% for AGIs below $25k, 2.3% for AGIs $25k-50k, 3.1% for AGIs $50k-75k, 4.0% for AGIs $75k-100k, 5.7% for AGIs $100k-200k)
Earned income credit: $2,111 (reported on 18.7% of returns)
Here:
$2,111
State:
$2,306
(% of AGI for various income ranges: 6.1% for AGIs below $25k, 1.2% for AGIs $25k-50k)
Percentage of individuals using paid preparers for their 2012 taxes: 51.8%
Here:
52%
State:
57%
(% for various income ranges: 45.9% for AGIs below $25k, 53.8% for AGIs $25k-50k, 54.8% for AGIs $50k-75k, 58.8% for AGIs $75k-100k, 57.9% for AGIs $100k-200k)
Averages for the 2004 tax year for zip code 48876, filed in 2005:
Average Adjusted Gross Income (AGI) in 2004: $42,247 (Individual Income Tax Returns)
Here:
$42,247
State:
$48,204
Salary/wage: $38,703 (reported on 90.5% of returns)
Here:
$38,703
State:
$42,791
(% of AGI for various income ranges: 95.5% for AGIs below $10k, 73.7% for AGIs $10k-25k, 82.1% for AGIs $25k-50k, 87.0% for AGIs $50k-75k, 84.4% for AGIs $75k-100k, 79.2% for AGIs over 100k)
Taxable interest for individuals: $1,085 (reported on 41.5% of returns)
This zip code:
$1,085
Michigan:
$1,725
(% of AGI for various income ranges: 3.0% for AGIs below $10k, 2.7% for AGIs $10k-25k, 1.1% for AGIs $25k-50k, 0.4% for AGIs $50k-75k, 0.4% for AGIs $75k-100k, 1.7% for AGIs over 100k)
Taxable dividends: $1,084 (reported on 16.9% of returns)
Here:
$1,084
State:
$3,420
(% of AGI for various income ranges: 1.9% for AGIs below $10k, 1.7% for AGIs $10k-25k, 0.5% for AGIs $25k-50k, 0.1% for AGIs $50k-75k, 0.1% for AGIs $75k-100k, 0.5% for AGIs over 100k)
Net capital gain/loss: +$3,379 (reported on 13.4% of returns)
Here:
+$3,379
State:
+$8,532
(% of AGI for various income ranges: -2.5% for AGIs below $10k, 0.5% for AGIs $10k-25k, 0.8% for AGIs $25k-50k, 0.3% for AGIs $50k-75k, -0.1% for AGIs $75k-100k, 4.3% for AGIs over 100k)
Profit/loss from business: +$3,895 (reported on 13.6% of returns)
Here:
+$3,895
State:
+$9,547
(% of AGI for various income ranges: 3.7% for AGIs below $10k, 2.3% for AGIs $10k-25k, 0.9% for AGIs $25k-50k, 1.2% for AGIs $50k-75k, 0.1% for AGIs $75k-100k, 2.2% for AGIs over 100k)
IRA payment deduction: $2,368 (reported on 1.1% of returns)
48876:
$2,368
Michigan:
$2,875
Total itemized deductions: $15,049 (22% of AGI, reported on 37.0% of returns)
Here:
$15,049
State:
$18,509
Here:
22.3% of AGI
State:
20.7% of AGI
(% of AGI for various income ranges: 8.7% for AGIs $10k-25k, 12.5% for AGIs $25k-50k, 13.8% for AGIs $50k-75k, 15.8% for AGIs $75k-100k, 13.6% for AGIs over 100k)
Charity contributions deductions: $2,404 (3% of AGI, reported on 30.6% of returns)
Here:
$2,404
State:
$3,365
Here:
3.4% of AGI
State:
3.6% of AGI
(% of AGI for various income ranges: 1.0% for AGIs $10k-25k, 1.4% for AGIs $25k-50k, 1.5% for AGIs $50k-75k, 2.2% for AGIs $75k-100k, 2.6% for AGIs over 100k)
Total tax: $4,902 (reported on 77.4% of returns)
48876:
$4,902
State:
$7,691
(% of AGI for various income ranges: 2.1% for AGIs below $10k, 4.1% for AGIs $10k-25k, 6.2% for AGIs $25k-50k, 8.5% for AGIs $50k-75k, 9.8% for AGIs $75k-100k, 15.2% for AGIs over 100k)
Earned income credit: $1,588 (reported on 13.8% of returns)
Here:
$1,588
State:
$1,737
Percentage of individuals using paid preparers for their 2004 taxes: 58.2%
Here:
58%
State:
60%
(% for various income ranges: 49.0% for AGIs below $10k, 60.3% for AGIs $10k-25k, 61.6% for AGIs $25k-50k, 54.9% for AGIs $50k-75k, 63.9% for AGIs $75k-100k, 65.4% for AGIs over 100k)
Likely homosexual households (counted as self-reported same-sex unmarried-partner households)
Lesbian couples: 1.5% of all households
Gay men: 0.0% of all households
Household received Food Stamps/SNAP in the past 12 months: 244 Household did not receive Food Stamps/SNAP in the past 12 months: 1,562
Women who had a birth in the past 12 months: 102 (70 now married, 31 unmarried) Women who did not have a birth in the past 12 months: 957 (373 now married, 583 unmarried)
Housing units in zip code 48876 with a mortgage: 795 (67 second mortgage, 56 both second mortgage and home equity loan) Houses without a mortgage: 20
Median monthly owner costs for units with a mortgage: $1,440 Median monthly owner costs for units without a mortgage: $583
Residents with income below the poverty level in 2022:
This zip code:
11.7%
Whole state:
13.4%
Residents with income below 50% of the poverty level in 2022:
This zip code:
8.8%
Whole state:
6.9%
Median number of rooms in houses and condos:
Here:
6.5
State:
6.5
Median number of rooms in apartments:
Here:
4.4
State:
4.3
Notable locations in this zip code not listed on our city pages
Notable locations in zip code 48876: Potterville Station (A), Potterville - Benton Township Fire and Emergency Medical Services (B), Potterville Police Department (C), Benton Township Library (D). Display/hide their locations on the map
Churches in zip code 48876 include: Bright Hope Bible Church (A), Potterville United Methodist Church (B), Potterville Church of the Nazarene (C). Display/hide their locations on the map
Parks in zip code 48876 include: Alliance Lake Softball Park (1), Fox Memorial Park (2), Potterville United Methodist Church Historical Marker (3). Display/hide their locations on the map
594 married couples with children.
394 single-parent households (107 men, 287 women).
96.8% of residents of 48876 zip code speak English at home.
1.8% of residents speak Spanish at home (91% very well, 9% not well).
0.6% of residents speak other Indo-European language at home (56% very well, 44% not well).
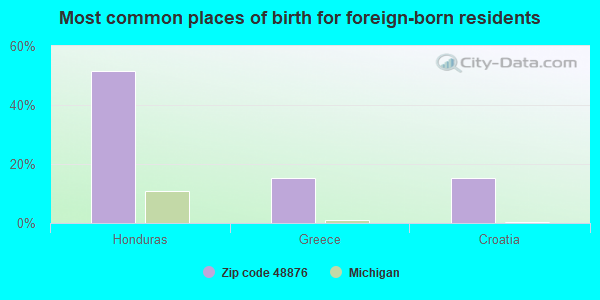
Foreign born population: 32 (0.7%) (49.8% of them are naturalized citizens)
This zip code:
0.7%
Whole state:
6.9%
52%Honduras
15%Greece
15%Croatia
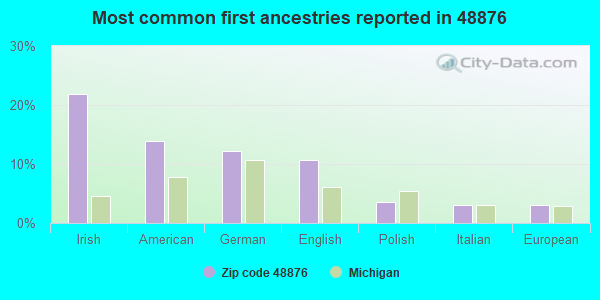
22%Irish
14%American
12%German
11%English
4%Polish
3%Italian
3%European
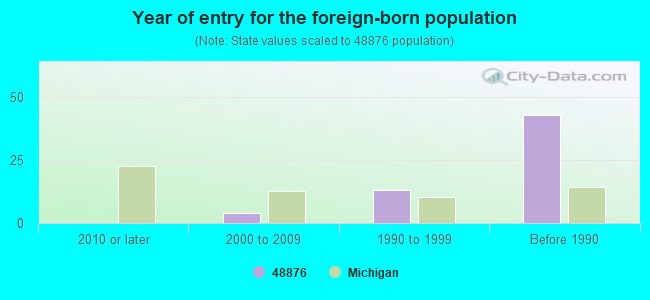
Year of entry for the foreign-born population
02010 or later
42000 to 2009
131990 to 1999
43Before 1990
Major facilities with environmental interests located in this zip code:
AMOCO OIL CO (311 LANSING RD in POTTERVILLE, MI)
(Resource Conservation and Recovery Act (tracking hazardous waste)) Organizations: AMOCO OIL COMPANY (CONTACT/OWNER)
, BP PRODUCTS NORTH AMERICA INC (CONTACT/OWNER)
Alternative names: AMOCO OIL CO 9846
MI DEPT/TRANSPORTATION BRIDGE (M-100 OVER GRAND TRUNK RR in POTTERVILLE, MI)
(Resource Conservation and Recovery Act (tracking hazardous waste)) Organizations: MICH DEPT OF TRANSPORTATION (CONTACT/OPERATOR)
Alternative names: MIDOT BRIDGE M-100 OVER GT RR
ALRO STEEL (5859 ALRO PARK DRIVE in POTTERVILLE, MI)
Conditionally Exempt Small Quantity Generators, less than 100 kg/month of hazardous waste (Resource Conservation and Recovery Act (tracking hazardous waste)) Organizations: ALRO STEEL POTTERVILLE (CONTACT/OPERATOR)
, AL GLICK (CONTACT/OWNER)
21ST CENTURY PLASTICS CORP (345 WRIGHT PKWY in POTTERVILLE, MI)
Conditionally Exempt Small Quantity Generators, less than 100 kg/month of hazardous waste (Resource Conservation and Recovery Act (tracking hazardous waste)) Business NAICS classification: ALL OTHER PLASTICS PRODUCT MANUFACTURING. Organizations: 21ST CENTURY PLASTIC CORP (CONTACT/OWNER)
AT&T CORP (6684 WINDSOR HWY in POTTERVILLE, MI)
Conditionally Exempt Small Quantity Generators, less than 100 kg/month of hazardous waste (Resource Conservation and Recovery Act (tracking hazardous waste)) - notification Organizations: AT&T CORP. (CONTACT/OWNER)
Housing units lacking complete plumbing facilities: 1.8% Housing units lacking complete kitchen facilities: 1.7%
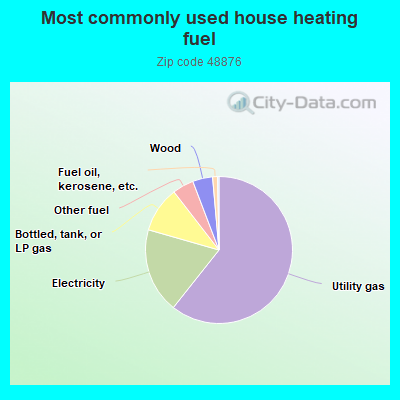
60.8%Utility gas
18.8%Electricity
10.1%Bottled, tank, or LP gas
4.7%Other fuel
4.4%Wood
1.1%Fuel oil, kerosene, etc.
Population in 1990: 2,795. Population change in the 1990s: +678 (+24.3%).
Place of birth for U.S.-born residents:
This state: 3,809
Northeast: 56
Midwest: 293
South: 202
West: 163
50% of the 48876 zip code residents lived in the same house 5 years ago. Out of people who lived in different houses, 58% lived in this county. Out of people who lived in different counties, 50% lived in Michigan.
93% of the 48876 zip code residents lived in the same house 1 year ago. Out of people who lived in different houses, 48% moved from this county. Out of people who lived in different houses, 36% moved from different county within same state. Out of people who lived in different houses, 17% moved from different state.
Private vs. public school enrollment:
Students in private schools in grades 1 to 8 (elementary and middle school): 76
Here:
18.6%
Michigan:
12.4%
Students in private schools in grades 9 to 12 (high school): 73
Here:
31.6%
Michigan:
9.8%
Students in private undergraduate colleges: 29
Here:
18.9%
Michigan:
14.9%
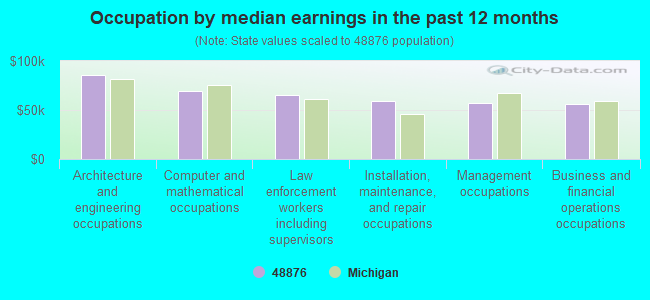
Occupation by median earnings in the past 12 months ($)
85,374Architecture and engineering occupations
69,324Computer and mathematical occupations
65,058Law enforcement workers including supervisors
58,741Installation, maintenance, and repair occupations
56,656Management occupations
56,021Business and financial operations occupations
Companies with federal contracts located in this zip code:
DIESEL EQUIPMENT SALES & SERVI (578 E MAIN ST in POTTERVILLE, MI; small business) : $465,624 in 11 contractsfrom 2002 to 2005
Contracts for Engine Fuel System Components, Nonaircraft, Hand Tools, Nonedged, Nonpowered by Defense Logistics Agency, Federal Supply Service Signed by year:2000: $0; 2001: $0; 2002: $213,776; 2003: $78,875; 2004: $81,973; 2005: $91,000; 2006: $0.
Biggest contracts:
$91,000 with Defense Logistics Agency for Engine Fuel System Components, Nonaircraft. Signed on 2005-04-18. Completion date: 2005-05-25.
$83,127, same as above.Signed on 2002-07-11. Completion date: 2003-01-27.
$80,815, same as above.Signed on 2002-08-05. Completion date: 2003-03-03.
$51,467, same as above.Signed on 2004-03-21. Completion date: 2004-08-18.
Top industries in this zip code by the number of employees in 2005:
Wholesale Trade: Metal Service Centers and Other Metal Merchant Wholesalers (100-249 employees: 1 establishment)
Accommodation and Food Services: Limited-Service Restaurants (50-99: 1)
Accommodation and Food Services: Full-Service Restaurants (20-49: 1)
Administrative and Support and Waste Management and Remediation Services: Landscaping Services (10-19: 1, 1-4: 2)
Real Estate and Rental and Leasing: Video Tape and Disc Rental (10-19: 1)
Fatal accident statistics in 2010:
Fatal accident count: 1
Vehicles involved in fatal accidents: 2
Fatal accidents caused by drunken drivers: 0
Fatalities: 1
Persons involved in fatal accidents: 2
Pedestrians involved in fatal accidents: 0
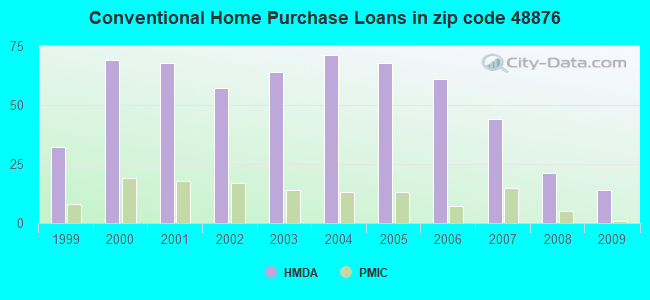
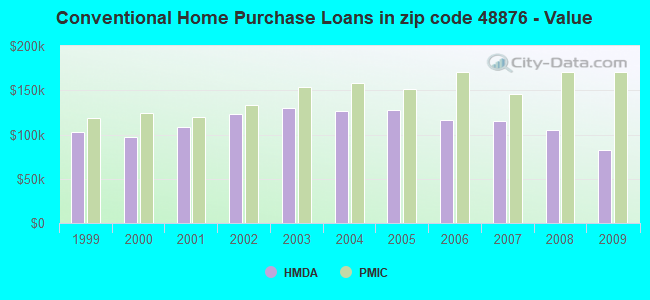
Home Mortgage Disclosure Act Aggregated Statistics For Year 2009 (Based on 4 partial tracts)
A) FHA, FSA/RHS & VA Home Purchase Loans
B) Conventional Home Purchase Loans
C) Refinancings
D) Home Improvement Loans
F) Non-occupant Loans on < 5 Family Dwellings (A B C & D)
G) Loans On Manufactured Home Dwelling (A B C & D)
Number
Average Value
Number
Average Value
Number
Average Value
Number
Average Value
Number
Average Value
Number
Average Value
LOANS ORIGINATED
15
$115,325
14
$82,022
81
$133,861
8
$30,855
2
$78,955
6
$33,910
APPLICATIONS APPROVED, NOT ACCEPTED
0
$0
3
$42,123
11
$156,807
0
$0
0
$0
3
$47,970
APPLICATIONS DENIED
4
$110,955
3
$71,850
25
$162,236
4
$45,310
1
$62,700
3
$42,530
APPLICATIONS WITHDRAWN
3
$120,533
1
$195,090
25
$135,858
1
$27,730
0
$0
1
$98,070
FILES CLOSED FOR INCOMPLETENESS
1
$48,830
1
$52,780
3
$159,233
0
$0
0
$0
0
$0
Aggregated Statistics For Year 2008 (Based on 4 partial tracts)
A) FHA, FSA/RHS & VA Home Purchase Loans
B) Conventional Home Purchase Loans
C) Refinancings
D) Home Improvement Loans
F) Non-occupant Loans on < 5 Family Dwellings (A B C & D)
G) Loans On Manufactured Home Dwelling (A B C & D)
Number
Average Value
Number
Average Value
Number
Average Value
Number
Average Value
Number
Average Value
Number
Average Value
LOANS ORIGINATED
18
$132,237
21
$104,924
58
$127,354
11
$39,477
4
$82,745
8
$47,766
APPLICATIONS APPROVED, NOT ACCEPTED
1
$71,200
5
$71,082
10
$117,729
1
$80,790
0
$0
4
$35,315
APPLICATIONS DENIED
2
$141,370
7
$89,717
32
$148,378
8
$48,056
2
$115,075
3
$43,590
APPLICATIONS WITHDRAWN
2
$110,250
2
$155,945
18
$157,798
1
$84,800
0
$0
1
$56,660
FILES CLOSED FOR INCOMPLETENESS
0
$0
1
$82,560
3
$178,817
0
$0
0
$0
0
$0
Aggregated Statistics For Year 2007 (Based on 4 partial tracts)
A) FHA, FSA/RHS & VA Home Purchase Loans
B) Conventional Home Purchase Loans
C) Refinancings
D) Home Improvement Loans
E) Loans on Dwellings For 5+ Families
F) Non-occupant Loans on < 5 Family Dwellings (A B C & D)
G) Loans On Manufactured Home Dwelling (A B C & D)
Number
Average Value
Number
Average Value
Number
Average Value
Number
Average Value
Number
Average Value
Number
Average Value
Number
Average Value
LOANS ORIGINATED
7
$134,164
44
$115,288
72
$152,883
20
$50,350
1
$275,470
6
$88,482
4
$64,567
APPLICATIONS APPROVED, NOT ACCEPTED
0
$0
6
$103,887
13
$129,659
1
$75,220
0
$0
1
$36,240
2
$27,310
APPLICATIONS DENIED
1
$114,180
12
$103,811
53
$135,583
12
$56,022
0
$0
2
$138,960
4
$54,140
APPLICATIONS WITHDRAWN
1
$56,750
5
$121,724
23
$142,910
1
$103,400
0
$0
1
$129,510
2
$117,485
FILES CLOSED FOR INCOMPLETENESS
0
$0
1
$150,280
8
$140,634
1
$18,560
0
$0
1
$42,750
0
$0
Aggregated Statistics For Year 2006 (Based on 4 partial tracts)
A) FHA, FSA/RHS & VA Home Purchase Loans
B) Conventional Home Purchase Loans
C) Refinancings
D) Home Improvement Loans
F) Non-occupant Loans on < 5 Family Dwellings (A B C & D)
G) Loans On Manufactured Home Dwelling (A B C & D)
Number
Average Value
Number
Average Value
Number
Average Value
Number
Average Value
Number
Average Value
Number
Average Value
LOANS ORIGINATED
5
$139,484
61
$116,291
99
$120,169
22
$49,895
10
$104,495
5
$50,440
APPLICATIONS APPROVED, NOT ACCEPTED
1
$67,280
11
$110,742
21
$135,085
5
$32,218
1
$99,810
2
$35,155
APPLICATIONS DENIED
1
$131,680
16
$82,201
62
$126,972
17
$63,715
6
$76,285
7
$48,009
APPLICATIONS WITHDRAWN
0
$0
6
$140,457
39
$137,398
2
$159,310
2
$93,655
1
$60,400
FILES CLOSED FOR INCOMPLETENESS
0
$0
3
$140,923
14
$157,435
0
$0
0
$0
0
$0
Aggregated Statistics For Year 2005 (Based on 4 partial tracts)
A) FHA, FSA/RHS & VA Home Purchase Loans
B) Conventional Home Purchase Loans
C) Refinancings
D) Home Improvement Loans
F) Non-occupant Loans on < 5 Family Dwellings (A B C & D)
G) Loans On Manufactured Home Dwelling (A B C & D)
Number
Average Value
Number
Average Value
Number
Average Value
Number
Average Value
Number
Average Value
Number
Average Value
LOANS ORIGINATED
6
$128,888
68
$127,924
128
$130,297
18
$49,721
6
$112,343
6
$53,947
APPLICATIONS APPROVED, NOT ACCEPTED
0
$0
11
$102,648
15
$159,646
3
$27,503
0
$0
2
$49,530
APPLICATIONS DENIED
2
$87,585
17
$95,241
68
$134,815
11
$55,932
5
$115,818
9
$56,848
APPLICATIONS WITHDRAWN
0
$0
11
$219,932
48
$138,275
5
$97,946
2
$142,215
1
$124,030
FILES CLOSED FOR INCOMPLETENESS
0
$0
5
$113,272
18
$144,441
1
$39,690
0
$0
0
$0
Aggregated Statistics For Year 2004 (Based on 4 partial tracts)
A) FHA, FSA/RHS & VA Home Purchase Loans
B) Conventional Home Purchase Loans
C) Refinancings
D) Home Improvement Loans
F) Non-occupant Loans on < 5 Family Dwellings (A B C & D)
G) Loans On Manufactured Home Dwelling (A B C & D)
Number
Average Value
Number
Average Value
Number
Average Value
Number
Average Value
Number
Average Value
Number
Average Value
LOANS ORIGINATED
6
$153,058
71
$126,251
148
$118,775
21
$47,965
4
$86,392
10
$53,700
APPLICATIONS APPROVED, NOT ACCEPTED
1
$77,640
10
$114,998
21
$121,040
2
$61,555
0
$0
4
$48,382
APPLICATIONS DENIED
0
$0
16
$107,756
57
$115,614
11
$24,155
2
$99,330
14
$46,223
APPLICATIONS WITHDRAWN
1
$98,650
6
$114,878
29
$134,857
2
$58,610
2
$56,750
1
$115,220
FILES CLOSED FOR INCOMPLETENESS
1
$76,400
1
$114,620
20
$121,768
1
$26,720
1
$104,810
1
$66,150
Aggregated Statistics For Year 2003 (Based on 4 partial tracts)
A) FHA, FSA/RHS & VA Home Purchase Loans
B) Conventional Home Purchase Loans
C) Refinancings
D) Home Improvement Loans
F) Non-occupant Loans on < 5 Family Dwellings (A B C & D)
Number
Average Value
Number
Average Value
Number
Average Value
Number
Average Value
Number
Average Value
LOANS ORIGINATED
8
$125,139
64
$129,755
295
$121,771
11
$29,956
7
$112,169
APPLICATIONS APPROVED, NOT ACCEPTED
0
$0
13
$79,148
37
$120,424
3
$13,047
2
$87,035
APPLICATIONS DENIED
1
$66,560
24
$71,953
79
$104,295
9
$38,970
2
$64,970
APPLICATIONS WITHDRAWN
0
$0
3
$159,147
36
$120,358
1
$16,200
1
$64,800
FILES CLOSED FOR INCOMPLETENESS
1
$96,360
2
$154,750
10
$133,830
1
$19,410
0
$0
Aggregated Statistics For Year 2002 (Based on 4 partial tracts)
A) FHA, FSA/RHS & VA Home Purchase Loans
B) Conventional Home Purchase Loans
C) Refinancings
D) Home Improvement Loans
F) Non-occupant Loans on < 5 Family Dwellings (A B C & D)
Number
Average Value
Number
Average Value
Number
Average Value
Number
Average Value
Number
Average Value
LOANS ORIGINATED
12
$126,096
57
$122,932
226
$116,028
9
$24,831
5
$79,818
APPLICATIONS APPROVED, NOT ACCEPTED
1
$141,790
13
$66,788
25
$119,770
2
$15,780
0
$0
APPLICATIONS DENIED
0
$0
19
$55,025
44
$87,862
7
$13,584
2
$25,535
APPLICATIONS WITHDRAWN
0
$0
2
$216,080
26
$117,908
0
$0
0
$0
FILES CLOSED FOR INCOMPLETENESS
0
$0
1
$74,280
14
$108,879
0
$0
0
$0
Aggregated Statistics For Year 2001 (Based on 4 partial tracts)
A) FHA, FSA/RHS & VA Home Purchase Loans
B) Conventional Home Purchase Loans
C) Refinancings
D) Home Improvement Loans
F) Non-occupant Loans on < 5 Family Dwellings (A B C & D)
Number
Average Value
Number
Average Value
Number
Average Value
Number
Average Value
Number
Average Value
LOANS ORIGINATED
11
$105,022
68
$107,995
190
$104,278
17
$27,347
7
$69,659
APPLICATIONS APPROVED, NOT ACCEPTED
1
$114,160
15
$56,403
21
$101,386
4
$17,060
0
$0
APPLICATIONS DENIED
0
$0
49
$45,893
51
$103,016
13
$13,305
3
$52,590
APPLICATIONS WITHDRAWN
1
$145,660
4
$75,160
28
$108,703
2
$35,360
0
$0
FILES CLOSED FOR INCOMPLETENESS
1
$69,600
2
$94,510
4
$87,498
0
$0
0
$0
Aggregated Statistics For Year 2000 (Based on 4 partial tracts)
A) FHA, FSA/RHS & VA Home Purchase Loans
B) Conventional Home Purchase Loans
C) Refinancings
D) Home Improvement Loans
F) Non-occupant Loans on < 5 Family Dwellings (A B C & D)
Number
Average Value
Number
Average Value
Number
Average Value
Number
Average Value
Number
Average Value
LOANS ORIGINATED
9
$94,270
69
$97,732
59
$84,243
19
$19,128
5
$84,600
APPLICATIONS APPROVED, NOT ACCEPTED
1
$91,960
19
$43,690
23
$75,481
8
$18,504
1
$29,370
APPLICATIONS DENIED
0
$0
69
$42,233
38
$71,993
13
$26,245
4
$41,085
APPLICATIONS WITHDRAWN
1
$96,640
6
$86,682
20
$89,584
2
$67,105
1
$34,160
FILES CLOSED FOR INCOMPLETENESS
0
$0
1
$58,370
3
$97,830
1
$21,370
0
$0
Aggregated Statistics For Year 1999 (Based on 2 partial tracts)
A) FHA, FSA/RHS & VA Home Purchase Loans
B) Conventional Home Purchase Loans
C) Refinancings
D) Home Improvement Loans
F) Non-occupant Loans on < 5 Family Dwellings (A B C & D)
Detailed PMIC statistics for the following Tracts:0206.00
, 0214.00
2002 - 2018 National Fire Incident Reporting System (NFIRS) incidents
Based on the data from the years 2002 - 2018 the average number of fire incidents per year is 18. The highest number of fire incidents - 34 took place in 2007, and the least - 6 in 2004. The data has a declining trend.
When looking into fire subcategories, the most incidents belonged to: Outside Fires (39.7%), and Structure Fires (35.2%).
Fire incident types reported to NFIRS in Zip Code 48876
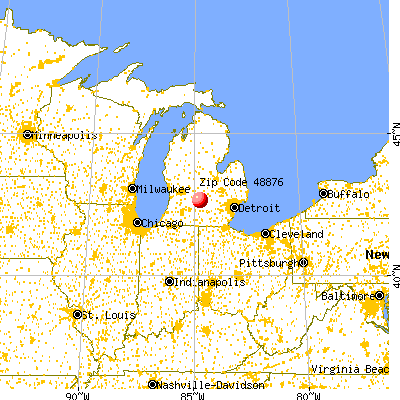


 Nearest zip codes: 48821, 48837, 48917, 48813, 48827, 48911.


 Based on the data from the years 2002 - 2018 the average number of fire incidents per year is 18. The highest number of fire incidents - 34 took place in 2007, and the least - 6 in 2004. The data has a declining trend.
 When looking into fire subcategories, the most incidents belonged to: Outside Fires (39.7%), and Structure Fires (35.2%).