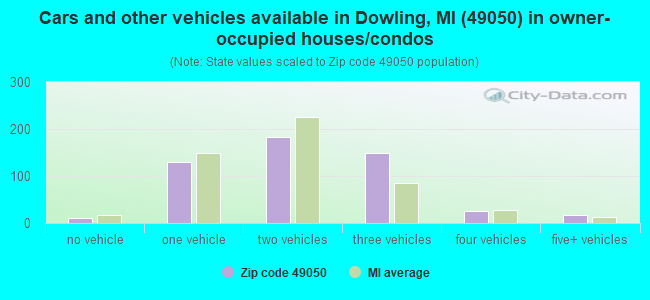
Estimated zip code population in 2022: 1,424 Zip code population in 2010: 1,557 Zip code population in 2000: 1,562
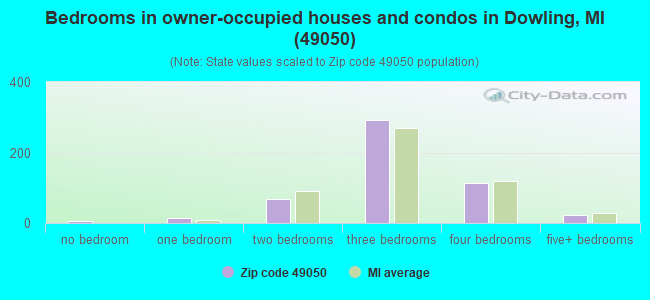
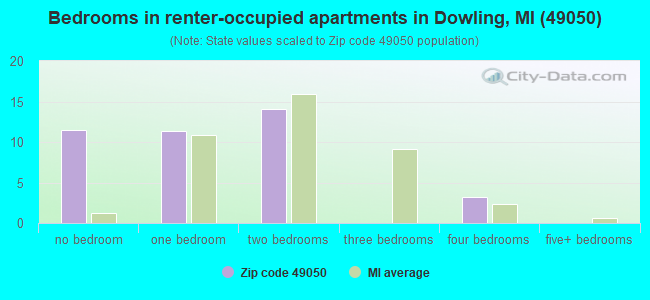
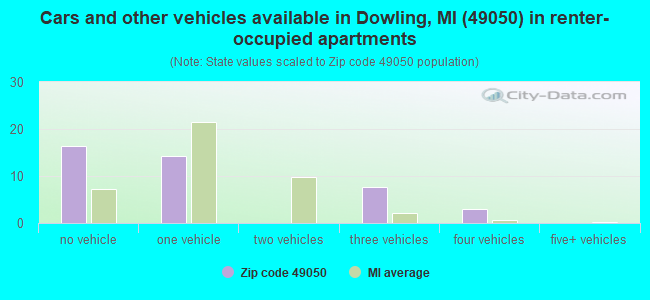
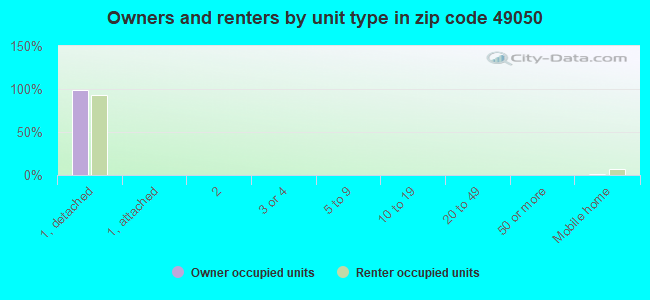
Houses and condos: 620 Renter-occupied apartments: 41
% of renters here:
7%
State:
27%
March 2022 cost of living index in zip code 49050: 81.5 (low, U.S. average is 100)
Land area: 24.9 sq. mi. Water area: 0.7 sq. mi.
Population density: 57 people per square mile
(very low).
OSM Map
General Map
Google Map
MSN Map
OSM Map
General Map
Google Map
MSN Map
OSM Map
General Map
Google Map
MSN Map
OSM Map
General Map
Google Map
MSN Map
Please wait while loading the map...
Real estate property taxes paid for housing units in 2022:
This zip code:
0.8% ($2,104)
Michigan:
1.2% ($2,746)
Median real estate property taxes paid for housing units with mortgages in 2022: $2,101 (1.0%) Median real estate property taxes paid for housing units with no mortgage in 2022: $2,146 (0.6%)
Business Search- 14 Million verified businesses
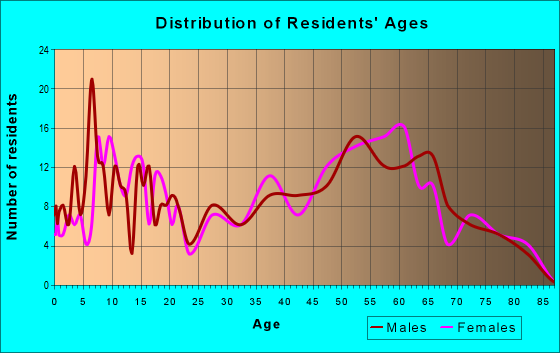
Males: 764
(53.7%)
Females: 659
(46.3%)
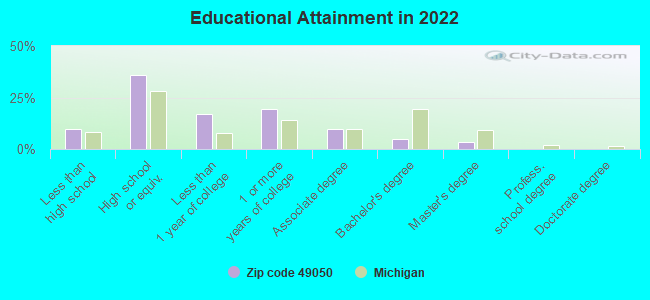
For population 25 years and over in 49050:
High school or higher: 89.4%
Bachelor's degree or higher: 8.5%
Graduate or professional degree: 3.5%
Unemployed: 1.4%
Mean travel time to work (commute): 33.7 minutes
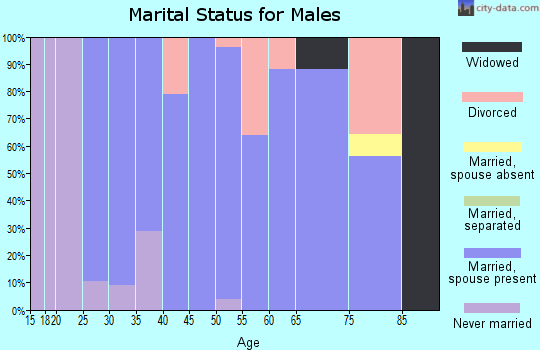
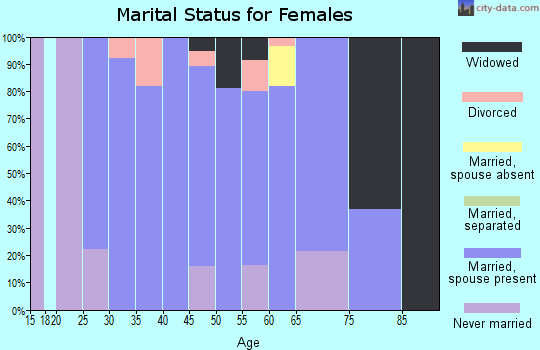
For population 15 years and over in 49050:
Never married: 19.0%
Now married: 68.8%
Separated: 0.8%
Widowed: 6.3%
Divorced: 5.1%
Zip code 49050 compared to state average:
Unemployed percentage significantly below state average.
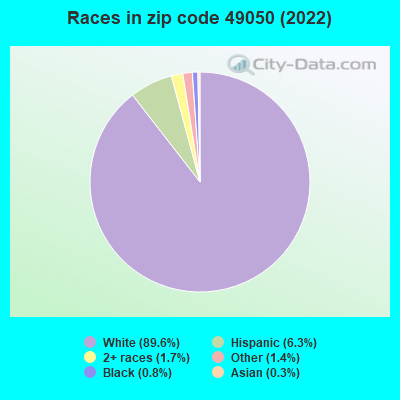
Black race population percentage significantly below state average.
Median age significantly above state average.
Foreign-born population percentage significantly below state average.
Renting percentage significantly below state average.
Length of stay since moving in significantly above state average.
Number of college students below state average.
Percentage of population with a bachelor's degree or higher significantly below state average.
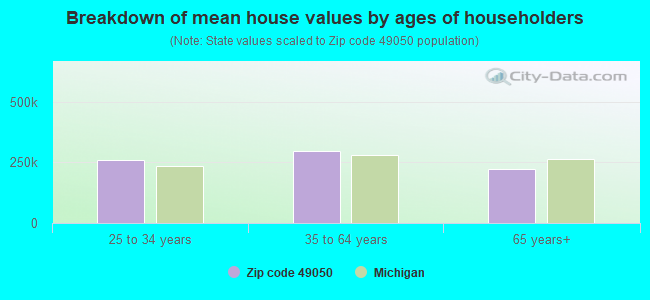
Estimated median house/condo value in 2022: $267,138
49050:
$267,138
Michigan:
$224,400
According to our research of Michigan and other state lists, there were 5 registered sex offenders living in 49050 zip code as of April 28, 2024. The ratio of all residents to sex offenders in zip code 49050 is 295 to 1. The ratio of registered sex offenders to all residents in this zip code is near the state average.
Median resident age:
This zip code:
48.7 years
Michigan median age:
40.3 years
Average household size:
This zip code:
2.6 people
Michigan:
2.4 people
Averages for the 2020 tax year for zip code 49050, filed in 2021:
Average Adjusted Gross Income (AGI) in 2020: $64,189 (Individual Income Tax Returns)
Here:
$64,189
State:
$68,945
Salary/wage: $51,392 (reported on 71.2% of returns)
Here:
$51,392
State:
$57,142
(% of AGI for various income ranges: 860.0% for AGIs below $25k, 2840.6% for AGIs $25k-50k, 4862.9% for AGIs $50k-75k, 7660.0% for AGIs $75k-100k, 17441.4% for AGIs $100k-200k)
Taxable interest for individuals: $524 (reported on 39.7% of returns)
This zip code:
$524
Michigan:
$1,630
(% of AGI for various income ranges: 17.1% for AGIs below $25k, 21.9% for AGIs $25k-50k, 14.3% for AGIs $50k-75k, 7.1% for AGIs $75k-100k, 111.4% for AGIs $100k-200k)
Ordinary dividends: $2,733 (reported on 20.5% of returns)
Here:
$2,733
State:
$6,972
(% of AGI for various income ranges: 27.1% for AGIs below $25k, 40.6% for AGIs $25k-50k, 150.0% for AGIs $50k-75k, 48.6% for AGIs $75k-100k, 240.0% for AGIs $100k-200k)
Net capital gain/loss in AGI: +$6,533 (reported on 16.4% of returns)
Here:
+$6,533
State:
+$20,064
(% of AGI for various income ranges: 3.6% for AGIs below $25k, 19.4% for AGIs $25k-50k, 208.6% for AGIs $50k-75k, 860.0% for AGIs $100k-200k)
Profit/loss from business: +$13,522 (reported on 12.3% of returns)
Here:
+$13,522
State:
+$11,172
(% of AGI for various income ranges: 79.3% for AGIs below $25k, 325.6% for AGIs $25k-50k, 835.7% for AGIs $100k-200k)
Taxable individual retirement arrangement distribution: $14,850 (reported on 16.4% of returns)
49050:
$14,850
Michigan:
$19,803
(% of AGI for various income ranges: 157.1% for AGIs below $25k, 190.6% for AGIs $25k-50k, 802.9% for AGIs $50k-75k, 992.9% for AGIs $100k-200k)
Earned income credit: $1,738 (reported on 11.0% of returns)
Here:
$1,738
State:
$2,251
(% of AGI for various income ranges: 55.7% for AGIs below $25k, 38.1% for AGIs $25k-50k)
Percentage of individuals using paid preparers for their 2020 taxes: 94.5%
Here:
95%
State:
93%
(% for various income ranges: 95.0% for AGIs below $25k, 95.0% for AGIs $25k-50k, 90.9% for AGIs $50k-75k, 100.0% for AGIs $75k-100k, 109.1% for AGIs $100k-200k, 0.0% for AGIs over 200k)
Averages for the 2012 tax year for zip code 49050, filed in 2013:
Average Adjusted Gross Income (AGI) in 2012: $49,873 (Individual Income Tax Returns)
Here:
$49,873
State:
$55,609
Salary/wage: $43,004 (reported on 75.3% of returns)
Here:
$43,004
State:
$46,782
(% of AGI for various income ranges: 63.1% for AGIs below $25k, 67.5% for AGIs $25k-50k, 63.1% for AGIs $50k-75k, 63.2% for AGIs $75k-100k, 65.9% for AGIs $100k-200k)
Taxable interest for individuals: $571 (reported on 38.4% of returns)
This zip code:
$571
Michigan:
$1,491
(% of AGI for various income ranges: 1.7% for AGIs below $25k, 0.4% for AGIs $25k-50k, 0.3% for AGIs $50k-75k, 0.7% for AGIs $75k-100k, 0.1% for AGIs $100k-200k)
Ordinary dividends: $1,880 (reported on 20.5% of returns)
Here:
$1,880
State:
$6,225
(% of AGI for various income ranges: 2.7% for AGIs below $25k, 0.7% for AGIs $25k-50k, 0.8% for AGIs $50k-75k, 0.8% for AGIs $75k-100k, 0.3% for AGIs $100k-200k)
Net capital gain/loss in AGI: +$2,022 (reported on 12.3% of returns)
Here:
+$2,022
State:
+$9,326
(% of AGI for various income ranges: 1.1% for AGIs $25k-50k, 2.0% for AGIs $75k-100k)
Profit/loss from business: +$7,236 (reported on 15.1% of returns)
Here:
+$7,236
State:
+$11,523
(% of AGI for various income ranges: 4.3% for AGIs below $25k, 5.1% for AGIs $25k-50k, 1.3% for AGIs $50k-75k, 3.5% for AGIs $75k-100k)
Taxable individual retirement arrangement distribution: $14,180 (reported on 13.7% of returns)
49050:
$14,180
Michigan:
$15,298
(% of AGI for various income ranges: 3.5% for AGIs below $25k, 4.0% for AGIs $25k-50k, 4.1% for AGIs $50k-75k, 12.0% for AGIs $75k-100k)
Total itemized deductions: $16,390 (19% of AGI, reported on 28.8% of returns)
Here:
$16,390
State:
$21,628
Here:
19.4% of AGI
State:
18.4% of AGI
(% of AGI for various income ranges: 8.6% for AGIs below $25k, 8.4% for AGIs $25k-50k, 9.7% for AGIs $50k-75k, 9.8% for AGIs $75k-100k, 9.9% for AGIs $100k-200k)
Charity contributions: $2,731 (reported on 21.9% of returns)
Here:
$2,731
State:
$4,225
(% of AGI for various income ranges: 1.0% for AGIs $25k-50k, 1.4% for AGIs $50k-75k, 1.5% for AGIs $75k-100k, 1.3% for AGIs $100k-200k)
Taxes paid: $5,405 (reported on 28.8% of returns)
49050:
$5,405
State:
$8,327
(% of AGI for various income ranges: 1.2% for AGIs below $25k, 1.9% for AGIs $25k-50k, 2.6% for AGIs $50k-75k, 3.4% for AGIs $75k-100k, 4.4% for AGIs $100k-200k)
Earned income credit: $2,409 (reported on 15.1% of returns)
Here:
$2,409
State:
$2,306
(% of AGI for various income ranges: 5.9% for AGIs below $25k, 1.2% for AGIs $25k-50k)
Percentage of individuals using paid preparers for their 2012 taxes: 57.5%
Here:
58%
State:
57%
(% for various income ranges: 53.8% for AGIs below $25k, 63.2% for AGIs $25k-50k, 58.3% for AGIs $50k-75k, 57.1% for AGIs $75k-100k, 55.6% for AGIs $100k-200k)
Averages for the 2004 tax year for zip code 49050, filed in 2005:
Average Adjusted Gross Income (AGI) in 2004: $45,321 (Individual Income Tax Returns)
Here:
$45,321
State:
$48,204
Salary/wage: $41,432 (reported on 83.7% of returns)
Here:
$41,432
State:
$42,791
(% of AGI for various income ranges: 78.5% for AGIs below $10k, 60.9% for AGIs $10k-25k, 77.8% for AGIs $25k-50k, 79.2% for AGIs $50k-75k, 85.2% for AGIs $75k-100k, 69.0% for AGIs over 100k)
Taxable interest for individuals: $937 (reported on 51.3% of returns)
This zip code:
$937
Michigan:
$1,725
(% of AGI for various income ranges: 3.9% for AGIs below $10k, 4.6% for AGIs $10k-25k, 0.8% for AGIs $25k-50k, 1.0% for AGIs $50k-75k, 0.1% for AGIs $75k-100k, 0.8% for AGIs over 100k)
Taxable dividends: $1,258 (reported on 26.1% of returns)
Here:
$1,258
State:
$3,420
(% of AGI for various income ranges: 2.3% for AGIs below $10k, 2.0% for AGIs $10k-25k, 0.5% for AGIs $25k-50k, 0.5% for AGIs $50k-75k, 0.1% for AGIs $75k-100k, 1.3% for AGIs over 100k)
Net capital gain/loss: +$3,718 (reported on 19.9% of returns)
Here:
+$3,718
State:
+$8,532
(% of AGI for various income ranges: -2.1% for AGIs below $10k, 0.9% for AGIs $10k-25k, 0.3% for AGIs $25k-50k, 0.6% for AGIs $50k-75k, 0.2% for AGIs $75k-100k, 6.1% for AGIs over 100k)
Profit/loss from business: +$3,755 (reported on 13.7% of returns)
Here:
+$3,755
State:
+$9,547
(% of AGI for various income ranges: 11.7% for AGIs below $10k, 0.2% for AGIs $10k-25k, 1.3% for AGIs $25k-50k, 1.7% for AGIs $50k-75k, 0.9% for AGIs $75k-100k)
IRA payment deduction: $2,500 (reported on 1.4% of returns)
49050:
$2,500
Michigan:
$2,875
Total itemized deductions: $15,815 (22% of AGI, reported on 34.9% of returns)
Here:
$15,815
State:
$18,509
Here:
22.0% of AGI
State:
20.7% of AGI
(% of AGI for various income ranges: 9.8% for AGIs $10k-25k, 11.5% for AGIs $25k-50k, 13.0% for AGIs $50k-75k, 12.3% for AGIs $75k-100k, 13.3% for AGIs over 100k)
Charity contributions deductions: $2,490 (3% of AGI, reported on 28.9% of returns)
Here:
$2,490
State:
$3,365
Here:
3.2% of AGI
State:
3.6% of AGI
(% of AGI for various income ranges: 1.4% for AGIs $25k-50k, 1.6% for AGIs $50k-75k, 1.6% for AGIs $75k-100k, 2.3% for AGIs over 100k)
Total tax: $5,623 (reported on 78.1% of returns)
49050:
$5,623
State:
$7,691
(% of AGI for various income ranges: 2.9% for AGIs below $10k, 3.8% for AGIs $10k-25k, 6.3% for AGIs $25k-50k, 8.9% for AGIs $50k-75k, 10.5% for AGIs $75k-100k, 15.6% for AGIs over 100k)
Earned income credit: $1,891 (reported on 9.0% of returns)
Here:
$1,891
State:
$1,737
Percentage of individuals using paid preparers for their 2004 taxes: 61.6%
Here:
62%
State:
60%
(% for various income ranges: 50.8% for AGIs below $10k, 60.3% for AGIs $10k-25k, 65.7% for AGIs $25k-50k, 65.4% for AGIs $50k-75k, 54.7% for AGIs $75k-100k, 75.0% for AGIs over 100k)
Household received Food Stamps/SNAP in the past 12 months: 29 Household did not receive Food Stamps/SNAP in the past 12 months: 522
Women who had a birth in the past 12 months: 9 (5 now married, 3 unmarried) Women who did not have a birth in the past 12 months: 236 (142 now married, 92 unmarried)
Housing units in zip code 49050 with a mortgage: 305 (13 second mortgage, 8 both second mortgage and home equity loan) Median monthly owner costs for units with a mortgage: $1,417 Median monthly owner costs for units without a mortgage: $585
Residents with income below the poverty level in 2022:
This zip code:
8.6%
Whole state:
13.4%
Residents with income below 50% of the poverty level in 2022:
This zip code:
2.2%
Whole state:
6.9%
Median number of rooms in houses and condos:
Here:
6.8
State:
6.5
Median number of rooms in apartments:
Here:
3.3
State:
4.3
Notable locations in this zip code not listed on our city pages
Churches in zip code 49050 include: Community Church (A), Pleasantville Family Church (B), Cedar Creek Bible Church (C). Display/hide their locations on the map
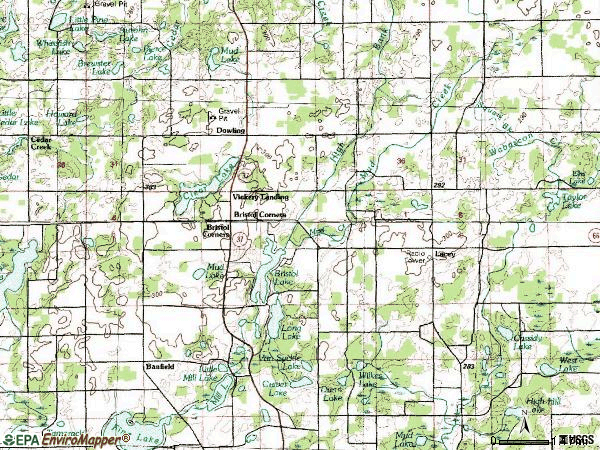
Lakes: Long Lake (A), Von Syckle Lake (B), Howard Lake (C), Mud Lake (D), Dunn Lake (E), Culver Lake (F), Bristol Lake (G). Display/hide their locations on the map
Size of family households: 227 2-persons, 98 3-persons, 31 4-persons, 22 5-persons, 15 6-persons, 12 7-or-more-persons
Size of nonfamily households: 128 1-person, 21 2-persons
154 married couples with children.
13 single-parent households (2 men, 11 women).
94.2% of residents of 49050 zip code speak English at home.
5.8% of residents speak Spanish at home (12% very well, 61% well, 26% not well).
0.7% of residents speak other Indo-European language at home (40% very well, 30% well, 30% not well).
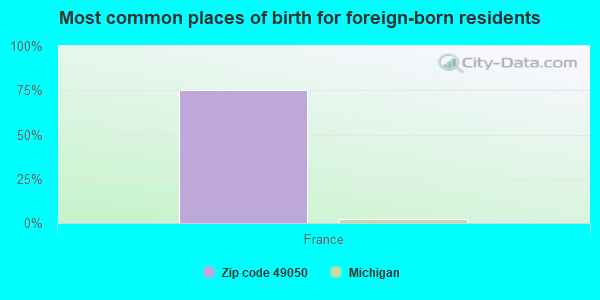
Foreign born population: 4 (0.3%) (100.0% of them are naturalized citizens)
This zip code:
0.3%
Whole state:
6.9%
75%France
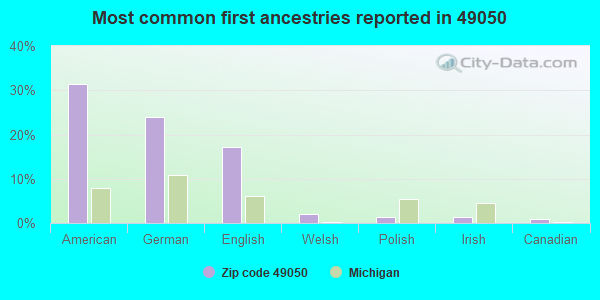
31%American
24%German
17%English
2%Welsh
1%Polish
1%Irish
1%Canadian
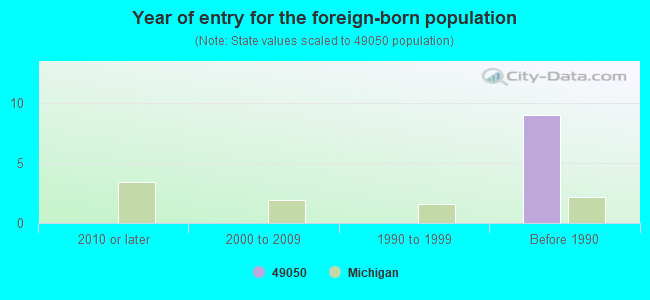
Year of entry for the foreign-born population
02010 or later
02000 to 2009
01990 to 1999
9Before 1990
Facilities with environmental interests located in this zip code:
BATTLE CREEK OUTDOOR ED. CENTER (10160 N. BEDFORD ROAD in DOWLING, MI)
(National Center for Education Statistics) - STATE ID-04968 Organizations: BATTLE CREEK PUBLIC SCHOOLS (SCHOOL DISTRICT)
Housing units lacking complete plumbing facilities: 1.9% Housing units lacking complete kitchen facilities: 4.8%
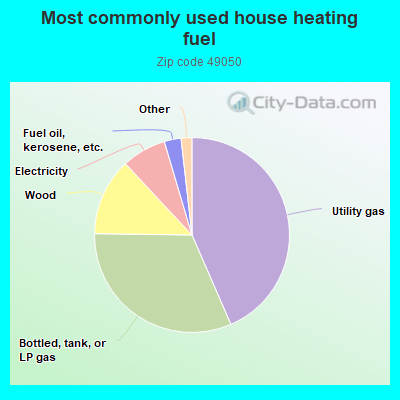
43.7%Utility gas
31.9%Bottled, tank, or LP gas
12.9%Wood
7.4%Electricity
2.8%Fuel oil, kerosene, etc.
0.7%Other fuel
0.7%No fuel used
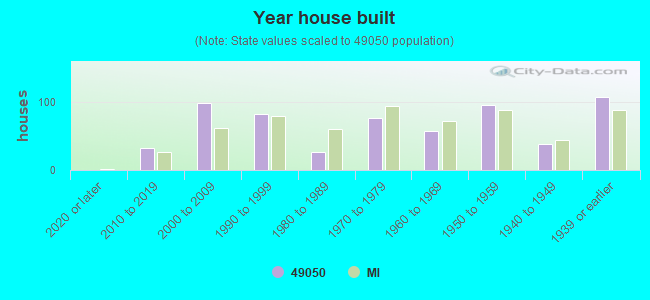
Population in 1990: 909. Population change in the 1990s: +653 (+71.8%).
Place of birth for U.S.-born residents:
This state: 1,126
Northeast: 39
Midwest: 77
South: 107
West: 65
60% of the 49050 zip code residents lived in the same house 5 years ago. Out of people who lived in different houses, 17% lived in this county. Out of people who lived in different counties, 50% lived in Michigan.
95% of the 49050 zip code residents lived in the same house 1 year ago. Out of people who lived in different houses, 19% moved from this county. Out of people who lived in different houses, 81% moved from different county within same state.
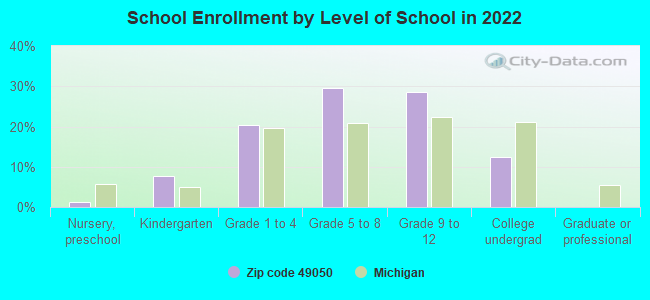
Private vs. public school enrollment:
Students in private schools in grades 1 to 8 (elementary and middle school): 22
Here:
18.6%
Michigan:
12.4%
Students in private schools in grades 9 to 12 (high school): 11
Here:
16.0%
Michigan:
9.8%
Students in private undergraduate colleges:
Here:
0.0%
Michigan:
14.9%
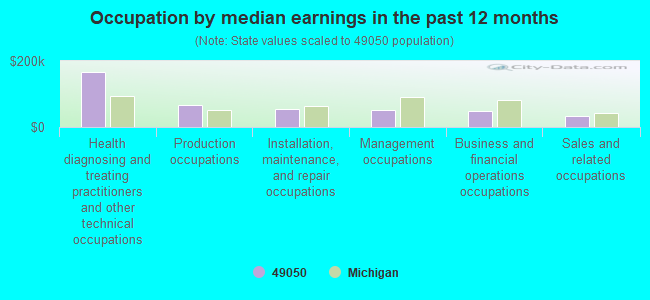
Occupation by median earnings in the past 12 months ($)
165,990Health diagnosing and treating practitioners and other technical occupations
67,069Production occupations
55,463Installation, maintenance, and repair occupations
51,534Management occupations
47,184Business and financial operations occupations
33,722Sales and related occupations
Companies with federal contracts located in this zip code:
TREE MAN CO THE (RT 1 in DOWLING, MI; small business)
$2,950 with Army for Landscaping/Groundskeeping Services. Signed on 2002-05-23. Completion date: 2002-06-14.
Top industries in this zip code by the number of employees in 2005:
Construction: Poured Concrete Foundation and Structure Contractors (10-19 employees: 1 establishment)
Other Services (except Public Administration): Labor Unions and Similar Labor Organizations (5-9: 1)
Construction: Site Preparation Contractors (1-4: 2)
Other Services (except Public Administration): Automotive Body, Paint, and Interior Repair and Maintenance (1-4: 2)
Construction: Masonry Contractors (1-4: 1)
Construction: Residential Remodelers (1-4: 1)
Construction: Commercial and Institutional Building Construction (1-4: 1)
Administrative and Support and Waste Management and Remediation Services: Janitorial Services (1-4: 1)
Fatal accident statistics in 2014:
Fatal accident count: 2
Vehicles involved in fatal accidents: 3
Fatal accidents caused by drunken drivers: 0
Fatalities: 2
Persons involved in fatal accidents: 8
Pedestrians involved in fatal accidents: 1
Fatal accident statistics in 2012:
Fatal accident count: 1
Vehicles involved in fatal accidents: 1
Fatal accidents caused by drunken drivers: 1
Fatalities: 1
Persons involved in fatal accidents: 1
Pedestrians involved in fatal accidents: 0
Home Mortgage Disclosure Act Aggregated Statistics For Year 2009 (Based on 2 partial tracts)
A) FHA, FSA/RHS & VA Home Purchase Loans
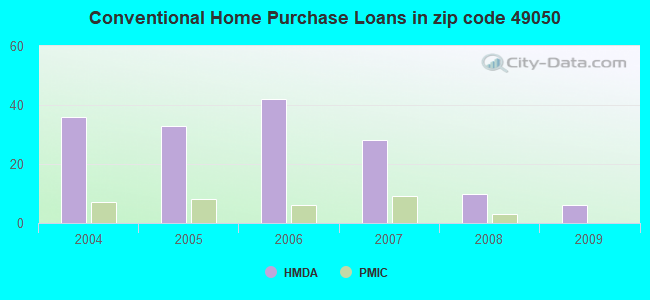
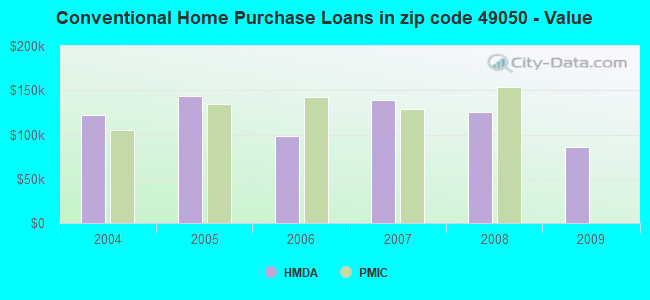
B) Conventional Home Purchase Loans
C) Refinancings
D) Home Improvement Loans
F) Non-occupant Loans on < 5 Family Dwellings (A B C & D)
G) Loans On Manufactured Home Dwelling (A B C & D)
Number
Average Value
Number
Average Value
Number
Average Value
Number
Average Value
Number
Average Value
Number
Average Value
LOANS ORIGINATED
4
$127,050
6
$86,087
63
$139,360
3
$29,773
3
$185,673
3
$62,137
APPLICATIONS APPROVED, NOT ACCEPTED
1
$152,570
1
$104,300
6
$149,888
1
$80,450
0
$0
0
$0
APPLICATIONS DENIED
1
$194,180
4
$129,822
26
$136,033
4
$46,325
2
$105,410
2
$84,885
APPLICATIONS WITHDRAWN
2
$225,250
2
$66,575
16
$129,130
0
$0
1
$22,190
1
$72,120
FILES CLOSED FOR INCOMPLETENESS
0
$0
0
$0
3
$184,933
1
$27,740
1
$104,860
0
$0
Aggregated Statistics For Year 2008 (Based on 2 partial tracts)
A) FHA, FSA/RHS & VA Home Purchase Loans
B) Conventional Home Purchase Loans
C) Refinancings
D) Home Improvement Loans
F) Non-occupant Loans on < 5 Family Dwellings (A B C & D)
G) Loans On Manufactured Home Dwelling (A B C & D)
Number
Average Value
Number
Average Value
Number
Average Value
Number
Average Value
Number
Average Value
Number
Average Value
LOANS ORIGINATED
7
$117,934
10
$124,885
42
$106,825
11
$34,296
6
$156,083
3
$47,343
APPLICATIONS APPROVED, NOT ACCEPTED
1
$139,250
1
$101,530
11
$161,295
1
$8,880
1
$99,310
0
$0
APPLICATIONS DENIED
0
$0
3
$100,050
31
$158,691
3
$94,500
2
$126,495
2
$112,070
APPLICATIONS WITHDRAWN
1
$81,560
2
$80,445
12
$144,202
1
$43,270
1
$38,840
2
$87,660
FILES CLOSED FOR INCOMPLETENESS
1
$97,640
0
$0
2
$122,335
1
$2,770
0
$0
0
$0
Aggregated Statistics For Year 2007 (Based on 2 partial tracts)
A) FHA, FSA/RHS & VA Home Purchase Loans
B) Conventional Home Purchase Loans
C) Refinancings
D) Home Improvement Loans
F) Non-occupant Loans on < 5 Family Dwellings (A B C & D)
G) Loans On Manufactured Home Dwelling (A B C & D)
Number
Average Value
Number
Average Value
Number
Average Value
Number
Average Value
Number
Average Value
Number
Average Value
LOANS ORIGINATED
3
$102,083
28
$138,700
60
$121,621
11
$50,134
14
$106,521
4
$61,305
APPLICATIONS APPROVED, NOT ACCEPTED
1
$88,770
3
$143,693
17
$132,891
2
$17,755
1
$186,970
1
$109,300
APPLICATIONS DENIED
1
$148,690
9
$145,481
46
$139,858
3
$75,267
2
$140,920
2
$62,690
APPLICATIONS WITHDRAWN
1
$97,640
4
$141,058
13
$153,978
1
$24,410
1
$9,430
3
$109,480
FILES CLOSED FOR INCOMPLETENESS
0
$0
2
$147,300
4
$113,458
0
$0
1
$81,000
0
$0
Aggregated Statistics For Year 2006 (Based on 2 partial tracts)
A) FHA, FSA/RHS & VA Home Purchase Loans
B) Conventional Home Purchase Loans
C) Refinancings
D) Home Improvement Loans
F) Non-occupant Loans on < 5 Family Dwellings (A B C & D)
G) Loans On Manufactured Home Dwelling (A B C & D)
Number
Average Value
Number
Average Value
Number
Average Value
Number
Average Value
Number
Average Value
Number
Average Value
LOANS ORIGINATED
7
$120,233
42
$98,411
75
$113,142
21
$50,751
7
$87,183
8
$79,614
APPLICATIONS APPROVED, NOT ACCEPTED
1
$68,800
4
$130,100
11
$116,356
4
$33,428
1
$256,320
1
$28,290
APPLICATIONS DENIED
0
$0
8
$82,735
59
$139,208
9
$77,857
1
$38,840
5
$68,018
APPLICATIONS WITHDRAWN
0
$0
3
$148,687
40
$148,132
5
$92,762
2
$81,835
2
$93,485
FILES CLOSED FOR INCOMPLETENESS
0
$0
0
$0
7
$125,940
0
$0
0
$0
0
$0
Aggregated Statistics For Year 2005 (Based on 2 partial tracts)
A) FHA, FSA/RHS & VA Home Purchase Loans
B) Conventional Home Purchase Loans
C) Refinancings
D) Home Improvement Loans
E) Loans on Dwellings For 5+ Families
F) Non-occupant Loans on < 5 Family Dwellings (A B C & D)
G) Loans On Manufactured Home Dwelling (A B C & D)
Number
Average Value
Number
Average Value
Number
Average Value
Number
Average Value
Number
Average Value
Number
Average Value
Number
Average Value
LOANS ORIGINATED
5
$116,730
33
$143,575
89
$113,503
13
$71,612
1
$69,900
4
$223,585
9
$81,987
APPLICATIONS APPROVED, NOT ACCEPTED
0
$0
4
$90,570
22
$115,323
3
$54,927
0
$0
1
$97,640
0
$0
APPLICATIONS DENIED
1
$39,390
16
$116,127
63
$127,076
8
$56,451
0
$0
2
$180,035
4
$101,390
APPLICATIONS WITHDRAWN
0
$0
5
$88,768
39
$116,693
7
$191,723
0
$0
3
$142,213
2
$83,775
FILES CLOSED FOR INCOMPLETENESS
0
$0
3
$97,273
19
$170,382
3
$107,817
0
$0
0
$0
2
$104,025
Aggregated Statistics For Year 2004 (Based on 2 partial tracts)
A) FHA, FSA/RHS & VA Home Purchase Loans
B) Conventional Home Purchase Loans
C) Refinancings
D) Home Improvement Loans
F) Non-occupant Loans on < 5 Family Dwellings (A B C & D)
G) Loans On Manufactured Home Dwelling (A B C & D)
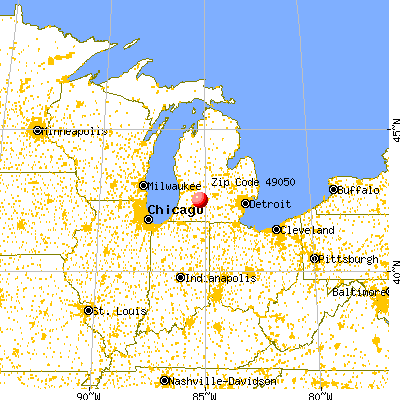


 Nearest zip codes: 49017, 49073, 49058, 49046, 49060, 49012.